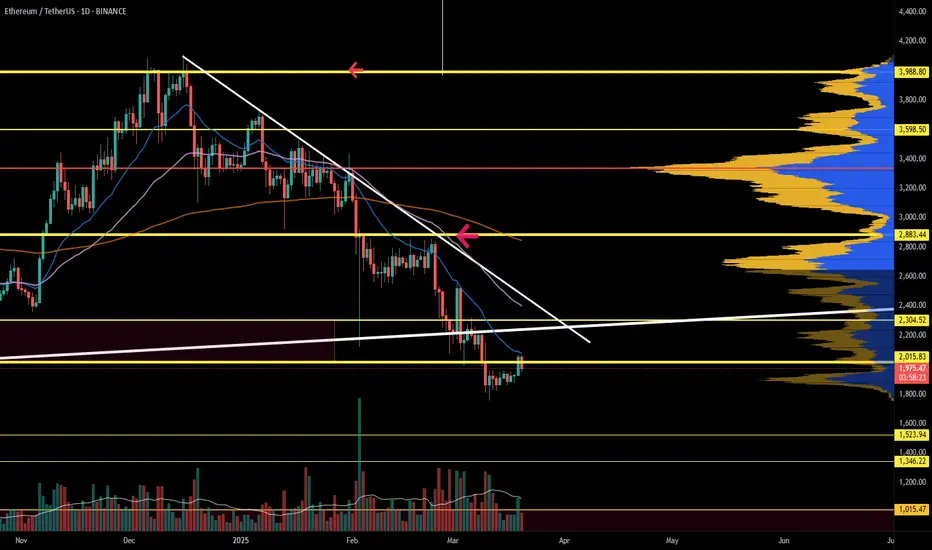
Ethereum (ETH/USDT) 1D Chart Update ETH is still trading inside a descending channel, showing signs of a possible reversal. The price is bouncing off support levels around $1,750-$1,830, with a possible retest of higher resistance levels. The 50-day moving average (red line) is acting as a dynamic resistance above the price.
Bullish scenario: ETH needs to sustain above $1,830 to confirm a short-term correction. If ETH breaks the $2,200-$2,400 resistance zone, a rally toward $2,800-$3,000 could follow.
Bearish scenario: Rejection at the resistance could push ETH back towards $1,830 and possibly $1,750. A loss of $1,750 could trigger a further decline towards $1,600.
Resistance: $2,200, $2,400, $2,800
Support: $1,830, $1,750, $1,600
If you found this analysis helpful, hit the Like button and share your thoughts or questions in the comments below. Your feedback matters!
Thanks for your support!
DYOR. NFA
ETH-D

Breaking: SPX6900 ($SPX) Surged 21% Today The price of SPX6900 ( SP:SPX ) surged Nearly 25% today amidst breakout of a falling wedge.
Created on the Ethereum blockchain, SPX6900 is an advanced blockchain cryptography token coin capable of limitless possibilities and scientific utilization. With a growing momentum and hardworking community the coin seems to be a contender in the incoming bullrun speculated by traders.
As of the time of writing, SP:SPX is up 16.35% trading in tandem with the 1-month high axis. a break above that point could signal a trend continuation to the $0.70 - $0.80 pivot.
Similarly, should SP:SPX cool-off, immediate consolidation point resides in the 38.2% Fibonacci retracement point.
SPX6900 Price Live Data
The live SPX6900 price today is $0.616856 USD with a 24-hour trading volume of $45,031,583 USD. SPX6900 is up 21.61% in the last 24 hours, with a live market cap of $574,288,459 USD. It has a circulating supply of 930,993,090 SPX coins and a max. supply of 1,000,000,000 SPX coins.

Imagine fading ethereumImagine fading CRYPTOCAP:ETH while Fuds maximum pain and capitulation are at their peak!

ETH at a Make-or-Break Level – What’s Next?🚀 Hey Traders!
If you're getting value from this analysis, smash that 👍 & hit Follow for high-accuracy trade setups that actually deliver! 💹🔥
🚨 ETH Update – Critical Level Ahead!
ETH is currently forming a symmetrical triangle on the 2-week timeframe and is now testing the lower trendline. With 4 days left before the candle closes, this level is crucial! 🔥
📌 What’s next?
✅ If ETH bounces from here, we could see a strong bullish move in the coming days.
❌ Invalidation: A close below $1850 could trigger further downside.
📉 Breakdown or Bounce? What’s your take? Drop your thoughts in the comments! 👇💬
🔔 Follow us for real-time updates and winning trade setups! 🚀

Ethereum at the Crossroads: Breakdown or Breakout?Ethereum has seen a steep 60% drop from its highs, but recent activity suggests it might be entering a key transition phase. I’ve entered a long position here with a wide target in place, waiting for clear signs of bullish momentum before adding more size.
Technically, ETH is holding above a strong low on the daily and attempting to reclaim territory beneath a descending trendline. The market has been compressing tightly, and we could soon see expansion either direction. If this is indeed a base forming, it offers a great R:R.
The invalidation lies below the $1,500 daily close—anything below that negates the idea of a shift and brings the $1,000 psychological level into focus. Until then, I treat this as a potential bottom formation trade.
Technicals
• Downtrend structure: ETH has been in a macro downtrend but is showing early signs of compression and possible trend reversal.
• Descending trendline resistance in play. A daily close above it would be significant.
• 2000–2100 remains a psychological resistance zone.
• RSI & Stoch below neutral, indicating room to move up if pressure builds.
• Invalidation below $1,500 (daily close).
Fundamentals
• Massive accumulation: Over 2.11M ETH added to accumulation addresses in March alone.
• Supply squeeze: ETH on exchanges dropped to a 10-year low, down 16.4% from 7 weeks ago.
• Open interest rising: Futures market open interest climbed from 9.40M to 10.10M ETH in just three days—showing derivative trader confidence.
• Ethereum Pectra upgrade scheduled, promising long-term improvements in staking, fees, and transaction management.
• If bullish catalysts align, this accumulation phase could spark a breakout move back toward $2,800–3,000 in Q2.
Note: Please remember to adjust this trade idea according to your individual trading conditions, including position size, broker-specific price variations, and any relevant external factors. Every trader’s situation is unique, so it’s crucial to tailor your approach to your own risk tolerance and market environment.

LOW RISK ETH SHORTSimply hopped into an ETH Short at around 11;15 pm EST
about a 40 pip SL @ $2,580
Looking for a 1:4 or 1:5
TP 1 : 2,487
TP 2 : 2,420
TP 3 : 2,355
If you can handle volatility hold till possible $2,100 or below!
Always good to scale in and out protecting your capital EFFICIENTLY!
Let's Get it PPFX Fam! Peace

Name Your Coin and We’ll Do an Analysis!Got a coin you’re curious about? Drop its name in the comments (e.g., BTC, ETH, SOL), and we’ll dive in to give you a full analysis. Whether it’s a big hitter or an under-the-radar pick, we’ve got you covered. Tell us your coin, let’s get started!
How it works:
Tell us the coin’s name.
We’ll pick the most popular ones and break them down for you.

BRIEFING Week #12 : Alt-Season might be coming soonHere's your weekly update ! Brought to you each weekend with years of track-record history..
Don't forget to hit the like/follow button if you feel like this post deserves it ;)
That's the best way to support me and help pushing this content to other users.
Kindly,
Phil

ETH/USDT 1DAY CHART UPDATE !!ETH is still trading inside a descending channel, with the price close to key support.
Support Zone Holding: The $1,750–$1,830 area has provided a strong support base.
Ichimoku Cloud Resistance: The red Ichimoku Cloud above is acting as a crucial
resistance barrier.
Bullish Scenario:
If ETH breaks out of the descending channel, the first major resistance to watch is $2,400–$2,600 (cloud resistance).
A confirmed breakout could lead to a move towards $4,000+.
Bearish Continuation :
If ETH fails to break out, it could retest the $1,750–$1,830 support area.
A breakdown below $1,750 could open the door to lower levels around $1,600.
If you found this analysis helpful, hit the Like button and share your thoughts or questions in the comments below. Your feedback matters!
Thanks for your support!
DYOR. NFA

$LINA Set For 7000% Surge Amidst a Bullish Symmetrical TriangleLina a decentralized delta-one asset protocol capable of instantly creating synthetic assets with unlimited liquidity that opens traditional assets like commodities, forex, market indices and other thematic sectors to cryptocurrency users by supporting the creation of “Liquids” — Linear’s synthetic asset tokens, is set for a massive surge with a speculated 7,000% surge in the long run amidst a bullish symmetrical triangle that has been forming since for over 3 years now.
The token is currently oversold as seen by the RSI at 22, but this only makes the story interesting. Despite GETTEX:LINA down 45% today tanking hard amidst the markets volatility, GETTEX:LINA is offering early entry for traders to capitalise on this oversold territory and lack of momentum to kickstart a bullish renaissance.
With a market cap of $9.84M and listings on major exchanges like Binance, Bybit, Kucoin, MEXC, Houbi, etc. This is a good enough sign to capitalize on this opportunity presented by this altcoin.
Linear Finance Price Live Data
The live Linear Finance price today is $0.001174 USD with a 24-hour trading volume of $39,622,410 USD. Linear Finance is down 35.68% in the last 24 hours, with a live market cap of $9,043,949 USD. It has a circulating supply of 7,703,149,626 LINA coins and a max. supply of 10,000,000,000 LINA coins.

Could Pectra Upgrade leads Eth to 11K this cycle?
sentiment on ETH never has been that low while all the arguments against ETH will just be vanished with the upcoming Pectra upgrade
volume is as low as pre 2017 era so I think we can consider ourselves around June July 2017, when ETH made a ~70% retrace from 450 to 150 than peaked at 2K
Despite some delays I don't see why the upgrade will not happen...patience is key
_______
In a more technical view lets zoom to the daily timeframe
- its visible on the weekly chart: ETH bounced from weekly POC, saving it from collapse (?)
- around 0.5 fib now from low cycle to top cycle
- bounced back above that big blue trendline, its an important support that we dont want to loose
I would say the low has been done on the 11th of March, as for BTC
2 and a half possibilities here,
- bullish scenarios : I think there's too much stake on this asset, we bounce from here to see at least 2800 zone
either only up from now, either we go back to 1800 to make a double bottom, sort of H&S pattern kinda happening often at least this cycle
as long as we dont make a lower low this scenario is valid
in this scenario if the upgrade keep its promises and volume is back, I don't see why we wouldn retest new ATHs
- bearish scenario : we breakdown for a lower low aiming to 1600 area, the retest of the trendline above would fail and it would probably be the end of this bull market, that a lot of ppl have already called
______
fast check on whats happening if we zoom again:
Heres the 4H
4H closes in 1 hour but as you can see for now ETH pinged from that blue trendline i think we really dont want to loose
I bought a bit again today, lets see
cheeeers

ETHUSD Ethereum Update 21/03/2025We have seen the upward impulse and the correction. I'm waiting for internal liquidity to be reached and for the price to rise to 2200+ in the next 2 weeks.
Best regards, EXCAVO
_____________________
Disclosure: I am part of Trade Nation's Influencer program and receive a monthly fee for using their TradingView charts in my analysis.

Falling towards pullback support?Ethereum (ETH/USD) is falling towards the pivot which has been identified as a pullback support and could bounce to the 1st resistance which acts as a pullback resistance.
Pivot: 1,940.23
1st Support: 1,827.50
1st Resistance: 2,107.47
Risk Warning:
Trading Forex and CFDs carries a high level of risk to your capital and you should only trade with money you can afford to lose. Trading Forex and CFDs may not be suitable for all investors, so please ensure that you fully understand the risks involved and seek independent advice if necessary.
Disclaimer:
The above opinions given constitute general market commentary, and do not constitute the opinion or advice of IC Markets or any form of personal or investment advice.
Any opinions, news, research, analyses, prices, other information, or links to third-party sites contained on this website are provided on an "as-is" basis, are intended only to be informative, is not an advice nor a recommendation, nor research, or a record of our trading prices, or an offer of, or solicitation for a transaction in any financial instrument and thus should not be treated as such. The information provided does not involve any specific investment objectives, financial situation and needs of any specific person who may receive it. Please be aware, that past performance is not a reliable indicator of future performance and/or results. Past Performance or Forward-looking scenarios based upon the reasonable beliefs of the third-party provider are not a guarantee of future performance. Actual results may differ materially from those anticipated in forward-looking or past performance statements. IC Markets makes no representation or warranty and assumes no liability as to the accuracy or completeness of the information provided, nor any loss arising from any investment based on a recommendation, forecast or any information supplied by any third-party.

The is still in a downtrend... Put it on a watch list. ETH is still in its downtrend. I am ready to flip bullish on alts as soon as I see this trend reverse. I will wait for those confirmations patiently. Market structure pivots require discipline. In the meantime DCA slowly.
Full TA: Link in the BIO
ETH - On which side will it break-out?Today, the FED will decide on the interest rate in the USA. It is almost certain (99% probability) that the rate will remain unchanged. The most important aspect to focus on in this meeting’s minutes is the FED Balance Sheet. Will they stop tightening the balance sheet this month, or will they wait until mid-year as stated in January?
Leading up to the FOMC meeting, ETH is squeezing within its 4-hour pattern, forming equal highs and higher lows. This suggests a potential breakout to the upside.
I have outlined two possible scenarios:
1. ETH breaks through the resistance zone with strong volume, then successfully retests it as support.
2. ETH fails to break the resistance zone and instead breaks below the rising trendline.
Scenario 1:
Many stop-loss orders are accumulating just above the equal highs. If ETH manages to break out of the resistance zone with high volume and fill the gap, there is a chance it will flip this resistance into support. To confirm this, we need multiple candle closes above the resistance zone.
However, there is also a possibility that the FOMC meeting could trigger a price pump, only to drop immediately afterward, taking out stop-losses along the way.
Scenario 2:
In this case, ETH breaks below its rising trendline. For this to be a valid breakdown, it must be accompanied by high volume and a new lower low. If ETH breaks the trendline without forming a new lower low, it could be a fake-out. Therefore, we need confirmation: a lower low followed by a trendline retest.
Interesting Observations:
Stochastic RSI on the Daily Timeframe is rising rapidly into the overbought zone, while ETH remains in consolidation. Typically, we want the momentum of the Stochastic RSI to increase alongside price action. However, that is not happening here.
If the Stochastic RSI enters the overbought area and then crosses downward, it could put selling pressure on ETH, potentially leading to new lows in this downtrend.
Conclusion:
My base case is that ETH will sweep liquidity/stop-losses during the FOMC meeting with an initial upside move, followed by a sustainable correction downward in the coming days or weeks, accompanied by a decrease in the Stochastic RSI.
We’ll have to wait and see how the FOMC meeting unfolds.
Thanks for your support!
Drop a like and leave a comment to have a conversation about this topic. Make sure to follow me so you don’t miss out on the next analysis.

ETHUSD: Different asser, same pattern, same ending.Ethereum remains bearish on its 1D technical outlook (RSI = 40.440, MACD = -154.200, ADX = 29.206) but sits at the bottom of its 1 year Megaphone. This is the same pattern that Bitcoin traded on last year and Gold during its most recent Bear Cycle. In all instances, when the price found support on the MA50 and broke over the Megaphone, it reached the 2.0 Fibonacci. According to this, it won't be surprising if we see ETH at 9,000 by the end of the year.
## If you like our free content follow our profile to get more daily ideas. ##
## Comments and likes are greatly appreciated. ##

Bitcoin ($BTC) - Hoping for a Short-Term RolloverBitcoin bounced from the daily demand (76874.75-74306.67) that was highlighted in my "Bitcoin Uptrend Continuation" post from 5 days ago (see related post below). However, the rubber will now meet the road as BITSTAMP:BTCUSD could break higher or continue lower from current price. The in-play 1D sell zone, which is admittedly doesn't have great structure, is 86267.86-92920.42. Ideally, short-term CRYPTOCAP:BTC momentum, per the RSI, would be weaker than it is, but momentum is still soft per the daily oscillator. I'm not looking to short BTC blindly, but rather am stalking it via LTFs and will execute a confirmation short if evidence of the near-term uptrend (established 3/10) violation/termination materializes. If the intermediate-term downtrend continues, T2 = sub-$70K.
Anyway, just an idea. For those looking for longer-term buying opportunities, a near-term selloff should be viewed as a positive. Futures open in ~5 hours and can always be used to hedge longs if we get a breakdown.
Thanks for reading. Thoughts/feedback appreciated!
Jon
@JHartCharts

ETH - AltSeason confirmed?Hello TradingView Family / Fellow Traders. This is Richard, also known as theSignalyst.
🔹 As per my last ETH analysis (attached to the chart), we expected that if $2,000 was broken to the upside, altseason would begin! 🚀
Now, ETH has been trading within the rising channel (marked in orange).
📈 As long as the lower orange trendline holds, the bulls remain in control, creating room for altcoins to surge!
💭 Do you think Altseason is confirmed, or is this just a bull trap? 🤔
📚 Always follow your trading plan regarding entry, risk management, and trade management.
Good luck!
All Strategies Are Good; If Managed Properly!
~Rich

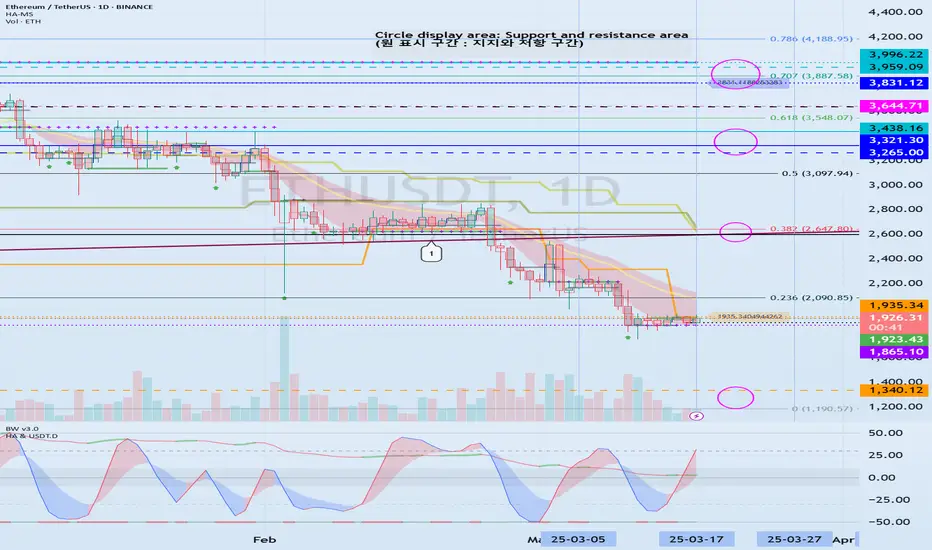
The key is whether there is support near 1935.34
Hello, traders.
If you "Follow", you can always get new information quickly.
Please also click "Boost".
Have a nice day today.
-------------------------------------
(ETHUSDT 1D chart)
The important support and resistance zones have changed as it has fallen below the long-term upward trend line (1).
After March 18, the key is whether ETH can maintain its price by receiving support near 1935.34 and rising above the M-Signal indicator on the 1D chart, that is, the Fibonacci ratio of 0.236 (2090.85).
If it falls after receiving resistance near 1935.34, it is possible that it will fall to around 1340.12, so you should also consider a response plan for this.
-
In order to turn into an uptrend, the price must rise above the M-Signal indicator on the 1M chart and maintain it.
To do so, the price must be maintained near the Fibonacci ratio of 0.382 (2647.80).
-
Therefore, if it rises after receiving support near 1935.34,
1st: M-Signal on the 1D chart (Fibonacci ratio of 0.236 (2090.85))
2nd: M-Signal on the 1M chart (Fibonacci ratio of 0.382 (2647.80))
You should respond depending on whether there is support near the 1st and 2nd above.
Currently, the StochRSI indicator is showing signs of entering the overbought zone, so even if there is an additional rise, it is expected to eventually show a downward trend.
In order to ignore this law, an explosive trading volume or favorable market news is required.
-
(30m chart)
Since the StochRSI indicator is in the oversold zone, it is highly likely to rise even if it continues to fall further.
However, since it is a 30m chart, you should respond based on day trading or short-term trading.
Since the HA-High (1936.67) indicator and the BW (100) (1944.96) indicator are located near 1935.34, we can see that it is forming a resistance zone.
Therefore, even if there is an additional rise, it seems likely to be resisted in this resistance zone (1936.67-1944.96).
If it falls below 1923.43,
1st: Heikin Ashi's Close on the 1D chart
2nd: HA-Low indicator (1885.30)
3rd: 1865.10
We need to check if it is supported near the 1st-3rd above.
-
Therefore, if it is supported and rises near 1935.34,
1st: M-Signal on 1D chart (Fibonacci ratio 0.236 (2090.85))
2nd: M-Signal on 1M chart (Fibonacci ratio 0.382 (2647.80))
You need to respond depending on whether there is support near the 1st and 2nd above.
Since the StochRSI indicator is currently showing signs of entering the overbought zone, it is expected that it will eventually show a downward trend even if there is an additional rise.
In order to ignore this law, an explosive trading volume or favorable market conditions must occur.
-
Thank you for reading to the end.
I hope you have a successful trade.
--------------------------------------------------
- Big picture
I used TradingView's INDEX chart to check the entire range of BTC.
(BTCUSD 12M chart)
Looking at the big picture, it seems to have been maintaining an upward trend following a pattern since 2015.
In other words, it is a pattern that maintains a 3-year upward trend and faces a 1-year downward trend.
Accordingly, the upward trend is expected to continue until 2025.
-
(LOG chart)
Looking at the LOG chart, you can see that the upward trend is decreasing.
Accordingly, the 46K-48K range is expected to be a very important support and resistance range from a long-term perspective.
Therefore, we expect that we will not see prices below 44K-48K in the future.
-
The Fibonacci ratio on the left is the Fibonacci ratio of the uptrend that started in 2015.
In other words, it is the Fibonacci ratio of the first wave of the uptrend.
The Fibonacci ratio on the right is the Fibonacci ratio of the uptrend that started in 2019.
Therefore, it is expected that this Fibonacci ratio will be used until 2026.
-
No matter what anyone says, the chart has already been created and is already moving.
How to view and respond to this is up to you.
When the ATH is updated, there are no support and resistance points, so the Fibonacci ratio can be used appropriately.
However, although the Fibonacci ratio is useful for chart analysis, it is ambiguous when used as support and resistance.
This is because the user must directly select the important selection points required to create Fibonacci.
Therefore, since it is expressed differently depending on how the user specifies the selection points, it can be useful for chart analysis, but it can be seen as ambiguous when used for trading strategies.
1st : 44234.54
2nd : 61383.23
3rd : 89126.41
101875.70-106275.10 (Overshooting)
4th : 134018.28
151166.97-157451.83 (Overshooting)
5th : 178910.15
-----------------
ETH is bullish (1D)Before anything else, you should know that Ethereum's structure in higher time frames is bearish. However, we currently expect an internal pullback to higher levels because the price has reached a significant zone.
The expectation is that the price will move from the mitigated demand zone toward the targets.
A daily candle closing below the invalidation level will invalidate this analysis.
Do not enter the position without capital management and stop setting
Comment if you have any questions
thank you

ETH Looks Bullish (1D)Before anything else, you should know that Ethereum's structure in higher time frames is bearish. However, we currently expect an internal pullback to higher levels because the price has reached a significant zone.
The expectation is that the price will move from the mitigated demand zone toward the targets.
A daily candle closing below the invalidation level will invalidate this analysis.
Do not enter the position without capital management and stop setting
Comment if you have any questions
thank you

ETHEREUM Megaphone bottom like March 2020Ethereum (ETHUSD) is currently on the first week of rebound after 3 straight red weeks when it was unable to break above the 1W MA50 (blue trend-line). This is taking place on a Lower Lows trend-line, technically the bottom of a 1-year Megaphone since the March 11 2024 High.
The market is no stranger to long-term Megaphone consolidation periods like that as last time we saw this was on the June 2019 - March 2020 Megaphone, which eventually broke upwards after the brutal COVID crash Bearish Leg that touched bottom. This is quite similar to the current Bearish since late December. Notice how perfectly aligned the Fibonacci retracement levels are.
Based on this, we expect at least a 1.5 Fibonacci extension test at $6000 before this Cycle tops at the end of the year.
-------------------------------------------------------------------------------
** Please LIKE 👍, FOLLOW ✅, SHARE 🙌 and COMMENT ✍ if you enjoy this idea! Also share your ideas and charts in the comments section below! This is best way to keep it relevant, support us, keep the content here free and allow the idea to reach as many people as possible. **
-------------------------------------------------------------------------------
💸💸💸💸💸💸
👇 👇 👇 👇 👇 👇

ETH Analysis (1D)Ethereum is approaching a support level.
The risk-to-reward ratio is not very attractive since we are in a bearish trend, but we expect a reaction to the green zone.
There are two targets ahead of the price, which we have marked on the chart.
A daily candle closing below the invalidation level will invalidate this analysis
For risk management, please don't forget stop loss and capital management
Comment if you have any questions
Thank You
