ETHUSD: Different asser, same pattern, same ending.Ethereum remains bearish on its 1D technical outlook (RSI = 40.440, MACD = -154.200, ADX = 29.206) but sits at the bottom of its 1 year Megaphone. This is the same pattern that Bitcoin traded on last year and Gold during its most recent Bear Cycle. In all instances, when the price found support on the MA50 and broke over the Megaphone, it reached the 2.0 Fibonacci. According to this, it won't be surprising if we see ETH at 9,000 by the end of the year.
## If you like our free content follow our profile to get more daily ideas. ##
## Comments and likes are greatly appreciated. ##
ETH-D

Bitcoin ($BTC) - Hoping for a Short-Term RolloverBitcoin bounced from the daily demand (76874.75-74306.67) that was highlighted in my "Bitcoin Uptrend Continuation" post from 5 days ago (see related post below). However, the rubber will now meet the road as BITSTAMP:BTCUSD could break higher or continue lower from current price. The in-play 1D sell zone, which is admittedly doesn't have great structure, is 86267.86-92920.42. Ideally, short-term CRYPTOCAP:BTC momentum, per the RSI, would be weaker than it is, but momentum is still soft per the daily oscillator. I'm not looking to short BTC blindly, but rather am stalking it via LTFs and will execute a confirmation short if evidence of the near-term uptrend (established 3/10) violation/termination materializes. If the intermediate-term downtrend continues, T2 = sub-$70K.
Anyway, just an idea. For those looking for longer-term buying opportunities, a near-term selloff should be viewed as a positive. Futures open in ~5 hours and can always be used to hedge longs if we get a breakdown.
Thanks for reading. Thoughts/feedback appreciated!
Jon
@JHartCharts

ETH - AltSeason confirmed?Hello TradingView Family / Fellow Traders. This is Richard, also known as theSignalyst.
🔹 As per my last ETH analysis (attached to the chart), we expected that if $2,000 was broken to the upside, altseason would begin! 🚀
Now, ETH has been trading within the rising channel (marked in orange).
📈 As long as the lower orange trendline holds, the bulls remain in control, creating room for altcoins to surge!
💭 Do you think Altseason is confirmed, or is this just a bull trap? 🤔
📚 Always follow your trading plan regarding entry, risk management, and trade management.
Good luck!
All Strategies Are Good; If Managed Properly!
~Rich

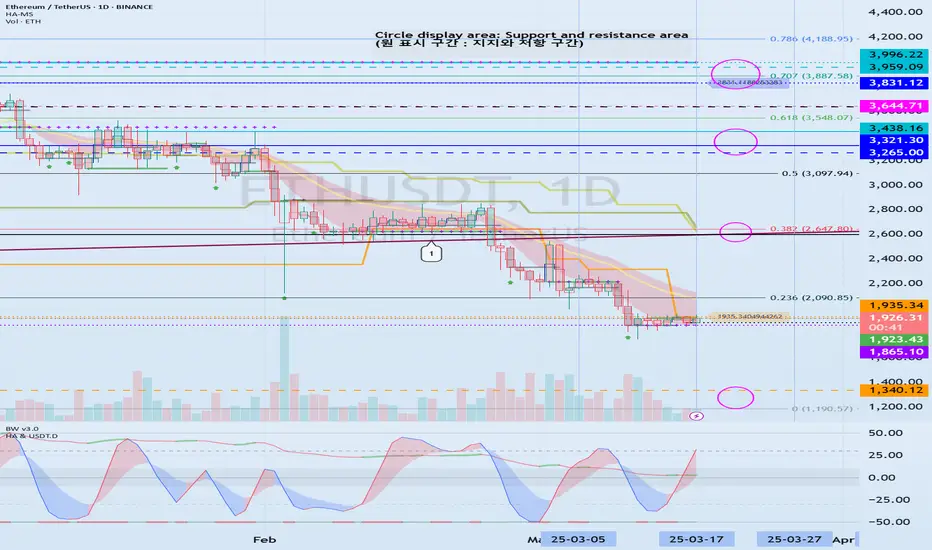
The key is whether there is support near 1935.34
Hello, traders.
If you "Follow", you can always get new information quickly.
Please also click "Boost".
Have a nice day today.
-------------------------------------
(ETHUSDT 1D chart)
The important support and resistance zones have changed as it has fallen below the long-term upward trend line (1).
After March 18, the key is whether ETH can maintain its price by receiving support near 1935.34 and rising above the M-Signal indicator on the 1D chart, that is, the Fibonacci ratio of 0.236 (2090.85).
If it falls after receiving resistance near 1935.34, it is possible that it will fall to around 1340.12, so you should also consider a response plan for this.
-
In order to turn into an uptrend, the price must rise above the M-Signal indicator on the 1M chart and maintain it.
To do so, the price must be maintained near the Fibonacci ratio of 0.382 (2647.80).
-
Therefore, if it rises after receiving support near 1935.34,
1st: M-Signal on the 1D chart (Fibonacci ratio of 0.236 (2090.85))
2nd: M-Signal on the 1M chart (Fibonacci ratio of 0.382 (2647.80))
You should respond depending on whether there is support near the 1st and 2nd above.
Currently, the StochRSI indicator is showing signs of entering the overbought zone, so even if there is an additional rise, it is expected to eventually show a downward trend.
In order to ignore this law, an explosive trading volume or favorable market news is required.
-
(30m chart)
Since the StochRSI indicator is in the oversold zone, it is highly likely to rise even if it continues to fall further.
However, since it is a 30m chart, you should respond based on day trading or short-term trading.
Since the HA-High (1936.67) indicator and the BW (100) (1944.96) indicator are located near 1935.34, we can see that it is forming a resistance zone.
Therefore, even if there is an additional rise, it seems likely to be resisted in this resistance zone (1936.67-1944.96).
If it falls below 1923.43,
1st: Heikin Ashi's Close on the 1D chart
2nd: HA-Low indicator (1885.30)
3rd: 1865.10
We need to check if it is supported near the 1st-3rd above.
-
Therefore, if it is supported and rises near 1935.34,
1st: M-Signal on 1D chart (Fibonacci ratio 0.236 (2090.85))
2nd: M-Signal on 1M chart (Fibonacci ratio 0.382 (2647.80))
You need to respond depending on whether there is support near the 1st and 2nd above.
Since the StochRSI indicator is currently showing signs of entering the overbought zone, it is expected that it will eventually show a downward trend even if there is an additional rise.
In order to ignore this law, an explosive trading volume or favorable market conditions must occur.
-
Thank you for reading to the end.
I hope you have a successful trade.
--------------------------------------------------
- Big picture
I used TradingView's INDEX chart to check the entire range of BTC.
(BTCUSD 12M chart)
Looking at the big picture, it seems to have been maintaining an upward trend following a pattern since 2015.
In other words, it is a pattern that maintains a 3-year upward trend and faces a 1-year downward trend.
Accordingly, the upward trend is expected to continue until 2025.
-
(LOG chart)
Looking at the LOG chart, you can see that the upward trend is decreasing.
Accordingly, the 46K-48K range is expected to be a very important support and resistance range from a long-term perspective.
Therefore, we expect that we will not see prices below 44K-48K in the future.
-
The Fibonacci ratio on the left is the Fibonacci ratio of the uptrend that started in 2015.
In other words, it is the Fibonacci ratio of the first wave of the uptrend.
The Fibonacci ratio on the right is the Fibonacci ratio of the uptrend that started in 2019.
Therefore, it is expected that this Fibonacci ratio will be used until 2026.
-
No matter what anyone says, the chart has already been created and is already moving.
How to view and respond to this is up to you.
When the ATH is updated, there are no support and resistance points, so the Fibonacci ratio can be used appropriately.
However, although the Fibonacci ratio is useful for chart analysis, it is ambiguous when used as support and resistance.
This is because the user must directly select the important selection points required to create Fibonacci.
Therefore, since it is expressed differently depending on how the user specifies the selection points, it can be useful for chart analysis, but it can be seen as ambiguous when used for trading strategies.
1st : 44234.54
2nd : 61383.23
3rd : 89126.41
101875.70-106275.10 (Overshooting)
4th : 134018.28
151166.97-157451.83 (Overshooting)
5th : 178910.15
-----------------
ETH is bullish (1D)Before anything else, you should know that Ethereum's structure in higher time frames is bearish. However, we currently expect an internal pullback to higher levels because the price has reached a significant zone.
The expectation is that the price will move from the mitigated demand zone toward the targets.
A daily candle closing below the invalidation level will invalidate this analysis.
Do not enter the position without capital management and stop setting
Comment if you have any questions
thank you

ETH Looks Bullish (1D)Before anything else, you should know that Ethereum's structure in higher time frames is bearish. However, we currently expect an internal pullback to higher levels because the price has reached a significant zone.
The expectation is that the price will move from the mitigated demand zone toward the targets.
A daily candle closing below the invalidation level will invalidate this analysis.
Do not enter the position without capital management and stop setting
Comment if you have any questions
thank you

ETHEREUM Megaphone bottom like March 2020Ethereum (ETHUSD) is currently on the first week of rebound after 3 straight red weeks when it was unable to break above the 1W MA50 (blue trend-line). This is taking place on a Lower Lows trend-line, technically the bottom of a 1-year Megaphone since the March 11 2024 High.
The market is no stranger to long-term Megaphone consolidation periods like that as last time we saw this was on the June 2019 - March 2020 Megaphone, which eventually broke upwards after the brutal COVID crash Bearish Leg that touched bottom. This is quite similar to the current Bearish since late December. Notice how perfectly aligned the Fibonacci retracement levels are.
Based on this, we expect at least a 1.5 Fibonacci extension test at $6000 before this Cycle tops at the end of the year.
-------------------------------------------------------------------------------
** Please LIKE 👍, FOLLOW ✅, SHARE 🙌 and COMMENT ✍ if you enjoy this idea! Also share your ideas and charts in the comments section below! This is best way to keep it relevant, support us, keep the content here free and allow the idea to reach as many people as possible. **
-------------------------------------------------------------------------------
💸💸💸💸💸💸
👇 👇 👇 👇 👇 👇

ETH Analysis (1D)Ethereum is approaching a support level.
The risk-to-reward ratio is not very attractive since we are in a bearish trend, but we expect a reaction to the green zone.
There are two targets ahead of the price, which we have marked on the chart.
A daily candle closing below the invalidation level will invalidate this analysis
For risk management, please don't forget stop loss and capital management
Comment if you have any questions
Thank You

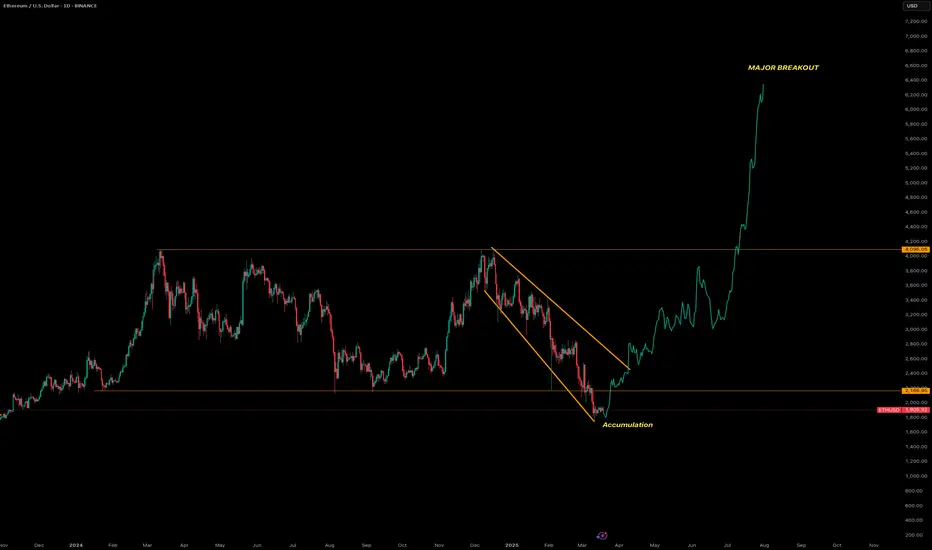
Ethereum will make a major Breakoutanalysis the chart
Let’s analyze the provided Ethereum (ETH/USD) chart on a daily timeframe from TradingView, focusing on the key technical elements and trends:
1. Overall Trend
The chart displays a significant bullish trend for Ethereum, with the price rising from around $2,200 in early 2024 to approximately $4,000 as of the latest data point (March 18, 2025).
The upward movement is marked by a sharp breakout, indicating a strong shift in momentum from consolidation to a rapid ascent.
2. Price Levels and Targets
Current Price: Approximately $4,000, with a previous support/resistance zone around $2,200.
The chart highlights a major breakout above the descending triangle pattern, suggesting potential for further upside, though no specific price target is explicitly labeled beyond the current level.
3. Technical Patterns
Descending Triangle: The chart features a descending triangle pattern, typically considered a bearish continuation pattern. However, the recent price action has broken out upward through the upper resistance line (around $2,200-$2,500), invalidating the bearish outlook and turning it into a bullish reversal signal.
Accumulation Phase: A clear accumulation zone is marked near the lower boundary of the triangle (around $2,200), where the price consolidated before the breakout. This suggests strong buying interest built up at this level, supporting the subsequent rally.
4. Support and Resistance
Support: The $2,200 level, which acted as the lower boundary of the triangle, now serves as a potential support zone if the price pulls back. This level could be retested as new support following the breakout.
Resistance: The next resistance is not explicitly marked, but the rapid upward move suggests the price may face selling pressure around previous highs (e.g., $4,500-$5,000) or psychological levels like $5,000, based on Ethereum’s historical behavior.
5. Volume and Momentum
Volume data isn’t shown, but the steep upward slope post-breakout indicates significant buying pressure and momentum. A breakout with high volume would further confirm the strength of this move.
6. Timeframe and Projection
The chart spans from late 2023 to mid-2025, with the major breakout occurring around early 2025. The sharp rise suggests this bullish momentum could continue in the short to medium term, potentially pushing Ethereum toward new all-time highs (above $4,800, its previous peak).
7. Key Observations
The upward breakout from the descending triangle is a powerful bullish signal, often indicating a reversal of prior bearish pressure and the start of a new uptrend.
The accumulation phase near $2,200 reflects a period where buyers absorbed selling pressure, setting the stage for the breakout.
Potential risks include a pullback to retest the broken resistance (now support) at $2,200-$2,500, or overextension if the rally lacks consolidation. Monitoring for overbought conditions (e.g., via RSI or other indicators) could be prudent.
Ethereum Breaks Key Resistance: Bullish Setup for ETH 🚨 **Ethereum Breaks Key Resistance – Bullish Signal!** 🚨
After weeks of consolidation, Ethereum ( CRYPTOCAP:ETH ) has finally broken through a crucial resistance level, triggering a massive short squeeze that liquidated **$46 million** worth of short positions! 💥 This is a strong sign that market sentiment could be shifting to the upside.
Here’s the breakdown:
🔑 **Resistance Breakout**: Ethereum has successfully closed a **4-hour candle above** the key resistance level, signaling a potential trend reversal and continuation to the upside. The market is now eyeing the next major target at **$2100**.
📈 **Trade Setup**:
- **Entry Point**: We are looking for a **retest of the $1960 level** as support (previous resistance), which is a strong entry zone for a long position.
- **Stop Loss**: Set your stop loss just below the previous support level at **$1920** to manage risk effectively.
- **Target**: The next major resistance is around **$2100**, where we expect some price action to unfold. A break above this could signal further upside potential.
This breakout presents a clear opportunity for traders looking to capitalize on potential bullish momentum in Ethereum. Keep your eyes on the charts and manage risk appropriately! 🔍
**Remember**: As always, trade responsibly and stay updated on market conditions.

JUST IN: Ethereum ($ETH) reclaims $2,000The price of the first altcoin (I.e alternative coins) Ethereum ( CRYPTOCAP:ETH ) surged 5% to $2030 price levels reclaiminng the $2k price point. Albeit the general crypto landscape is facing consolidation CRYPTOCAP:ETH seems to break the nuance. This move by Ethereum is tandem with the incoming Ethereum upgrades called "Pectra Upgrade""
The Pectra upgrade is bringing faster transactions, lower fees, & better staking to ETH! With account abstraction (EIP-7702) & higher staking limits (EIP-7251), Ethereum is stepping up its game against Solana!
Technical Outlook
As of the time of writing, CRYPTOCAP:ETH is up 5.12% with a bullish Relative strength index (RSI) of 69 hinting at a continuous rising trend. The 38.2% Fibonacci retracement level is serving as pivot point a move to the $2300 zone would catalyse a bullish spree for Ethereum.
Ethereum Price Live Data
The live Ethereum price today is $2,027.90 USD with a 24-hour trading volume of $13,340,876,260 USD. Ethereum is up 7.20% in the last 24 hours. The current CoinMarketCap ranking is #2, with a live market cap of $244,618,878,972 USD. It has a circulating supply of 120,626,703 ETH coins and the max. supply is not available as per data from CMC.

MELANIA Hi,
It failed its first initial breakout, retested the trend and we are currently witnessing a move higher.
I have moved my SL to entry to make it a risk free trade while the FOMC is going ahead later today.

ETH/USDT: Testing Key Support with Potential for ReboundThe ETH/USDT pair continues to decline, approaching a key support level last tested in October 2023. Historically, similar price movements were observed in 2021, when the price dropped from the 4,300 level before rebounding from the 1,700 support zone, ultimately leading to new all-time highs.
Currently, the price has broken above a downward trendline that had served as a resistance throughout the month. Looking ahead, the market may remain in a sideways phase over the coming weeks, with a potential upward push if buying pressure emerges from the support level. The next key target is the resistance zone around 2,190

Dejitaru Tsuka ($TSUKA) Needs to Break This Level For a ComebackDejitaru Tsuka ($TSUKA) a memecoin based on the Japanese legend of a special kind of dragon called Dejitaru Tsuka Dragon that is believed to bring good fortune to the one who holds it is set to break the 38.2% Fibonacci retracement level to make a comeback.
It is an ERC-20 token on the Ethereum blockchain that was launched in 2022 as a taxless token. The project aims to be accessible to everyone so that the memecoin’s popularity rises.
Having Rise in the month of November, 2024, $TSUKA saw a nosedive and has since consolidate in price for the past 4 months and a break above the 38.2% Fibonacci retracement point will catalyse a bullish reversal move with an envision 200% surge in the long term.
Dejitaru Tsuka Price Live Data
The live Dejitaru Tsuka price today is $0.002885 USD with a 24-hour trading volume of $58,996.00 USD. Dejitaru Tsuka is up 2.42% in the last 24 hours, with a live market cap of $2,885,109 USD. It has a circulating supply of 1,000,000,000 TSUKA coins and the max. supply is not available.

ETH/USDT Weekly Chart Analysis. The Ethereum (ETH/USDT) weekly chart suggests a potential bullish reversal from a key support area. Here are the details of the analysis:
Support area: Around $1,750 – $1,830, where the price recently rebounded.
Resistance levels:
First target: $4,015
Key resistance: $4,663, which marks a key breakout level.
ETH has bounced off historical support levels, indicating potential accumulation.
If the price sustains above $1,800, the next target is $4,015, followed by $4,663 if the momentum continues.
A break below $1,747 – $1,700 could lead to further declines, with the next strong support near $1,053.
Look for a confirmation of a breakout above $2,000 to confirm a strong uptrend.
Keep an eye on volume and indicators (RSI, MACD) for further confirmation of momentum.
Risk management is important in volatile market conditions.
If you found this analysis helpful, hit the Like button and share your thoughts or questions in the comments below. Your feedback matters!
Thanks for your support!
DYOR. NFA

The current ETH chart, incorporating my 'flash-crash' thesisThis chart illustrates the current ETH pattern, with my 'April flash crash thesis.'
I believe we will see another thrust lower into the marked lower ranges before a spring into the fifth wave. However, the fifth wave will be a "false breakout," as a flash crash in mid to late April is likely to occur, intentionally designed to sweep liquidity by liquidating overleveraged positions and triggering stop losses—only for the market to recover shortly thereafter and continue its breakout to the upside. This breakout will likely push beyond the pattern and take out the "Trump Election Pump" highs.
There could be some opportunities in the next 4 to 6 weeks, but with opportunity comes risk. Always use a proper risk management strategy suited to your skill level and wallet size.
Good luck, and always use a stop loss!

Ethereum's Current Consolidation: Will It Move Up or Down...?BINANCE:ETHUSDT Ethereum Consolidating Between $1820 and $1950: Will It Break Upside or Downside..?
Ethereum has been trading in a consolidation range between the $1820 and $1950 levels since last week. As the price oscillates within this range, market participants eagerly await a breakout in either direction. The big question is: will Ethereum break upwards or downwards? Let's analyze two potential scenarios based on key price levels and liquidation points.
Scenario 1: Upside Breakout and Potential Rally
One key level to watch is the $1950 resistance. Ethereum has struggled to break past this level, but if the price manages to break above and sustain above $1950, there is a significant upside potential.
Why? At the $1994 level, there is approximately $1.16 billion in liquidations waiting to happen. If Ethereum pushes past the $1950 resistance and approaches this $1994 mark, the surge of liquidations could provide the momentum for a continued rally.
In this scenario, a good strategy would be to wait for a retest of the $1950 level as support, confirming the breakout. If the price holds above this level, it may be a good time to enter a long position, riding the potential bullish move.
Scenario 2: Downside Breakout and Further Decline
On the other hand, if Ethereum fails to hold above the $1820 support and breaks below this level, a downside move could be on the horizon. The next significant support lies around the $1785 level, where around $900 million in liquidations are waiting.
A break below $1820 could trigger a sharp decline toward this liquidation point at $1785. In this case, entering a short position after a retest of the $1820 resistance-turned-support could offer a solid opportunity for traders looking to capitalize on the downtrend.
Conclusion
Ethereum’s consolidation between the $1820 and $1950 levels presents two distinct scenarios. If the price breaks above $1950 and sustains that level, there is upside potential, with liquidation at $1994 offering a bullish catalyst. However, a break below $1820 could open the door for further downside, with liquidations at $1785 triggering a possible downtrend.
Traders should keep a close eye on these levels for confirmation and act accordingly based on the direction Ethereum takes in the coming days.

Ethereum run is inevitable!While fear in CRYPTOCAP:ETH is at the same level as the FTX LUNA COVID19 crashes, momentum has given a local bottom signal during these times when fear is at its peak, and we are at the same level now!

BRIEFING Week #11 : Are we done ? (nope)Here's your weekly update ! Brought to you each weekend with years of track-record history..
Don't forget to hit the like/follow button if you feel like this post deserves it ;)
That's the best way to support me and help pushing this content to other users.
Kindly,
Phil

LUNC Luna Classic Is About To DieA lot of these tokens in the next couple years are going to bleed out to zero. With the new Bitcoin ETFs and big money in the space they arent buying Luna, or BNB, or name your coin. They are buying what regulators have allowed them to buy. So far thats only Bitcoin,Ethereum, Litecoin, and Bitcoin Cash. This next bullrun will be utility, and regulatory based for the big players.
People holding these tokens like LUNC are going to eventually dump. Luna will never go to even a penny never mind a dollar. Its looking extremely bearish to me. Maybe one more dead cat bounce before Luna falls into the shadow realms. LUNA wont be the only one suffering this fate either. This next bullrun and after is going to delete most of the crap out there. You'll always have the casino where people play hot potato with the meme coins that come out every minute of the day. Real money is not going into this stuff though. Good luck and I wish you all the best, hate to see LUNA get rugged a second time, that would be some serious salt in the wounds. Not financial advice.
Descending triangle and Stoch RSI pointed straight down.

Ethereum THE GREATEST SHORT SQUEEZE in CRYPTO!ETH paired with BTC x GME stock
What happened to GameStop stock? This is very interesting because it helps to understand the “mechanics” behind the formation of such a specific arc (logarithmic chart).
1. Professionals were actively taking short positions.
2. Uncovered shorts forced sellers to buy back shares (to close positions) as the price increased, which further accelerated buying.
3. Volatility and price growth fueled enthusiasm, increasing demand and triggering a pump.
The GameStop situation was long considered a “retail victory,” but as it turned out, it wasn’t entirely so—it was a coordinated move by some major players against others who were heavily shorting the stock, being absolutely convinced of the company’s failure.
How much hate is there around ETH? How many bloggers are writing, “ETH is useless now”? Exactly. Meanwhile, ETH has 6-8 times the TVL of SOL!

AltSeason Begins If/When...Hello TradingView Family / Fellow Traders. This is Richard, also known as theSignalyst.
🔹 Let’s keep it simple and straightforward:
📈 Altseason begins if/when ETH breaks above its falling channel (in red) 📉 and the $2,000 round number.
⚠️ Meanwhile, further downside is expected.
📚 Always follow your trading plan regarding entry, risk management, and trade management.
Good luck!
All Strategies Are Good; If Managed Properly!
~Rich

ETH: The Final Dip Before LiftoffEthereum is gearing up for its final shakeout into the $1,602-$1,692 key zone. This could be the last chance to catch entries before a massive move up. Expecting a rapid breakout and, ultimately, a gap fill at $2,800.🚀
Entry: 1602-1692
TP: 2800
SL: 1495
