$NEAR - Approaching key liquidity levels. #NEAR has created a BOS, followed by a drop into our POI, which has provided a nice 21% bounce. It’s a level where one can spot-buy NEAR. Personally, I’d only look for longs from the 3M HOB refined into MTF or the demand level just below it.
Other info., such as TPs and entries, is provided in the chart.
I’ve noticed that people usually miss Supply and Demand levels, and if there’s one thing I’ve learned in this recent correction, it’s that these levels, if reached, are highly respected - especially if there’s an OB/HOB at the same level. The best example of this is #ETH, which found support at the 3M Demand level, proving the significance of S&D versus just looking at individual liquidity levels.
ETH-D

Breaking: $PIKACH Set for a Comeback Built on the Ethereum blockchain, while simply paying homage to an adorable creature we all love and parody- the Pokémon or its creation Pikachu, $PIKACH is set to soar amidst a bounced from the 38.2% Fibonacci retracement that is presently acting as a support point.
A breakout above the 1-month high could catalyse a bullish move with 30% gains in sight.
With the Relative Strength Index (RSI) at 56 this metric validates the bullish thesis on $PIKACH.
Pikaboss Price Live Data
The live Pikaboss price today is $5.40e-8 USD with a 24-hour trading volume of $24,671.20 USD. Pikaboss is down 2.77% in the last 24 hours, with a live market cap of $22,726,087 USD. It has a circulating supply of 420,690,000,000,000 PIKA coins and a max. supply of 420,690,000,000,000 PIKA coins.

Skeptic | Ethereum (ETH/USD) Analysis: Breakout or Breakdown?Welcome back, guys! 👋I’m Skeptic , and today we’re diving into one of the most popular coins out there— Ethereum (ETH) . Let’s find some solid triggers and setups while picking up a few educational tips along the way. 💡
🔮 4-Hour Time Frame Analysis
As you can see on the chart, after the sell-off candle , ETH entered a 4-hour range box . We witnessed volume decrease during the range formation and a sharp volume spike during the box breakout, confirming momentum increase. Following the breakdown below the box support at $2,521.23, we entered a downward channel, with the price respecting the channel's upper, lower, and mid lines.
📈 Long Setup
To enter a long position, I’d wait for a break above the resistance at $2,144 , which would also indicate a breakout from the downward channel. Keep in mind that this setup is against the current trend, so it’s crucial to use a tight stop loss and secure profits early as reversals are likely.
📉 Short Setup
For a short position, I’d consider entering after a breakdown below the support at $1,751.00 . Additionally, if the RSI re-enters the overbought zone during the breakout, it will add more confirmation. This setup would align better with the prevailing trend, giving us a higher confidence level. To set your profit targets, you can clone the existing channel and place it above or below the current one, as price is likely to react to these levels.
Let me know your thoughts on ETH/USD! 💬 Got any questions? Drop them in the comments, and I’ll be happy to discuss. Let’s grow together, not alone! 🔥

Crypto Total Market Cap Excluding Top 10 (CRYPTOCAP:OTHERS)The Total Market Cap of altcoins (excluding top 10) is showing a promising setup at 171.08B. Here’s the breakdown:
Price has bounced off a long-term ascending trendline (red) that’s been in play since 2017 – a historically strong support.
We’re currently testing a key resistance around 171B (blue line), with a recent volume spike supporting the move.
A break above 171B could open the door for a push toward the next major resistance at 217.88B in the coming months.
On the downside, if this level rejects, watch for a retest of the trendline around 148B.
💡 Trading Idea: Look for a weekly close above 171B to confirm bullish momentum. Volume will be key – sustained buying pressure could signal a breakout.

Ethereum - Bottom Test Ethereum is attempting to find a bottom before attempting its next leg of the bull run
This touch is shown along the yellow dotted line which I have shown in the green circles
Bulls will have there day when this line is tested
This also aligns with the 0.618 fib
Weekly timeframe

ETHEREUM copying Bitcoin's 2018-2021 Cycle and targets $8000!Ethereum / ETHUSD is under heavy pressure since the early December (2024) High and this week almost touched the 12 month Falling Support.
Even though that's devastating news for short term traders, long term holders may remain bullish just by looking at Bitcoin's 2018-2021 Cycle, which ETH has been repeating very closely.
A rebound on the Falling Support caused a massive breakout above the Falling Resistance and BTC rallied to the 1.618 Fibonacci extension.
In our opinion we can target at least $8000 on this Cycle.
Follow us, like the idea and leave a comment below!!

Scenario for ETHWorst case scenario for eth. Have the bulls lost...? This is not trading advice. DYOR

The Fate of ETHER#ethereum price has weakened against both #usd and #btc .In this #ethbtc chart, an Inverted Eve & Adam pattern has been formed in higher time frame. This took a long time and this is.. bearish. CRYPTOCAP:ETH structure shows no strenght, i' ve warned in my ideas and posts many times when price was higher than 3500 usd. Still #ethusd has many risks, #eth needs very strong news. Otherwise, furthermore dumps are inevitable...
Not financial advice.

$SOL Dumps 60% - Is it Over !?CRYPTOCAP:SOL DUMPED OVER 60% ‼️
That’s after a 3,500% pump
from the bear market low in ’22.
Is it over!?
TL;DR - NO.
This is common after such an insane pump.
SOL Dec ’20 - May ’21
5,700% pump
71% correction
then another 1,290% pump
Let’s look at previous cycles with $ETH.
Dec ’16 - June ’17
6,380% pump
67% correction
then another 916% pump
Dec ’18 (bear market low) - May ’21
4,860% pump
62% correction
then another 185% pump
So you see my fine feathered friends,
there’s nothing new here.
Targets still remain $700-850 🤠


This could be a bitter end for Ethereum or an opportunity !!!This could be a bitter end for Ethereum or an opportunity. If the triangle is broken from below, the price will drop to $1300.
Give me some energy !!
✨We spend hours finding potential opportunities and writing useful ideas, we would be happy if you support us.
Best regards CobraVanguard.💚
_ _ _ _ __ _ _ _ _ _ _ _ _ _ _ _ _ _ _ _ _ _ _ _ _ _ _ _ _ _ _ _
✅Thank you, and for more ideas, hit ❤️Like❤️ and 🌟Follow🌟!
⚠️Things can change...
The markets are always changing and even with all these signals, the market changes tend to be strong and fast!!

Bitcoin CME Gap at $77,930 Filled! Now, can $BTC push to $150K?Bitcoin CME Gap at $77,930 Filled! Now, can CRYPTOCAP:BTC push to $150K? 🚀
🔹 Support Level: $75,000 – If it holds, #BTC may target $100K+
🔻 If support breaks, my spot bids: $72K | $69K | $66K (Already filled at $77K ✅)
This drop was a liquidity flush to shake out high leverage traders. Stay prepared!
📢 Where’s your next buy order? Share below! 👇
#Bitcoin

AMERICA'S BITCOIN MINER: CLEANSPARKThe chart for Ethereum Futures is showing a promising inverse head and shoulders pattern. This indicates a potential turnaround for the struggling bitcoin mining industry. It appears that miners are behaving more like altcoin investors rather than taking a leveraged stance on Bitcoin. This shift suggests that their fortunes are more closely tied to the performance of Ethereum rather than Bitcoin itself.
Here’s what you should be aware of: CleanSpark (#CLSK), is set to be added to the S&P SmallCap 600 index on March 24.
This index features smaller publicly traded companies in the U.S. that have a market cap exceeding $1 billion and fulfil certain financial requirements.
Being included in this index may enhance CleanSpark’s visibility, boost its trading volume and liquidity, and draw in more institutional investors.
CleanSpark is the second crypto miner to be added to the index after peer Marathon Digital was added to the list last year.
Companies in the index typically benefit from increased trading volume and improved liquidity, making their shares more accessible to a broader pool of investors.
"CleanSpark's inclusion enhances visibility within the investment community," CEO Zach Bradford said in the announcement. “Our inclusion enhances visibility within the investment community and gives us an opportunity to demonstrate the value of being a pure play, vertically integrated Bitcoin mining company and making exposure to our model more broadly available."
CleanSpark operates bitcoin mining facilities across the U.S., focusing on energy efficiency and cost-effective power sources. The company has expanded its operations over the past year with the acquisition of peer GRIID Infrastructure.

Crypto Total Market Cap (CRYPTOCAP:TOTAL) As of March 12, 2025, the Total Crypto Market Cap sits at 2.63T USD.
Let’s dive into the monthly chart for a technical breakdown:
Since 2016, price has been moving within a long-term ascending channel. Right now, we’re testing the lower trendline support zone (2.4T - 2.5T).
This level has historically acted as a strong base – both the 2017 and 2021 bull runs kicked off from similar support zones.
Volume profile shows a 15-20% increase over the past 3 months, indicating growing buyer interest and improving market liquidity.
RSI is at 40 (neutral zone), not yet in oversold territory but signaling a potential base for a recovery.
Bullish Scenario: If the 2.5T support holds, we could see a move toward the channel’s midline (3T - 3.5T range), potentially retesting the 2021 highs above 3T.
Bearish Risk: A break below 2.5T could lead to a deeper pullback toward 2T, so keep this level on your radar.
💡 My Take: I believe we’re either at the bottom or just a few weeks away from the start of a new uptrend. April could mark the beginning of a bull run, signaling the end of the bloodbath – at least based on the technicals of the Total Market Cap.
What’s your view? Will the 2.5T support hold, or are we in for another correction?

OTHERS DOMINANCE ANALYSEThe Crypto Total Market Cap (excluding top 10) dominance is showing interesting action around the key 8.30% level. Historically, this level has acted as strong support/resistance (see 2017, 2020, 2022).
After breaking below 8.30% in late 2023, we’re now seeing a retest from the downside.
The price has bounced off this level with a decent volume spike, suggesting potential for an upward move.
If this support holds, we could see a push toward the next resistance around 11%-12% in the coming months.
Keep an eye on volume – sustained buying pressure will confirm the breakout.
💡 Trading Idea: Watch for a weekly close above 8.30% for confirmation of bullish momentum. On the flip side, a rejection here could lead to a retest of lower supports around 7%.
What do you think?

(jasmy) JASMY bar array pattern fading in and out of a low motion pattern indicator. Use examples from the past to understand the meaning. included lines from previous posts unchanged in purple representing key moments of the jasmy chart for reference. The price broke the previous lows.

ETH/USD 1D Chart ReviewHey everyone, let's look at the 1D ETH to USD chart, in this situation we can see how the price has reverted back to the long-standing uptrend, and here we can see a significant decline below the uptrend line.
In the event that the trend reverses and growth begins again, it is worth setting targets for the near future that the price must face:
T1 = 2246 USD
T2 = 2533 USD
Т3 = 2785 USD
Т4 = 3010 USD
Т5 = 3365 USD
However, here we can see how the current decline has been maintained by the support zone from $ 1904 to $ 1686, however, if the zone is broken further, we can see a decline to the level of $ 1338, and then again we can have the price go down to the area of $ 921
The RSI indicator shows a continuing downward trend, and here we can see a decline to the lower part of the range, but there is still room for the price to go lower to the lower limit.

ETH ? Free money at this point... good luckEthereum... absolutely oversold ! undervalued !
What to do ? BUY THE DIP. Don't think too much.
Just buy the DIIIIIIIIIIPPPPPP !!!

Ethereum: I expect it to reach $1,800-$2,243.Current situation with Ethereum: I expect it to reach $1,800-$2,243 based on Coinbase data.
Not going into too much detail, but in short: the stock market will drop, and Bitcoin and Ethereum will follow.
➖ Please avoid using leverage—the market is highly volatile right now.

ETH/USDTOn the 3-month chart, we can see clear boundaries of consolidation. At the moment, it looks very much like a deviation from the lower range. We have also reached the monthly OB, which could serve as a reversal point.

Breaking: Ethereum Dips 9% Today losing the $2k Price LevelEthereum today saw a noteworthy downtick with the asset dipping below the $2000 pivot zone. currently trading around the $1900 - $1700 price zones.
Ethereum is currently oversold as depicted by the Relative Strength Index (RSI) at 36. The 1-month low is acting as support point for Ethereum. Should selling pressure continue, CRYPTOCAP:ETH might tanked to $1000- 1400 price levels.
However, in the case of a price reversal, a break above the 65% Fibonacci retracement level could placed CRYPTOCAP:ETH on the cusp of a bullish spree.
Despite the bloodbath facing Ethereum albeit the general crypto landscape facing same, data from DefiLlama hints at a growing Defi landscape in the Ethereum blockchain with about $45.43 billion locked in Total Value Lock (TVL) and the volume growing in tandem with the TVL locked.
Presently up 2% trading at $1905 price point all eyes are set on the major pivots we mentioned above.

Ethereum at Critical Levels – Breakout or Breakdown for ETH?Ethereum (ETH) is looking heavily overextended right now 📊, with price action pressing into key support zones on the daily and weekly charts ⏳. The market is at a critical juncture, and a sharp pullback 📉 could be on the cards.
This could present a short-term counter-trend buying opportunity on the lower timeframes 💰, but if ETH pushes higher, it may offer a prime short setup 🎯.
⚠️ Not financial advice – trade smart and manage risk accordingly! 🚀

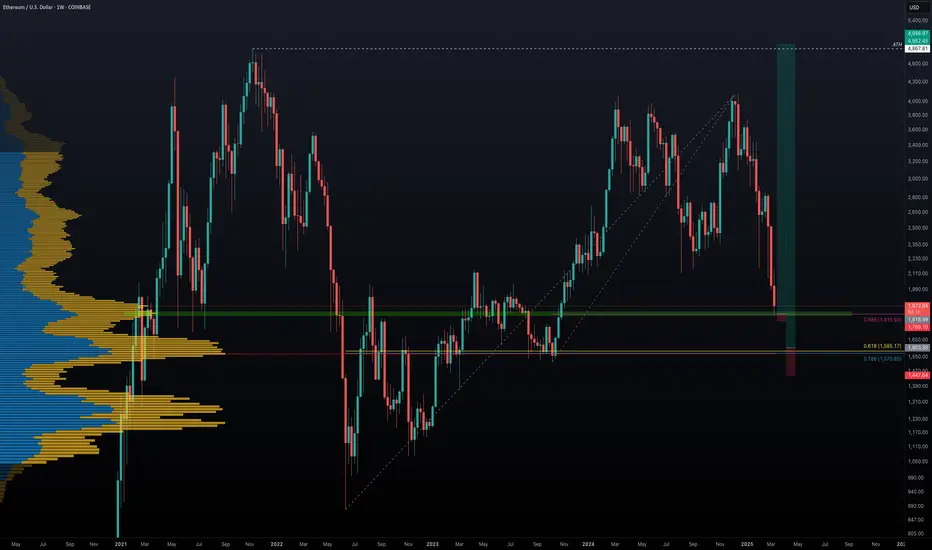
Ethereum's Potential Bottom: Could $5000 Be Next?Ethereum has experienced a significant 56% drop over the last 84 days. Has ETH found its bottom, or is more downside ahead? Let's break it down.
🔹 Fibonacci Retracement from October Low (2023) to December High (2024)
Starting with the Fibonacci retracement from the low of $1520.85 on 12th October 2023 to the high of $4109 on 16th December 2024, ETH recently hit the 0.886 Fib retracement at $1815.9 and saw a bounce. This area aligns with the Point of Control (POC) from previous price action, a potential signal that this could be a major support zone.
However, the real question is whether this is the final bottom, or if ETH will retest lower levels.
🔹 Further Fibonacci Retracement Analysis
Next, we take a larger Fibonacci retracement, from the low of $879.8 on 18th June 2022 to the high of $4109. The 0.786 Fib retracement at $1570.85 appears to be a critical support zone, as it also coincides with the POC in the volume profile of the entire market structure. This indicates that the $1570-$1600 region is a significant area of interest for buyers to step in.
🔹 Log Scale Fibonacci Confluence
To further strengthen this analysis, applying the same Fibonacci retracement on a log scale shows the 0.618 Fib retracement at $1585.17, very close to the POC and 0.786 Fib level, reinforcing this region as a major support zone.
🔹 High-Probability Long Setup
If ETH revisits the $1570-$1600 zone, this forms an ideal high-probability long setup with excellent risk/reward potential. A potential R:R ratio of more than 20:1 could materialise if this setup plays out and price targets $5000 as a take-profit level. The stop loss placement will determine the exact risk-to-reward, but the reward could be massive if this level holds.
💬 What are your thoughts? Will Ethereum find its bottom around these key levels? Excited to see how this develops! 🚀