Short Term Could Drop Be Careful Here - Possible $100Some bad news came out. Bybit got hacked for a lot of Ethereum. How this happens I dont understand but more than likely an inside job. These run out a basement exchanges are dangerous never leave your crypto on an exchange, NONE OF THEM.
Anyways I dont like the break of this rising wedge or potential bear flag. If this deosnt break back into the wedge and close in it then we could se another drop to about 100 or so if the measured move plays out. Be cautious here.
Not Financial advice.
ETH-D

AND THESE LITTLE PIGGIES CRIED WAAH WAAH ALL THE WAY HOMEIf you haven't realized yet or maybe you all cant read properly but your hopes of getting into the crypto reserve are long gone. Not only that but they intend to sell the forfeited and seized digital assets other than Bitcoin to buy more Bitcoin. REJECTED!

eth rising trend CRYPTOCAP:ETH Major Reversal Is Closer Than We Expected!
The rising trend line that started in March 2020 continues to serve as strong support.

ETHBTC x ETHDBINANCE:ETHBTC and CRYPTOCAP:ETH.D Test December 2017 Lows Ahead of Altseason!
Ethereum Bitcoin pair and Ethereum dominance rsi are at historic lows, which is the most plausible area for a bounce!

Ethereum ETH Is About To ReverseHello, Skyrexians!
Recently we have already made the analysis that BINANCE:ETHUSDT is printing the wave C inside the global wave 2 in this bull run. Today we will consider the wave C in details. As you know it shall consists of 5 waves and currently we can see the clear picture that dump can be over or almost over.
Let's take a look at 12 hours time frame. We can see that each Elliott Wave has reached the normal target. Wave 2 finished at 0.61 Fibonacci. The wave 3 reached exactly 1.61 level. Wave 4 finished inside the 0.5 zone. It gives us confidence that wave 5 will be the same length as the wave 1 and will be finished approximately at $1900. We have already almost seen this price. Moreover, price formed the green dot on Bullish/Bearish Reversal Bar Indicator and the divergence with AO. So, this trend could be over already or be very exhausted. The next move is the global wave 3. Target is unchanged: $7k realistic, $10k optimistic.
Best regards,
Skyrexio Team
___________________________________________________________
Please, boost this article and subscribe our page if you like analysis!

ETH has two pending CME Gaps#ETH #Analysis
Description
---------------------------------------------------------------
+ ETH has two pending CME future gaps to filled.
+ First gap is around 2900-3400 range and second gap is around 2500-2600 range.
+ Sooner or later these CME gaps will get filled. I'm expecting Gap2 get filled in this or next month and Gap 1 in the second or third quarter.
---------------------------------------------------------------
Enhance, Trade, Grow
---------------------------------------------------------------
Feel free to share your thoughts and insights. Don't forget to like and follow us for more trading ideas and discussions.
Best Regards,
VectorAlgo

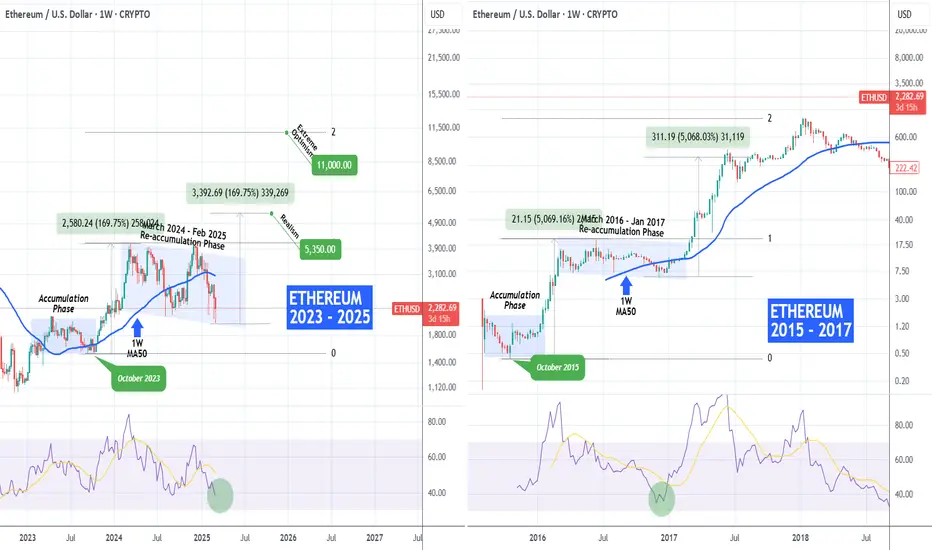
ETHEREUM Is a massive rally about to begin?Ethereum (ETHUSD) started the week lower but is attempting a closing near last week's candle close. Still below its 1W MA50 (blue trend-line) but the practically ranged price action of the past 12 months (March 2024 - Feb 2025) may be a Re-accumulation Phase similar to ETH's first Cycle when between March 2016 - Jan 2017 it consolidated but then started a massive rally until the end of the year.
As you can see, the two fractals are fairly similar, both starting with an initial Accumulation Phase. In the 2015 - 2017 Bull Cycle, the rally that followed the October 2015 Low was fairly symmetrical (+5069%) with the rally that followed the Re-accumulation Phase's bottom. The Cycle Top was priced higher on the 2.0 Fibonacci extension.
If ETH keeps replicating this past fractal, we can expect a more realistic Target at $5350 (+169.75% rise) and an extremely optimistic at $11000 (Fib 2.0 extension).
-------------------------------------------------------------------------------
** Please LIKE 👍, FOLLOW ✅, SHARE 🙌 and COMMENT ✍ if you enjoy this idea! Also share your ideas and charts in the comments section below! This is best way to keep it relevant, support us, keep the content here free and allow the idea to reach as many people as possible. **
-------------------------------------------------------------------------------
💸💸💸💸💸💸
👇 👇 👇 👇 👇 👇
Ethereum - Wyckoff Events and PhasesThe dominance of Bitcoin is growing. When Bitcoin is growing - altcoins are growing less or without rising. Bitcoin falls - alts fall even more.
Paired with ETHBTC, we see a Wyckoff Distribution Schematic #2. We are currently in Phase D. The price is approaching a support zone. Most likely, there will be some descending trading near this zone. We will form LPST (a last point of supply) and SOW (a sign of weakness). Next, we are waiting for Phase E.
Best regards,
EXCAVO

(ETH) ethereum "sliding scale"A view of Ethereum per the indicator I use the most, moving average with increments of a year, and symbols to determine the crossover/under patterns. dots are bad, plus signs are good generally based on the indicator.

Bullish bounce?Ethereum (ETH/USD) has bounced off the pivot which has been identified as a pullback support and could rise to the 1st resistance.
Pivot: 2,155.83
1st Support: 1,992.06
1st Resistance: 2,399.50
Risk Warning:
Trading Forex and CFDs carries a high level of risk to your capital and you should only trade with money you can afford to lose. Trading Forex and CFDs may not be suitable for all investors, so please ensure that you fully understand the risks involved and seek independent advice if necessary.
Disclaimer:
The above opinions given constitute general market commentary, and do not constitute the opinion or advice of IC Markets or any form of personal or investment advice.
Any opinions, news, research, analyses, prices, other information, or links to third-party sites contained on this website are provided on an "as-is" basis, are intended only to be informative, is not an advice nor a recommendation, nor research, or a record of our trading prices, or an offer of, or solicitation for a transaction in any financial instrument and thus should not be treated as such. The information provided does not involve any specific investment objectives, financial situation and needs of any specific person who may receive it. Please be aware, that past performance is not a reliable indicator of future performance and/or results. Past Performance or Forward-looking scenarios based upon the reasonable beliefs of the third-party provider are not a guarantee of future performance. Actual results may differ materially from those anticipated in forward-looking or past performance statements. IC Markets makes no representation or warranty and assumes no liability as to the accuracy or completeness of the information provided, nor any loss arising from any investment based on a recommendation, forecast or any information supplied by any third-party.

BITCOIN MAJOR PUMP! Price Analysis I hope you guys enjoyed the video!; let me know if you have any questions or comments and be sure to check out my Stock Market Idea

Ethereum Is Now Oversold (RSI & More Proof)Overextended. I opened this chart and there was no doubt, this move is already over-extended, the bearish move that is. I had to add the RSI to show it to you.
See, the RSI is oversold and the lowest since August 2024. Needless to say, when the RSI went this low in August it produced a reversal and a strong bullish wave. Now, it will do the same.
Very, very low volume on the drop. Just notice the bars, look at the chart. Isn't it clear?
I mean, based on technical analysis. I admit that the chart signals can be ignored and the market move against all odds, but normally, they work. It is the only tool we have available to try and predict what will happen next. The Ethereum chart is saying, "A reversal is coming, prices are about to start moving up. Get ready!"
Thank you for reading.
By the way, we are going beyond 11K.
Namaste.

DXY (Bitcoin - Alt Season - Bullish) everyone suddenly started posting DXY chart so I figured I should give my 2 cents on it as well.
People are finding hopes in DXY but main charts are still BTC.D and USDT.D
Monthly Chart has the whole picture
Weekly Chart (above) is what interests us
Breaking that Green Macro Trendline will be the 1st step towards success!
remember how yesterday everyone and their mothers were bearish except me?
This drama will continue, ignore the noise...

TAO - Extremely Bullishone of the few coins which are about to go in sub-wave 3 of macro-wave 3
haven't bought this one yet but might rotate a few weak positions to this if the structure holds
no idea what's going to happen to AI tokens (haven't looked into things yet, no time on hand) - sharing this purely based on TA

Death of ETH ?ETH is currently trading at a crucial support zone. A breakdown from this strong level could push ETH into a bearish trend, making recovery difficult.
However, if ETH manages to reverse from the $1,800–$2,000 support zone, there’s hope for a strong performance ahead. A further crash below this zone could have a severe impact on the entire Ethereum ecosystem.
The next two weeks will be critical—let’s see how things unfold. Hoping for a reversal from this support level!
Stay tuned for more updates.
Cheers,
GreenCrypto Team

eth buy midterm"🌟 Welcome to Golden Candle! 🌟
We're a team of 📈 passionate traders 📉 who love sharing our 🔍 technical analysis insights 🔎 with the TradingView community. 🌎
Our goal is to provide 💡 valuable perspectives 💡 on market trends and patterns, but 🚫 please note that our analyses are not intended as buy or sell recommendations. 🚫
Instead, they reflect our own 💭 personal attitudes and thoughts. 💭
Follow along and 📚 learn 📚 from our analyses! 📊💡"

BNX BUYhello friends
Considering the good growth of this currency, if the price returns to the support areas, we can buy in steps and with capital management.
*Trade safely with us*

SOL UPDATEhello friends
Considering the heavy fall of Solana, now we have formed a classic pattern in the good support area, and we can enter into transactions with the failure of resistance, with risk and capital management, and move with it to the specified goals.
*Trade safely with us*

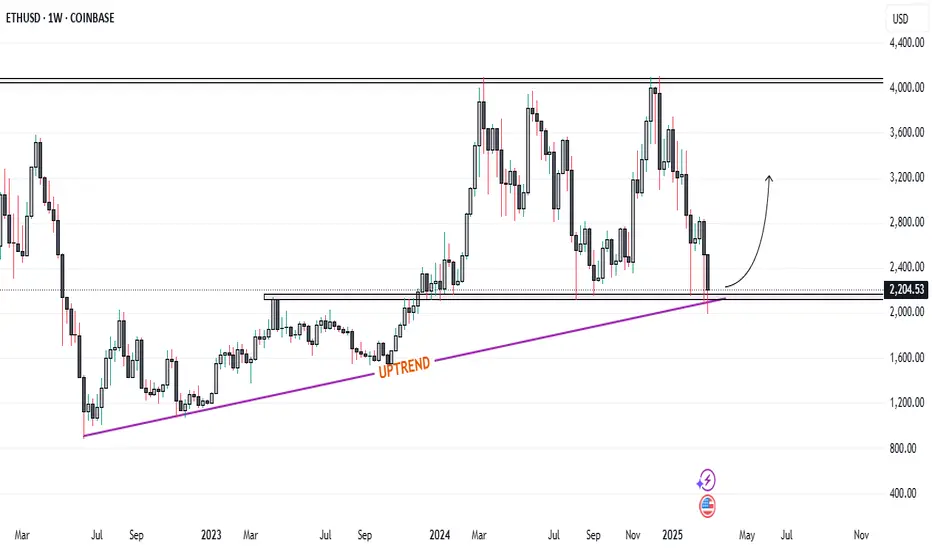
Ethereum Holds Key Support at Weekly Trendline: What's Next...?Ethereum Holds Key Support at $2,100: Could a Rally to $4,000 Be Coming? Altcoin Season and Trump’s Crypto Summit as Potential Catalysts
Ethereum is currently finding support at a critical juncture, with the price holding steady at the weekly uptrend line and an important support level around the $2,100 mark. Historically, every time Ethereum has tested this support zone, it has bounced significantly, often making strong moves toward the $4,000 level. The question now is whether history will repeat itself.
At this point, Ethereum’s ability to maintain this support level is crucial. With the market in a generally cautious state, Ethereum's resilience at this key level could signal the potential for a powerful rally in the near future. The broader crypto market is also awaiting the highly anticipated "altcoin season," where altcoins—especially Ethereum—could see a surge in demand, potentially driving prices higher.
Adding to the excitement, former U.S. President Donald Trump is set to host a crypto summit at the White House on March 7. This event could serve as a major catalyst for the next crypto rally, especially if significant regulatory or institutional insights emerge. The combination of Ethereum holding its critical support, the potential for altcoin season, and the White House summit could create the perfect storm for a significant price movement in Ethereum.
As Ethereum continues to hover around the $2,100 mark, traders and investors are closely watching for any signs of a breakout. If the rally to $4,000 materializes, it could set the stage for further gains, with the broader crypto market potentially following suit. The next few weeks could prove to be pivotal for Ethereum and the cryptocurrency space as a whole.
ETH in a LIVERMORE Accumulation cylinder.What is a Livermore accumulation cylinder?
The Livermore Accumulation Cylinder gained fame through the insights of Jesse Lauriston Livermore, a Massachusetts-born American investor celebrated as one of the most exceptional traders in history. His theory revolves around what is often referred to as an ascending broadening wedge, a phenomenon that unfolds over extended time frames.
What is an accumulation cylinder with a widening mouth?
First recognized by the iconic trader Jesse Livermore, who essentially laid the groundwork for technical analysis, the 'Accumulation Cylinder with Widening Mouth' is a unique and gradually developing pattern. In this scenario, the price oscillates between two diverging lines, creating a tension that can lead to a significant upward breakout.
Is Ethereum resolving its own Livermore cylinder?
This isn’t the first instance of cryptocurrency showcasing a Livermore cylinder: Ethereum might currently be in the midst of resolving its own version, and Bitcoin may have experienced a similar pattern back in 2017. While the charts may seem to align quite well, it’s crucial to remember that they are not a guarantee of future outcomes. Instead, they can serve as a valuable guide for managing risk, setting expectations, and establishing realistic profit targets. Many newcomers to crypto dream of achieving a 100x return, but as demonstrated by Bitcoin whales, true profits often come from strategically trimming and adjusting their positions, making only a few calculated moves from cycle to cycle.

Ethereum 10X Trade-Numbers (4,280% Potential)Ethereum is looking great right now and trading near support. This support level can turn out into a great entry level for a LONG trade.
This is for experienced traders. High risk vs a high potential for reward.
I am sharing the full trade-numbers below but the main purpose of this publication is timing. It is March 2025 now and we are seeing the end of the last correction before the biggest bull-market in the history of Cryptocurrency.
Thanks a lot for your continued support.
_____
LONG ETHUSDT
Leverage: 10X
Entry levels:
1) $2,150
2) $2,050
3) $1,950
Targets:
1) $2,882
2) $3,116
3) $3,350
4) $3,683
5) $4,108
6) $4,575
7) $4,865
8) $5,333
9) $6,090
10) $6,629
11) $7,315
12) $9,214
13) $11,111
Stop-loss:
Close weekly below $1,900
Potential profits: 4280%
Capital allocation: 5%
_____
Namaste.

Ethereum local top yet to be seen!Ethereum season has not yet fully started.
The place where the cash in the market will circulate will be eth. This is not an unusual situation and it is inevitable.

Potential bullish rise?Ethereum (ETH/USD) is falling towards the pivot and could bounce to the 1st resistance which has been identified as a pullback resistance.
Pivot: 2,098.80
1st Support: 1,941.25
1st Resistance: 2,384.00
Risk Warning:
Trading Forex and CFDs carries a high level of risk to your capital and you should only trade with money you can afford to lose. Trading Forex and CFDs may not be suitable for all investors, so please ensure that you fully understand the risks involved and seek independent advice if necessary.
Disclaimer:
The above opinions given constitute general market commentary, and do not constitute the opinion or advice of IC Markets or any form of personal or investment advice.
Any opinions, news, research, analyses, prices, other information, or links to third-party sites contained on this website are provided on an "as-is" basis, are intended only to be informative, is not an advice nor a recommendation, nor research, or a record of our trading prices, or an offer of, or solicitation for a transaction in any financial instrument and thus should not be treated as such. The information provided does not involve any specific investment objectives, financial situation and needs of any specific person who may receive it. Please be aware, that past performance is not a reliable indicator of future performance and/or results. Past Performance or Forward-looking scenarios based upon the reasonable beliefs of the third-party provider are not a guarantee of future performance. Actual results may differ materially from those anticipated in forward-looking or past performance statements. IC Markets makes no representation or warranty and assumes no liability as to the accuracy or completeness of the information provided, nor any loss arising from any investment based on a recommendation, forecast or any information supplied by any third-party.
