$BTC Macrolast idea remains intact—we are still bullish. Alts have held strong while BTC plunged. (I don’t own any BTC, and neither should you above $100K.)
I predicted the exact $15.5K bottom on X, as well as the August 5th crash and bottom. Unfortunately, I wasn’t on the charts in December and missed the biggest, clearest signal on USDT.D for a potential local top, which otherwise would have 2x'd my current portfolio but mistakes were made)
BTC taking the hits while alts hold steady is a strong sign that whales are taking profits from Bitcoin and preparing for "rotation".
Most traders believe the cycle is over—and there are valid reasons for that (some of them are):
- A monthly bearish engulfing candle
- A structure resembling the 2021 top, suggesting one last rally before the bear market
- Worst of all, double bearish divergence on the monthly, which worries me too
However, there are strong counterarguments.
The biggest? The cycle has never topped with BTC.D this weak. That’s why I’m still leaning toward a bullish scenario until proven otherwise.
Update on the above chart:
The parabola is intact with a beautiful reaction. That doesn’t mean we can’t still visit the red box—there’s only air between them—but I’m holding, and that remains my primary scenario.
Alts can make new lows, but RR isn’t worth it. As I’ve said before, the time to sell spot bags has passed. You don’t sell in between unless invalidation occurs.
Timing is everything. We failed to time this market, assuming it would mimic past cycles—but everyone was wrong. Traders won this cycle, while investors (except BTC holders) struggled... until now, at least.
ONLY DIFFERENCE BETWEEN BOTH SCENARIOS (MENTIONED ON CHART) FOR ALTS?
You have to wait way longer on the second scenario but both would take us to our goal.
Worst case? We break and HTF close on USDT.D - last hope, officially ending bull market!
ETH-D

SONIC ( PRE FTM )Analysis of the FTM OR Sonic currency
It seems that a trend reversal has formed and has completed 5 microwaves in the form of a larger wave 1
Next we need to see if it can break the major ceiling to confirm the new move
If you liked the analysis, share it with your friends and write down your comments

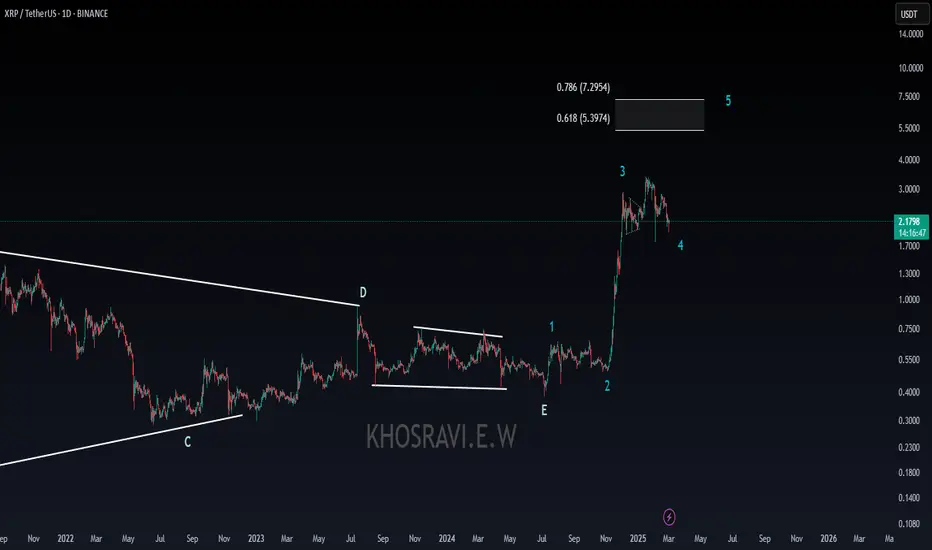
XRP ANALYSISVery important #XRP analysis on the daily time frame
Which in my opinion is one of the most important time frames to understand and comprehend the next movement of this currency.
So stay with us to be aware of the Ripple trend
If you liked this analysis, share it with your friends
Thank you
Ethereum’s Dip: A Golden Buying Opportunity?Ethereum has been a disappointment for traders.
Many were expecting a new all-time high, but so far, Ethereum has failed to deliver.
However, for speculators like me, this type of market movement presents an ideal trading opportunity.
Recently, ETH reached a key confluence support zone around the psychologically significant $2,000 level, reinforced by multiple technical factors. This setup suggests a strong potential for a reversal.
What’s Next?
✅ The $2,000 support zone remains critical, and I expect it to hold, leading to an upside move.
✅ While not aiming for extreme highs, I’m looking to buy dips near $2,200 with a target around $2,800.

$ETH Is On Life-Support - RSI Shows More Pain AheadSaved by closing the month above $2200.
However, RSI still shows more pain to come.
If ETH cannot convincingly hold that $2100 level,
it will most likely retest the $1700 - $1850 range.

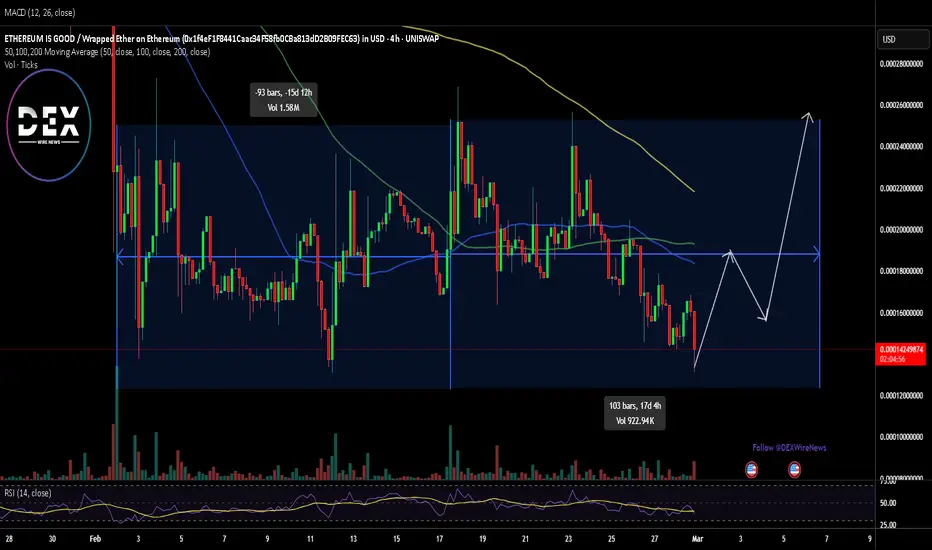
$EBULL Poised for a 90% Surge: Can It Break the 61.8 Fib Level?$EBULL, an Ethereum-based memecoin, aims for a significant 90% breakout. Built to celebrate Ethereum's resilience, ETHEREUM IS GOOD ($EBULL) is currently flashing bullish signals despite recent market conditions. With a crucial resistance level ahead, traders are closely watching for a reversal.
Technical Analysis
$EBULL is facing strong resistance at the 61.8% Fibonacci retracement level. A confirmed breakout could trigger an explosive rally. The Relative Strength Index (RSI) sits at 37.50, indicating oversold conditions and a high probability of a price reversal.
Should $EBULL breaches the 61.8% Fib level, a surge toward a 90% gain could be in play.
With these technical indicators aligning, $EBULL is on the verge of a major breakout, making it a coin to watch in the coming days.
Why $EBULL Matters
$EBULL is more than just a memecoin—it’s a tribute to Ethereum’s dominance in the blockchain space. The project aims to reignite Ethereum’s glory in the memecoin sector by emphasizing the network's unmatched utility and legacy.
Market Performance: $EBULL’s Current Standing
- Current Price: $0.000161 USD
- 24-Hour Trading Volume: $33,643.14 USD
- Market Cap: $1,608,178 USD
- Circulating Supply: 10,000,000,000 EBULL
Final Thoughts
$EBULL is primed for a major move. If bulls push past the 61.8% retracement level, a 90% surge becomes a feasible target. However, a failure to break resistance could lead to further consolidation.
As $EBULL gains traction in the memecoin sector, traders and investors should keep an eye on key technical levels. Will this be the next big Ethereum-powered memecoin breakout? Time will tell!
HOLD THE LINE $2.1K $ETHHOLD THE LINE $2.1K CRYPTOCAP:ETH 🗣️
The $2.1k major support at Ethereum Fibonacci retracement level 0.618 looks great for the initial phase of the next major uptrend!

ETH/USDTThere has been a liquidity withdrawal since August 2024. The target for growth is 4200+ to expand the current consolidation range. The global target is an ATH update = 4868

SOL ANALYSISThe analysis you see is on the weekly time frame.
If you need reviews on lower time frames to be posted on the TradingView site.... Leave a comment in the comments so that this can be done.
If you liked this analysis, share it with your friends.

Ethereum on the 6-Hour ChartHello, dear friends!💋
Ethereum's 6-hour chart is currently showcasing a Head and Shoulders (H&S) pattern, one of the most well-known reversal patterns in technical analysis. This setup could signal a potential trend shift, making it a critical moment for traders to keep a close eye on.
What is a Head and Shoulders Pattern?
The H&S pattern consists of three peaks:
Left Shoulder: A rise followed by a small dip.
Head: A higher peak, marking the top of the pattern, followed by another dip.
Right Shoulder: A smaller rise, typically symmetrical to the left shoulder.
The "neckline" connects the lows of the two dips (between the head and the shoulders) and serves as the key level to watch.
Why Is This Pattern Important?
The Head and Shoulders pattern often indicates a shift from an uptrend to a downtrend. It suggests that buyers are losing momentum and sellers are beginning to take control.
How to Trade the Head and Shoulders Pattern
1️⃣ Wait for the Breakout
The pattern is not confirmed until the price breaks below the neckline.
A breakout is typically accompanied by increased volume, which adds credibility to the move.
2️⃣ Set Your Entry
Once the neckline is broken, you can enter a short position (or sell if you're holding ETH).
Conservative traders may wait for a retest of the neckline as resistance before entering the trade.
3️⃣ Measure the Target
The potential price target is calculated by measuring the distance from the top of the head to the neckline.
Subtract this distance from the neckline to estimate the price drop.
4️⃣ Set Your Stop-Loss
Place your stop-loss above the right shoulder to limit risk in case the pattern fails.
If the neckline breaks, this could lead to a significant move lower, presenting a lucrative trading opportunity. However, patience is key—wait for confirmation before taking action. Always use proper risk management, as false breakouts can occur.
Ethereum's price action is heating up, and this Head and Shoulders pattern might just be the setup savvy traders have been waiting for. Stay sharp and trade wisely!
Stay tuned for updates, and let me know your thoughts in the comments.
Sincerely Yours,
Kateryna 💛

ETH has broken its 2 year ascending trendlineI have been busy working on our AI Super Aggregator so have not been as active in the market but look at this chart, it looks not good. We have broken a 2 year ascending trendline, the only goodish news is that it looks like we are trying to assume a nearly horizontal channel versus some steep descending channel.
Since we are at the bottom of that new channel I would expect some reprieve from the current descent but a good chance its just enough to come up and prove our old ascending channel as resistance before potentially heading back down to retest the bottom of channel support.
Really most the broad crypto market looks not so great but some assets have been trying to break their descent, and for some assets they are so oppressed right now you have to wonder, how much lower can it go?
Be vigilant, the market has already been cruel and at the moment it looks like it still has more anger to blow off.

ETH - Reclaim $3K Or Else I've spoken for a while about Ethereum's relative weakness. It continues to break down from long term uptrends. If price doesn't reverse this week's candle back to the upside soon, I think ETH is in danger of entering a longer term bear market, leading to sub-$1000 prices once again. More specifically, from a moving average and structure standpoint, I think ETH must reclaim the $3k level with confidence, or risk total free fall.
I don't need to spell out all the reasons I think crypto is NOT going to change the world for the better or be "disruptive" in a meaningful way, but I've exhausted all of my writing steam on the matter.
Some new environmental factors have emerged, however, which are much in line with what I've been concerned about over the last several years.
We can clearly see from a Macro standpoint that growth is stalling. Local governments and isolationism are starting to gain preference over globalization, in a large see-saw effect. In addition, Trump has further tarnished whatever neutral reputation crypto had gained on the global stage. I think institutions are even less likely to take this market seriously now.
There's pretty much air beneath here.
The crypto TOTAL market cap is now testing the highs from the previous bull market. It really should hold up here to avoid catastrophic damage:
TOTAL2 (altcoins and stables) is well below its previous all-time high, showing the potential for a truly failed bull market if things don't bounce around these levels.
ETH/BTC is already in free-fall mode. My guess is new lows for the ratio (below the 2019 levels)
Anyway, that's all from me. I won't be as long-winded as I used to be. Thanks for reading! As always, this is meant for speculation and entertainment only, and not as financial advice.
-Victor Cobra

$ETH + $BTC CryptocapCRYPTOCAP:ETH + CRYPTOCAP:BTC Cryptocap pair confirms the r-test phase after the handle cup formation breakout

ETH | ByBit HACK causes MASSIVE SELL-OFFBybit got hit with a serious security breach.
$1.4 billion was hacked in Ethereum, which is a huge amount of ETH. 2 Apparently the trouble started with their cold wallet, where they keep a lot of their crypto offline. The investigation points to the North Korean Lazarus Group as the likely culprits, and it seems the attack originated from some malicious code within their wallet provider, Safe Wallet.
Currently there's a big push to track down the stolen funds, and Bybit's even offering a bounty, but it's unlikely the funds will be recovered. It's important to understand that this wasn't necessarily a fault of Bybit's own security, but rather a problem with the wallet provider they were using.
Bybit has reassured users that withdrawals remain unaffected and other cold wallets are secure. While investigations into the incident continue, early speculation about Bybit buying back ETH to cover losses, which briefly boosted ETH's price, was dispelled by CEO Ben Zhou. He clarified that a bridge loan covered 80% of the stolen ETH, and there are no plans for spot market purchases. The hackers now holds a substantial amount of ETH across multiple wallets, raising concerns about potential drops should they decide to sell, but this may occur gradually over many months or even years (since they didn't buy it / it will not matter at what price it is sold).
This hack coincides with ETHDenver, a major Ethereum event typically associated with bullish market conditions and optimism. But overall, the outlook for Ethereum isn't looking as bright as it usually would be and this may lead to a further sell-off once more people catch on.
_________________
BINANCE:ETHUSDT

TOTAL MARKET CAP 2016\2017TOTAL MARKET CAP 2016\2017
TotalMarketCap final shakeout process before parabolic run!
CRYPTOCAP:BTC CRYPTOCAP:ETH and Altcoins will accompany the parabolic run!
Don't be shaken!

Supply & Demand for BTC.d <---> ETHBTCA notable change may be occurring in the market dynamics surrounding Bitcoin dominance, which reflects BTC’s share of the overall cryptocurrency market. Recently, it has displayed a shooting star candle, indicating a potential decline in BTC’s market influence. These signs point towards the beginning of an alt season, a time when alternative cryptocurrencies tend to outperform Bitcoin. With BTC stabilising around the significant $100k mark, the environment appears ripe for altcoins to attract investor interest. The upcoming weeks will be crucial in assessing whether this trend will gain traction, possibly transforming the market landscape for 2025.
Bitcoin experienced an impressive 2024, achieving new milestones and reinforcing its status as the market frontrunner. As we move into 2025, BTC remains robust, yet a shift in market dynamics may be imminent. Historically, Bitcoin’s dominance tends to wane when altcoins start to gain momentum, and this year might follow that pattern.
As Bitcoin finds stability around crucial price points, we often see liquidity shifting towards altcoins, sparking what many refer to as an alt season. Historically, during these times, altcoins tend to surpass Bitcoin in performance, offering significant returns for those investors ready to explore beyond BTC. With TOTAL3 approaching new price discovery and Bitcoin's dominance on the decline, the potential for altcoins to take center stage is becoming more apparent.
The crucial factor for BTC.d to unlock is how ETH performs against BTC. With the ETH/BTC ratio below 0.03, it appears appealing, but until it begins to rise, the alt season will be postponed. Alt season typically arises when Bitcoin dominance is high, not when it's low.
Typically, Bitcoin dominance tends to decrease in the years following a halving event. Therefore, I suspect that by the end of the year, dominance will be in the negative. However, up to this point, we have seen an increase in dominance this year.

DOGE The Next To Die In This Flush Of Crap Down The ToiletDoge had an amazing run, those who made money and got out I applaud you. Those still holding these bags of coal are about to get wrecked. Memes are dying, no one cares about them anymore. People are beginning to realize that these things have ZERO utility and no future. No ETF will ever get approved, its too inflationary. Take a look at the Grayscale trust thats a great insight to how many institutional investors want this thing. Its Total assets under management are less than $2 million dollars. Thats laughable compared to their other holdings. So even in the slim chance this turd gets an ETF it'll be an epic failure.
Your messiah Elon has abandoned this thing, the onyl real hope you all had for real world utility. Litecoin miners are dumping this as soon as they get it. The meme coin frenzy has died down. In January alone this year there were 600,000 meme coins created thats an all time record for a single month. That meme bubble is about to collapse as people move toward more utility driven cryptos and this space gets wrangled in a bit. Many people including myself have made a bunch of money playing in the meme coin casino, it was fun when it first started. 100x's everywhere. Now its pretty much over. The future for Doge is a slow and steady decline back to NAV under a penny. It was a great pump and dump. Dont marry your investments especially ones that are just memes with no utility they are made to get in and out, make money and rotate into something of value to preserve your wealth.
None of this is financial advice, just my opinion.

Ethereum has turned bearish (12H TF)After the CH turned bearish and lost the flip zone, along with the formation of a large liquidity pool below the chart, there are multiple confirmations that Ethereum is in a bearish structure.
It is expected to reach the lower demand zone and sweep the liquidity pool along its path.
A daily candle closing above the invalidation level will invalidate this analysis.
Do not enter the position without capital management and stop setting
Comment if you have any questions
thank you

The bearish scenario for Ethereum is now active (1D)We have always relied on the flip zone from our previous Ethereum analyses. Now that this zone has been broken, the bearish scenario for Ethereum is active.
A more accurate interpretation suggests that this is the correct structure. Given this, we have been in Ethereum's bearish Wave C for some time.
Ethereum is expected to move from the red zone toward the green zone soon.
For risk management, please don't forget stop loss and capital management
Comment if you have any questions
Thank You

(ETH) ethereumWhen can we expect to see reports on the new concepts about Ethereum in the future?
Buying mode, price of Ethereum well under the dotted line. Ethereum has not had a strong position for some time and is likely to find profits. One large drop in price does not usually follow another than another than another and especially not with such large volume and capital. Am I in control of the flow, no. Do I have billions to make heavy movements, no. Am I interested in the progress of Ethereum despite holding little to no value in Ethereum, yes.

LONG ON ETHEREUM (ETH/USD)Ethereum is currently at a major level of support.
The last time Ethereum was at this price was Nov of 2024 and ended up rising over 1600 points within a month.
I expect Ethereum to do the same thing!
I will be buying eth to the next level of supply/resistance.

SUI update#SUI is on of my favorite coins this coin has a good potential for a big rise and its always looking for liq in lower or higher prices ! just check this out
you can see that the huge drop took all the liq in lower prices
also you can see that there is a remaining liq around 3$ which is not taken
ans also we have a huge liq on higher prices which can be a sign of attraction to higher prices !

The key is whether it can rise above 2674.15
Hello, traders.
If you "Follow", you can always get new information quickly.
Please also click "Boost".
Have a nice day today.
-------------------------------------
(ETHUSDT 1M chart)
The key is whether it can receive support near the important support and resistance area of 2513.01-2706.15 and rise above the M-Signal indicator on the 1M chart.
If it fails to rise, you need to stop trading and check the situation.
The reason is that there is a high possibility of further decline.
-
(1W chart)
In order to turn into an uptrend, it is expected that the price will have to rise above 2706.15 at least to maintain it.
The reason is that the M-Signal indicators on the 1W and 1M charts are likely to cross near that point.
If it falls below 2316.10, it is likely to fall until it meets the HA-Low indicator.
Since the HA-Low indicator is likely to be newly created as the price falls, it is important to see if there is support near it if it is newly created.
The HA-Low indicator is currently formed at 1340.12.
-
(1D chart)
The key is whether it can find support near 2316.10-2513.01 and rise above 2674.15.
If it fails to rise, it is likely to show a step-down trend.
Since it has currently fallen below the M-Signal indicator of the 1M chart, it can be seen as a downward trend from a long-term perspective.
However, since the transaction with the M-Signal indicator of the 1M chart is not far away, it is thought that it is likely to rise.
Therefore, the HA-Low indicator point of 2674.15 is likely to be the high point of the rebound.
-
Basically, the time when we can trade is when the price rises above the M-Signal indicator of the 1D chart and maintains the price.
And, when the M-Signal indicators of the 1W and 1M charts are aligned.
Otherwise, the transaction must be short and quick.
When the downtrend begins during spot trading, it becomes busy.
The reason is that we need to increase the holding quantity.
There are two ways to increase the number of holdings: investing a lot of money to buy, and increasing the number of coins (tokens) corresponding to the profit.
If you have a lot of cash or about 20% of the total investment, you can use the method of buying when the M-Signal indicator on the 1D chart rises above the level and making a profit.
-
If you have little or no cash, you will eventually have to sell the coins (tokens) you currently have and buy them again to increase the number of holdings.
In other words, when there is a rebound, you should sell part of the purchase principal, and when there is a decline, you should buy back the amount you sold.
The ultimate goal of this method is to recover all of the purchase principal and hold the remaining number of coins (tokens).
I think there is no better way for long-term investment.
-
Thank you for reading to the end.
I hope you have a successful transaction.
--------------------------------------------------
- Big picture
I used TradingView's INDEX chart to check the entire range of BTC.
(BTCUSD 12M chart)
Looking at the big picture, it seems to have been maintaining an upward trend following a pattern since 2015.
In other words, it is a pattern that maintains a 3-year upward trend and faces a 1-year downward trend.
Accordingly, the upward trend is expected to continue until 2025.
-
(LOG chart)
Looking at the LOG chart, you can see that the upward trend is decreasing.
Accordingly, the 46K-48K range is expected to be a very important support and resistance range from a long-term perspective.
Therefore, I expect that we will not see prices below 44K-48K in the future.
-
The Fibonacci ratio on the left is the Fibonacci ratio of the uptrend that started in 2015.
That is, the Fibonacci ratio of the first wave of the uptrend.
The Fibonacci ratio on the right is the Fibonacci ratio of the uptrend that started in 2019.
Therefore, this Fibonacci ratio is expected to be used until 2026.
-
No matter what anyone says, the chart has already been created and is already moving.
It is up to you how to view and respond to it.
Since there is no support or resistance point when the ATH is updated, the Fibonacci ratio can be appropriately utilized.
However, although the Fibonacci ratio is useful for chart analysis, it is ambiguous to use it as a support and resistance role.
The reason is that the user must directly select the important selection points required to create the Fibonacci.
Therefore, it can be useful for chart analysis because it is expressed differently depending on how the user specifies the selection point, but it can be seen as ambiguous for use in trading strategies.
1st: 44234.54
2nd: 61383.23
3rd: 89126.41
101875.70-106275.10 (when overshooting)
4th: 134018.28
151166.97-157451.83 (when overshooting)
5th: 178910.15
-----------------
