LITECOIN LTC/USD Is About To Blow Your Mind!Litecoin is repeating a much larger version of the run back in its earlier days as I show in the charts. This next move up in Litecoin is going to shock the entire cryptosphere. This is just looking at the chart and if the move repeats on a larger scale then Litecoin will probably be in $10000 dollar range. This might sound absolutely insane I know, it sounds crazy to me to but thats what the chart is telling me. Im not going to get into the reasons why fundamentally this is likely, if you want to go back into my other LTC posts I get into detail.
Dont listen to the haters, they will be the ones to give us our blow off top while we dump on their chin.
ETH-D

XRP The Greatest Deception & Delusion In Crypto History!I cannot believe how many have fallen for this deception. I cant believe how many are about to get scammed and rug pulled by Ripple. The amount of hype this thing has had over the years is simply amazing, just to keep it afloat so Ripple can sell their holdings to unwary, and naive investors. The number of influencers getting paydays because of clicks and subs by pumping this thing with their wild and wacky delusional predictions should be criminal. The amount of people being led to slaughter is going to absolutely be awful. This crypto is going to destroy so many investors wallets, hopes, and dreams. I cant believe this crap. Lets break this piece of turd down so a layman and children can understand because those are the only ones who would invest in something so worthless.
I know, I know but banks, banks, banks, banks! Yeah yeah yeah Garlic Bread shook Trumps hand I know I know. Lets get real here kids!
No banks are going to hold anything that is as volatile as this crap. The new stable coin RLUSD has officially made XRP useless. Why would any bank use something that can change in price within minutes over a stable USD pegged asset. They simply will not.
Also lets clarify some things here:
SANTANDER
Santander does not use XRP to power its One Pay FX service, which is a blockchain-based international money transfer service. Instead, Santander uses Ripple's xCurrent, a blockchain software that enables real-time tracking and settlement of payments
STANDARD CHARTERED BANK
You can't currently send money through Standard Chartered Bank using XRP tokens, but you can send and receive XRP using other services. Standard Chartered Bank works with a number of cryptocurrencies, including Bitcoin, Ether, XRP, and stablecoins. Standard Chartered offers a variety of services for digital assets, including custody, trading, and banking. NOT JUST XRP
BANK OF AMERICA
You can't currently send money through Bank of America using XRP, but you can send money using Bank of America's wire transfer service. Bank of America (BoA) has been exploring Ripple's blockchain technology and XRP, and may use XRP for payments in the future.
MARKET CAP OF XRP TOKEN VERSUS OTHERS
XRP MARKET CAP $144 BILLION
MONEYGRAM $1 BILLION
WESTERN UNION $3.66 BILLION
SANTANDER BANK $93 BILLION
STANDARD CHARTERED BANK $27 BILLION
PAYPAL $77 BILLION
JP MORGAN CHASE BIGGEST BANK IN WORLD! $785 BILLION
AMERICAN EXPRESS $218 BILLION
BANK OF AMERICA $353 BILLION
CITI GROUP $160 BILLION
So you're trying to tell me that XRP market cap of $144 billion isn't already overvalued like crazy! Its worth more than Moneygram, Santander, Western Union, Standered Chartered Bank, Paypal, and Citigroup. For what reason would it be actually worth that much right now when everything is mostly just hype and speculation and being duped. Even if every bank did use it they arent holding onto it. They are simply buying it and then selling it instantly and converting it to whatever fiat the exchange called for. Simpletons believing that XRP can actually be worth $100 or $500 each is so crazy and stupid its hard to believe no one can do math. This thing will be lucky to double top and let you get out. Its going to crash in an epic fashion because its value to worth is so far off its insane.
Some more facts!
All XRP was pre-issued at launch, unlike cryptocurrencies that use mining
The XRP creators gifted the company 80% of all XRP, keeping 20 billion units for themselves
80% OF XRP WENT TO THE COMPANY FOR CRYING OUT LOUD!
WILL BANKS USE XRP WITH IT BEING SO VOLATILE?
Banks might use XRP despite its volatility because it functions as a bridge currency, allowing them to quickly and efficiently settle cross-border transactions at a lower cost by converting currencies into XRP instead of relying on traditional fiat currency exchange processes, which can be significantly slower and more expensive; essentially, the price fluctuations of XRP become less relevant when used solely as a TEMPORARY intermediary in transactions. KEY WORD TEMPORARY. BUY, SEND, SELL! NO ONE IS INVESTING IT IT ITS MERELY A SETTLEMENT CURRENCY.
The Ripple network, where XRP operates, is designed to provide readily available liquidity for cross-border transactions, meaning banks don't need to hold large reserves of various currencies! Wake up people, and now that the stable coin is running on the Ripple RLUSD, there is NO USE FOR XRP THE TOKEN. XRP was simply a token to dump on clueless investors to keep the company Ripple going.
If you think that all these institutions want to invest in XRP and theres this huge demand for institutional buyers of XRP lets take a look at Grayscale the closest thing available to big investors on the stock market.
SOME GRAYSCALE HOLDINGS
XRP $14 MILLION
ZCASH $13 MILLION
HORIZEN $14 MILLION
XLM $41 MILLION
CHAINLINK $22 MILLION
BITCOIN CASH $134 MILLION
ETHEREUM CLASSIC $240 MILLION
LITECOIN $260 MILLION
XRP is on the same level as Horizen and ZCASH, one of their lowest holdings. This is a clear sign that no big money wants anything to do with XRP the token because if they did they would be investing through the trust. XRP the token was a scam from the get go to get the insiders rich and to pay for the development of Ripple the company. If and when Ripple the company goes public do you really think your precious XRP token will be worth anything. NO IT WONT. THEY WILL HAVE THEIR OWN DAMN TICKER THAT HAS NOTHING TO DO WITH XRP.
Oh and the ETF, No f'ing way that thing will ever get approved while the SEC is still going after it. Get real! Even so even if THE SLIGHTEST CHANCE it did it'll have as much demand as the XRP Grayscale trust, NONE IT'LL BE A DAMN DUD. No big money will touch this with a 1000 foot pole. Not with the company holding still almost 60% of the supply. Its a honeypot for the creators.
None of this is meant to be financial advice just my opinion. Dont lose your shirts.

ETHBTC - Is the Bear Nearly Over? Price is now testing the 0.618 level which is seen as a strong support for price
Hopefully at this level we see a reversal from the bulls and price pushes up to .786
This bear market has been brutal for ETH
Alt season will kick in soon, with ETH leading
Green bars pattern is just my price action thoughts
Daily timeframe

ETHUSD - Channel UpAn up channel plotted for Ethereum on this Weekly chart
As price has kind of slumped at the bottom of this channel I expect bull moves to come soon to catch up to Bitcoin
I'm very bullish on ETHUSD
Similar situations within each green circle
Weekly

ETHUSD - Strong Support LevelDuring the prior bullrun this level was tested as support and respected it as support
Right now it has been tested again and is testing this area
My view is that this will be a good reversal point up for price, with this being support found along this dotted line.
Daily timeframe

I WANT MORE ETHEREUMEthereum took current liquidity in the liquidity zone ahead of the mega pum as it continues to consolidate on the uptrend

ETHUSD bottomed and will now look for 4k and above.Ethereum / ETHUSD is consolidating after an early February bottom on Support A.
Both in terms of pure price action and 1day MACD, the current bottom is replicating Augusts, which was also formed after a Falling Wedge broke downwards.
With the recent 1day MACD Bullish Cross formed, we expect the 4100 Resistance to get tested in April.
Follow us, like the idea and leave a comment below!!

ETHUSDT CHART UPDATE !!ETH/USDT chart on the daily timeframe is currently in a descending channel. It recently bounced off the lower trendline, indicating a potential short-term bullish reversal. The lower boundary of the channel acts as a strong support level around $2,400-$2,500. The upper trendline of the descending channel, near $3,000, is the next potential resistance. If Ethereum continues this bounce, it could head towards the $3,000 resistance area. A breakout above the channel could signal a trend reversal to the upside, while rejection could push ETH back toward lower support. Keep an eye on volume and price action near resistance levels to confirm the next move.
If you found this analysis helpful, hit the Like button and share your thoughts or questions in the comments below. Your feedback matters!
Thanks for your support!
DYOR. NFA

Ethereum ETF attracted $393million.What will be the impact next?U.S. ether (ETH) exchange-traded funds (ETFs) have seen net inflows of $393 million this month.
In stark contrast, bitcoin (BTC) ETFs saw net outflows of $376 million during the same period.
According to the data available, the nine U.S.-listed ether spot ETFs saw inflows seven times higher than in January. Notably, these funds saw outflows on only two trading days throughout the month. In contrast, the 11 bitcoin ETFs struggled with low market sentiment, with inflows on only four trading days throughout the month.
Despite the sharp increase in investor interest in ether, its price has not risen accordingly. Since falling to $2,000 on some exchanges at the beginning of the month, ether has been trading in a range of $2,600 to $2,800. Similarly, bitcoin has remained below $100,000, and both cryptocurrencies have experienced price volatility, especially in the meme coin sector.
Part of the reason for investors turning to ether ETFs is the carry trade strategy, where investors buy spot ETFs while shorting ETH CME futures. These activities may also include bullish bets on the cryptocurrency.
Looking ahead, market participants are anticipating that the upcoming Pectra upgrade on April 8 could drive ether prices higher. The upgrade will improve Ethereum’s performance by optimizing its execution and consensus layers, helping it maintain its competitive advantage over other Layer 1 blockchains such as Solana.
Nick Forster, founder of Derive.xyz, expressed optimism about ether’s prospects, citing the technical improvements and network enhancements that the Pectra upgrade will bring. He highlighted Ethereum founder Vitalik Buterin’s push for a 10x increase in Layer 1 gas limits, which could lead to better application development and security.
Additionally, the Ethereum Foundation’s recent $120 million investment in DeFi projects is seen as a sign of increased adoption and growing institutional interest, especially through initiatives such as ETHrealize, led by Vivek Raman, which is working to bring traditional financial institutions into the blockchain space.
Forster is positive about ether’s price action, saying, “The probability of ether breaking $3,000 by the end of the quarter is now 30%, up from 28% last week.”
BINANCE:ETHUSDT BINANCE:BTCUSDT.P
Mr. Baker

ETH Updated Building Blocks...Hello TradingView Family / Fellow Traders. This is Richard, also known as theSignalyst.
As per our last analysis, ETH broke below the $2,500 mark to enter long-term bearish territory.
Here is the updated Building Blocks:
📉 Short-Term Bearish:
ETH is currently trading within a short-term bullish block between $2,500 and $3,000.
📉 Long-Term Bearish:
If the $2,500 level is broken to the downside, a long-term bearish movement toward the lower bound of the long-term bearish block, around the $2,100 mark, is expected.
📈 Short-Term Bullish:
If ETH breaks above the short-term bullish block at $3,000, it will enter a short-term bullish block phase.
📈 Long-Term Bullish:
If the $3,500 resistance level is broken to the upside, ETH is expected to enter a long-term bullish block, initiating a new bullish phase toward the $4,000 mark.
📚 Always follow your trading plan regarding entry, risk management, and trade management.
Good luck!
All Strategies Are Good; If Managed Properly!
~Rich

Ethereum’s Bullish Retest: Ready for Takeoff? Key Insights:
Breakout & Retest in Play
Ethereum (ETH) has broken above a key resistance level around $2,727 - $2,730.
A retest of this zone could confirm it as new support before the next leg up.
Bullish Price Action Expected
The price is consolidating near recent highs, forming a potential bullish continuation pattern.
If the retest holds, ETH could surge toward $2,769 and beyond.
RSI Momentum
RSI is near overbought levels but remains strong, suggesting further upside potential after a slight pullback.
Trade Strategy:
Bullish scenario: A successful retest of $2,727-$2,730 could provide a buy opportunity for the next breakout.
Bearish invalidation: If ETH falls below this zone, a deeper correction might occur.
🔥 Final Take: Bulls are in control, and a successful support retest could ignite Ethereum’s next move toward $2,800+! 🚀

FARTCOIN - Hot air rises Entry Point:
Enter a long position around $0.4590-$0.4600 after confirmation of a breakout or bullish reaction at this demand zone. Look for bullish candlestick patterns such as wicks rejecting lower prices, bullish engulfing candles, or lower timeframe structure shifts to confirm entry.
Stop-Loss (SL):
Set your stop-loss below $0.4100, just beneath the support level, allowing for minor wicks while minimizing downside risk.
Take-Profit Levels:
📍 TP1: $0.6500
Justification:
🔹 Range Low Support: Price is reacting from a key support level within a well-defined range.
🔹 Potential Range Reversal: The setup suggests a move towards the range highs at $0.6500-$0.6664 if the support holds.
🔹 Liquidity Sweep: Previous wicks indicate potential liquidity grabs, often preceding a reversal.
🔹 Risk-Reward Favorability: Aiming for at least a 3:1 risk-to-reward ratio, making the setup efficient.
📌 Bonus: If price reaches $0.6500-$0.6664, watch for potential rejection for a short opportunity targeting mid-range levels.
Disclaimer:
This setup is for educational purposes only and does not constitute financial advice. Always conduct your own research and consult a licensed financial advisor before entering trades. The cryptocurrency market is highly volatile—only trade with funds you can afford to lose.

This plan gave me 80 pips of profit in Ethereum
Late yesterday, I came up with a perfect trading plan based on the accurate analysis of Ethereum trends. The expected support level is 2686 target, and the rebound rose to the target level of 2780. This plan successfully allowed me to gain 80 pips of profit in Ethereum trading. I think some great traders saw my trading plan at the time, and now they must be very happy and excited to have reaped the same high profits as me. Of course, this also makes me feel very proud and satisfied because my selfless efforts have helped more traders.
Next, I will continue to share my accurate trading plans for gold, Bitcoin, Ethereum, crude oil investment, etc., so that I can help more traders and stop them from being confused by investment failures! ! !
BINANCE:ETHUSDT
Mr. Baker

ETH - Long trade Simple set up
Trade the channel. I have entered long at the bottom of the channel with the exit plan being the top of the range.

sol\eth bearish divergenceCRYPTOCAP:SOL \ CRYPTOCAP:ETH Bearish divergence!
Money earned from the casino begins to return to the real store of value!

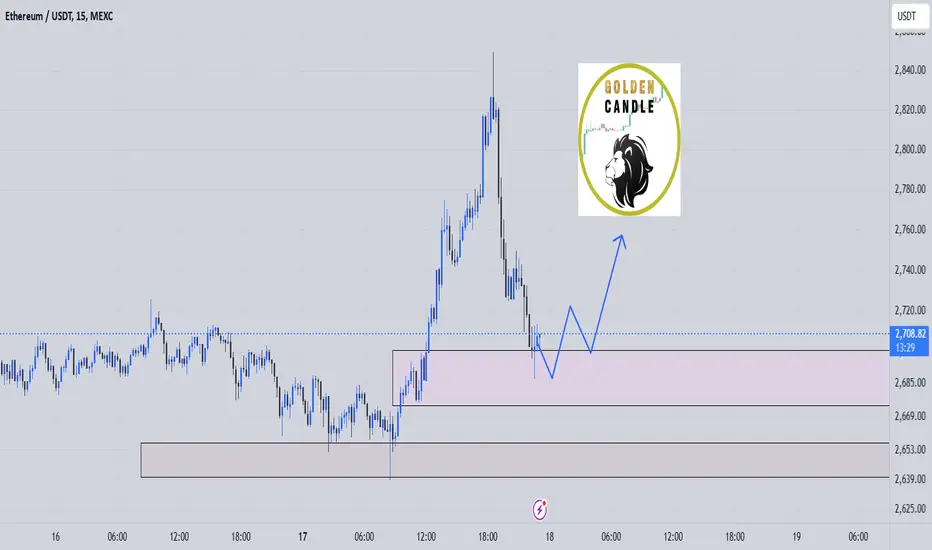
eth long midterm"🌟 Welcome to Golden Candle! 🌟
We're a team of 📈 passionate traders 📉 who love sharing our 🔍 technical analysis insights 🔎 with the TradingView community. 🌎
Our goal is to provide 💡 valuable perspectives 💡 on market trends and patterns, but 🚫 please note that our analyses are not intended as buy or sell recommendations. 🚫
Instead, they reflect our own 💭 personal attitudes and thoughts. 💭
Follow along and 📚 learn 📚 from our analyses! 📊💡"