Be careful with ETHEREUM !!!The price has formed a bullish wedge on the 1h time frame, and if it breaks out, it can drive the price up to around $2900.
Give me some energy !!
✨We spend hours finding potential opportunities and writing useful ideas, we would be happy if you support us.
Best regards CobraVanguard.💚
_ _ _ _ __ _ _ _ _ _ _ _ _ _ _ _ _ _ _ _ _ _ _ _ _ _ _ _ _ _ _ _
✅Thank you, and for more ideas, hit ❤️Like❤️ and 🌟Follow🌟!
⚠️Things can change...
The markets are always changing and even with all these signals, the market changes tend to be strong and fast!!
ETH

XAUUSD ANALYS#XAUUSD ANALYS
####### This analysis was loaded with the correct wavenumber. ######
With this wave count, we can say that here, by hunting liquidity, $2950 will move towards $2700 to complete micro-wave C of wave 4.
I hope this analysis has helped you.
Share this analysis with your friends.
The analysis was done by Mr. Khosravi.
Signature
KHOSRAVI.E.W

ETH—Time Has become CrucialETH has had 2 weekly closes below 3000
This is not too surprising nor should it be an end all be all indicator, that determines whether the bull run in BTC, Alts, or both, is coming to a halt or resuming
With that being said, time appears to be getting important, as 3 weekly closes should certainly be concerning.
Here we can see an intact trendline from multi-year lows all the way to more recent lows, until it just recently retested.
Additionally, most volatile, and aggressive moves from from a flase breakdown, which washes out week hands one last time.
-After hitting strong support at 2150, and dropping nearly 30% in hours, ETH QUICKLY recovered the entirety of its loses within a day.
-2150 has several levels of strong support and a further array of support/former resistance levels with 25-50$
-Time is important here—I expect for ETH to make a beeline to 3000 early next week and definitively close above 3000 on the weekly chart, signaling the resumption of the altcoin bull market in earnest.
-If this does not happen, I would say there is a cause for concern, and something is very wrong.
It is also important to note the Bollinger Band crash on the weekly chart when 2150 was tested. The last time this exact scenario occurred, ETH rallied back well above 3000 in a short period of time.
Comments appreciated thanks

Name Your Cryptos ! I’ll Analyze the Most Voted Picks!Tell me the coin name, and I'll analyze it for you!

ETH Building Blocks...Hello TradingView Family / Fellow Traders. This is Richard, also known as theSignalyst.
ETH Building Blocks:
📈 Short-Term Bullish:
ETH is currently trading within a short-term bullish block.
📈 Long-Term Bullish:
If the $3,500 resistance level is broken to the upside, ETH is expected to enter a long-term bullish block, initiating a new bullish phase toward the $4,000 mark.
📉 Short-Term Bearish:
If ETH breaks below the short-term bullish block at $3,250, it will enter a short-term bearish block phase.
📉 Long-Term Bearish:
If the $3,000 level is broken to the downside, a long-term bearish movement toward the lower bound of the long-term bearish block, around the $2,500 mark, is expected.
📚 Always follow your trading plan regarding entry, risk management, and trade management.
Good luck!
All Strategies Are Good; If Managed Properly!
~Rich

BTCAll you need to know about next #BTC huge moves.
We can see the next BULLRUN dates. The highest points of BITCOIN in this market 2024/2026 and 2028th years

Is Ethereum Ready to Rally? Critical Levels and Elliott Wave InsIf you find this information inspiring/helpful, please consider a boost and follow! Any questions or comments, please leave a comment!
Ethereum Analysis: Key Levels and Market Structure
Ethereum has been moving in tandem with Bitcoin, but there are some distinct levels and market structures developing that are worth paying attention to. While most of the focus has been on BTC, ETH has been presenting some solid trade setups as well. Here’s my breakdown of where we stand and what I’m watching next.
Holding the Low: 2563 as a Double Zig-Zag
Ethereum has been working through a potential 2xZZ (double zig-zag) pattern, and 2563 stands as a key level to maintain that structure. If this low holds, the bullish case remains intact. However, we aren’t currently sitting in a Golden Zone (GZ) or a major discount level based on the recent dump, which adds some caution to aggressive entries.
Bullish Steps: 2665 & 2800 as Critical Resistance
For any bullish momentum to materialize, the first step is 2665—this level needs to break for buyers to start taking control. From there, 2800 is the larger resistance level that Ethereum must break and hold to show real strength. A rejection at this zone could lead to another corrective leg downward.
Confirmation of the Double ZZ: 2900 Break
The completion of the double zig-zag pattern will be officially confirmed with a break of the 2900 pivot. This is the critical point where bullish structure would be fully validated, signaling further upside potential. Until that happens, Ethereum remains in a make-or-break zone.
Until then, I’ll be watching how price action (PA) prints before making any major decisions. What do you think—will ETH break through or are we looking at more downside? Drop your thoughts below!
Trade safe, trade smart, trade clarity.

BREIFING Week #6 : Volatility is LyingHere's your weekly update ! Brought to you each weekend with years of track-record history..
Don't forget to hit the like/follow button if you feel like this post deserves it ;)
That's the best way to support me and help pushing this content to other users.
Kindly,
Phil

The elusive alt season... Is QE coming soon?The magical Alt season never seems to come. Most have thrown in the towel or lost all their money, which is a good sign the bottom is in.
The secret here is paying close attention to the FED's (FRED:WALCL) Quantitative tightening and easing.
Since the start in 2008, we have always either had QE or some sort of pause like you see in the 2016/17 bull run, but as soon as the FED flips to tightening, what happens? BTC pauses.
It is true that Bitcoin has performed very well during tightening cycles, as massive corporations like BlackRock and MicroStrategy are eating through the supply.
As for the altcoin market, it has been a bloodbath. One thing that’s clear to me is that altcoins need the FED to flip to QE in order to get things really going.
Going over the latest FED's Monetary Policy Report that came out yesterday, it hints that they are close to ending their tightening cycle and easing off a bit.
**WHICH IS HUGE NEWS!**
We can now see that this is true indeed because the red line is now starting to flatten out, just like in 2020 before the FED flipped to QE.
As far as the technicals go, the altcoin chart has now formed an ascending triangle and, for now, is still printing higher lows. 20 days left for this monthly candle to close.
If, let's say, this monthly candle breaks ATH and closes above it, it could signal the start of the alt season, and if history repeats, we’re looking at a run-up from March 2025 to September/October 2025.
So the next FOMC meeting from the FED is the most important of the year. Now that this report hints at the end of the tightening cycle, is it possible that at the next FOMC meeting on March 18th, 2025, they will announce the end of tightening and trigger the start of the alt season?
Pretty heavy upper wick for now on the BTC.D. It’s currently on the .702 retracement. Is this the top?
A chart I use a lot. Really want to see this monthly candle close back into this triangle.
**Alts/USDT.D**
This chart is one of the most important ones I’m looking at right now. Currently forming a bump-and-run reversal, and again, very bullish if we hold the neckline.
The USDT.D chart will always lead the way. It’s always one step ahead, never fails me. Until we see a break of this green support line, we won’t see ALT season. The bear flag pattern target is the same target as April 2021, which is interesting.
As I published on my ETH TA, if we close the weekly in this channel, it will be very bullish.
### Conclusion
I'm extremely bullish right now. Leverage has been reset, greed has been reset, and everyone is throwing in the towel. On social media, "it's over" talk is everywhere. This is the kind of depression I'm looking for to tell me it’s the start of ALT season and not the end.
**Invalidation of this thesis would be the following:**
- ETH closes weekly under the channel
- Bump-and-run reversal fails to hold the neckline
- FED does not flip to QE in the FOMC meeting on March 18th
If all these things happen, I will flip bearish. Until then, I'm extremely confident that this is the bottom, and you should go all out, lay all the cards down, take out loans, put all your chips on the table—it’s time to go hard or go home!

The key is whether it can rise above the M-Signal of 1M chart
(Title) The key is whether it can rise above the M-Signal of 1M chart
(Example of a trading strategy when trading spot)
-----------------------------------------
Hello, traders.
If you "Follow", you can always get new information quickly.
Please also click "Boost".
Have a nice day today.
-------------------------------------
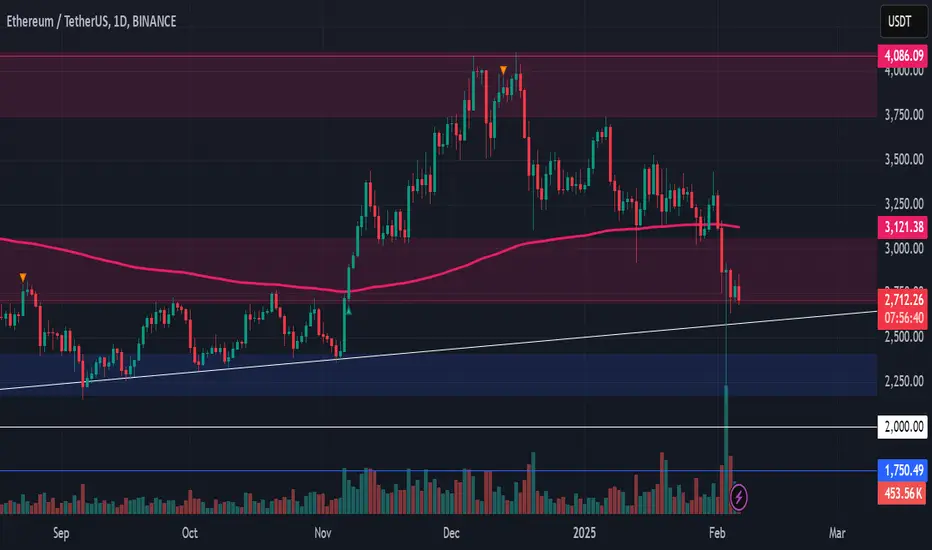
(ETHUSDT 1D chart)
The key is whether it can rise above the MS-Signal (M-Signal on the 1D chart) indicator after receiving support near the M-Signal indicator on the 1M chart.
If it fails to rise above 2879.90, it is likely to fall to around 2316.10-2513.01.
-
In order to trade, you need to check the support and resistance points when it rises above at least the 5EMA+StErr indicator and shows support.
In other words, it is expected that it will be important whether it is supported near 2879.90.
In order to turn into an uptrend, the price must rise above the M-Signal indicator on the 1D, 1W charts and maintain the price.
Based on the current position, it seems that it will be possible only if it rises above 3136.41.
However, since the 3265.0-3321.30 section is an important support and resistance section, it is expected that the uptrend will continue only if it rises above this section.
-
If you have selected support and resistance points, you should consider whether you can create a trading strategy near that point.
The indicators suitable for creating a trading strategy are the HA-Low indicator and the HA-High indicator.
Since it is currently located within the box section of the HA-Low indicator, you can create a trading strategy when it receives support near the upper point of the box and rises.
The box section of the HA-Low indicator is 2125.01-2921.0.
Accordingly, you can see that it corresponds to an important point around 2879.90.
Then, you can respond depending on whether there is support in the M-Signal indicator of the 1D, 1W chart or the 3265.0-3321.30 section.
-
Spot trading is a place where you can get new opportunities when it falls.
However, if the investment period is short or less, you do not need to set up a trading strategy because you have to make profits while you are making profits.
However, if you are trading for a short or longer investment period, you can sell some of the amount corresponding to the purchase principal and buy back the amount sold when the price falls to increase the holding amount.
On the other hand, there is also a method of selling some of the purchase principal when the price rises after buying and buying back when the price falls.
However, there is a risk because it can rise before buying again when it is on an upward trend.
Therefore, when trading in the spot market, the time of decline is an important time to create a trading strategy, and you have to trade very busily.
If you sell all the amount corresponding to the purchase principal in this way, only the number of coins (tokens) corresponding to the profit will remain, so from then on, you will have pure coins (tokens) with an average purchase price of 0.
I think that increasing the number of coins (tokens) is a good trading method for long-term investment in the spot market.
-
You should always hold about 20% of the total investment amount in cash.
This is because you can get a good opportunity when a large volatility like this occurs.
If you do not have cash, you must sell a certain amount to secure cash.
Even if you are losing money in the spot market, if you increase the amount held by selling and then buying as above, you can convert it into profit more quickly.
In my chart, the MS-Signal (M-Signal on the 1D, 1W, and 1M charts) indicator, which is a trend indicator, is important.
We need to observe in real time to see how to utilize this.
-
Thank you for reading to the end.
I hope you have a successful trade.
--------------------------------------------------
- Big picture
I used TradingView's INDEX chart to check the entire range of BTC.
(BTCUSD 12M chart)
Looking at the big picture, it seems to have been maintaining an upward trend following a pattern since 2015.
In other words, it is a pattern that maintains a 3-year upward trend and faces a 1-year downward trend.
Accordingly, the upward trend is expected to continue until 2025.
-
(LOG chart)
Looking at the LOG chart, we can see that the upward trend is decreasing.
Accordingly, the 46K-48K range is expected to be a very important support and resistance range from a long-term perspective.
Therefore, we expect to see prices below 44K-48K in the future.
-
The Fibonacci ratio on the left is the Fibonacci ratio of the uptrend that started in 2015.
In other words, it is the Fibonacci ratio of the first wave of the uptrend.
The Fibonacci ratio on the right is the Fibonacci ratio of the uptrend that started in 2019.
Therefore, this Fibonacci ratio is expected to be used until 2026.
-
No matter what anyone says, the chart has already been created and is already moving.
It is up to you how to view and respond to it.
Since there is no support or resistance point when the ATH is updated, the Fibonacci ratio can be appropriately utilized.
However, although the Fibonacci ratio is useful for chart analysis, it is ambiguous to use it as a support or resistance.
This is because the user must directly select the important selection points required to generate Fibonacci.
Therefore, since it is expressed differently depending on how the user specifies the selection points, it can be useful for chart analysis, but it can be seen as ambiguous for use in trading strategies.
1st: 44234.54
2nd: 61383.23
3rd: 89126.41
101875.70-106275.10 (when overshooting)
4th: 134018.28
151166.97-157451.83 (when overshooting)
5th: 178910.15
-----------------

ETHUSD: Replicating Bitcoin's past Cycle to $14,000?Ethereum is almost oversold on 1D and straight bearish on its 1W technical outlook (RSI = 41.942, MACD = 3.920, ADX = 30.130) struggling to find bullish momentum and get detached from the consolidation it's been inside since March 2024. The whole Cycle however is technically much like Bitcoin's 2018-2021 Cycle. As the 1W MA200-1M MA50 zone supported Bitcoin on the Cycle bottom and later during the COVID crash, it is doing so on Ethereum for the past 2 years and most recently this week. If it holds, we may see a massive rally starting to the 1.618 Fibonacci extension (TP = 14,000).
## If you like our free content follow our profile to get more daily ideas. ##
## Comments and likes are greatly appreciated. ##

ethbtc bottom is inBINANCE:ETHBTC pair is above the trend line on a linear scale, where the Federal Reserve started QE in August 2019!

adin ross has no ideabeen following the chart for a while now its pretty constant with pivoting at major structured areas or just crowed price points. i keep it simple were bullish

ETH Long Spot OpportunityMarket Context:
ETH has retraced into a major support zone, presenting a high-probability long setup. If the price stabilizes and confirms support in this range, we expect a move toward key resistance levels.
Trade Details:
Entry Zone: $2,180 - $2,400
Take Profit Targets:
$2,700 - $3,050
$3,750 - $4,100
Stop Loss: Just below $2,000
This setup provides a favorable risk-to-reward ratio, targeting higher timeframe bullish continuation. Stick to the plan and manage risk accordingly! 📈🔥
ETH MAX PAIN#Ethereum Maximum is the real value that turns pain into maximum gain!
2016-2017 x 2024-2025

ETH Holding Strong – A Massive Move Ahead?Ethereum has shown strong respect for key price levels, particularly around $2.1K and $2.8K. Despite market volatility, the $2.1K support has held well, reinforcing its significance in Ethereum’s price structure. These levels have consistently influenced price action throughout the year, acting as crucial areas for buyers and sellers. Holding above them signals strength while breaking below could indicate weakness.
Currently, ETH is trading near the $2.8K resistance, a critical level for further upward movement. A decisive breakout above this zone would improve the higher timeframe outlook, potentially opening the door for a stronger rally. The faster Ethereum clears this resistance, the more bullish the market structure remains, increasing the likelihood of sustained momentum toward higher levels.
