ETH Daily Analysis 7th Ausgust 2021As the chart tell us that ETH already break out 1767-2300 range zone
Eth also break out strong resistance 2860 which formed on May -June 2021
Clearly, Eth is heading to strong resistance around 3200-3300 which would confirm strong uptrend to 4100 zone.
Senario 1: Eth fail resistance 3200-3300 retest 2860 support
Senario 2: Break 3200-3300 , confirm strong uptrend, heading to 4100 zone
Ethanalysis

ETHUSDT Pattern, July 29A double bottom is happening now on ETH chart. After it breaks the neckline then you can see the price target on chart.
I wanna mention that price has broken 200MA (Bullish).

ETH set up for a PullbackWe may begin to see a nice Pullback as we move through the night into Friday morning.
What we need to watch for is if we are going to do a Touch & Go off of the 200 EMA, we have been creating Higher Highs & Higher Lows which is a great indication for another Uptrend.
We may cross the EMA with a Retest then a large pullback too the $2,400 range.

Ethereum Dominance set for new highs!!Ethereums been outperforming BTC recently with ETH's dominance starting to climb back up, i think we can easily expect new yearly highs for ethereums dominance based on how fast it is growing plus the soon to be deflationary asset will grow demand wise, we had a yearly high recently of about 21% and i think we are bound to make our way upto atleast the 22% level. We recently had a very nice breakout gaining lots of momentum but we do seem to be hitting some longer term resistance/support from back in 2017, and of course we will have lighter resistance coming from this years high. Looking at the bollinger bands we are continuing to fly up that top band with little to no sign of slowing down, we could continue climbing as the days go on, especially if we can smash through this resistance and hold it for a daily close. Checking out the MACD once again we are looking super bullish with no sign of slowing down, we see very big separation within the MA's the blue has completely shot away from the orange and we are now headed just about straight up! Histogram continues to look solid as we keep seeing growing green bars show that we definitely still have momentum, we look very very far away from a bearish cross here and overall i am very bullish on ETH short and especially long term, i think my guess at 22% dominance was a little bit conservative! Not financial advice just my opinion!

BTC money flowing into ETH!!Ethereum has been showing very high strength recently pumping even while BTC falls in price, and as BTC dominance gets lower and lower the altcoins and ETH will start to really explode! we have blew past many key areas recently like the pivot point, the first level of resistance and now the 0.2 FIB level, if we can manage to hold the 0.2 FIB for daily close tonight we are looking hella hella bullish! we have been scaling up the top of the bollinger band, we could see a continuation and keep shooting up more and more, i feel like we might see a little break around this 0.2 FIB maybe just a day to build support and cooloff before flying back up. Or theres the case where we keep on moving up, looking at the wave trend we are not really even close to the sell or the top zone we still have quite some room to run up still, also we have seen before it doesn't always come down right away there is times where it hangs up in the top zone for a little bit, either way i am super bullish on ethereum especially after todays london and eip 1559 upgrade! ETH is being burned now all day everyday anytime there is an eth transaction! think about that, supply is going to start shrinking and the demand is already high and will most likely get higher and higher! Not financial advice just my opinion!

ETH/USDTBINANCE:ETHUSDT
If we look at the chart we can see that the trend from the price of 1800
It has moved upwards by 58%
Up to 0.786 and after breaking the level, make a small correction
have given. And now you see that the pressure of buyers has decreased and
The price is falling and the level of 0.786 is a strong support for the trend
And in case of failure of Fibonacci level, use position shorts

ETH BIG RUN ON THE WAY??!ETH has been performing amazing against BTC recently with a beautiful breakout of the descending triangle, also we have well passed the bullish pivot point a few days ago and we continue to hold it for the overall trend reversal. We are just beginning to take a ride up the top bollinger band with the past couple candles hugging that top band, if we continue to do this i think flying right through the 0.2 FIB is very very likely! looking at the RSI we are just about into the top overbought zone but starting to curl downwards a little bit, the only key thing we have to watch here is if we are able to continue to hold the midline or 50. point if we can continue to hold here we will be back into a confirmed uptrend! Looking at the wave trend oscillator we are looking very bullish actually we have just passed the mid point and our wave is showing no signs of slowing down, we could see a wave top even at the top of the zone before coming back down. Lots of BTC money flowing into ethereum for in my opinion the highly anticipated London hard fork upgrade and EIP 1559! Overall very bullish on ETH and DEFI right now with arguably the biggest crypto event in the world starting tomorrow (smartcon) we are likely going to see lots of good hype around ETH and DEFI in the coming weeks! Not financial advice just my opinion!


Ethereum could take a hit against BTCEthereum has been trading perfectly in this descending triangle and we have failed to breakout the top many times and now we could indeed be in for a fall out of the bottom of the triangle, from what it looks like there isn't a lot to worry about and this could be a potential fakeout to the downside, as we have many many supports below us this could be a tactic to get weak hands out of ethereum. We notice on the bollinger bands we are tending to go downwards towards that bottom band which can definitely be a slippery slope as if we do continue to ride the bottom band there is a high chance we will see a drop of some sort, i figure the lowest we could see due to all of the surrounding supports is about 0.05 or the 0.6 FIB level. Taking a look at the pivot points we do have support above the 0.6 FIB level but what im interested in for the longer look is that bullish pivot point, if price action can make it upto this level we will be considered in a bullish reversal which is definitely key but that'll be talked about in a later TA as this levels a little out of reach for now, hope im wrong though lmao! Now something that goes hand and hand with the bearish looking bollinger bands is the bearish looking macd where we just recently had a bearish cross, we are only 2 red bars in to this macd cycle and i doubt we will see a green bar say tomorrow, so we could be looking at a maybe 5 day bearish trend on the MACD but there is always the chance of a reversal, there isn't much separation within the MA's so we are looking pretty okay there but we need to see some bull momentum to bring that blue MA back ontop of the orange or like i said we could see a little downside here. keep in mind there is the chance of a fakeout to the downside where we could exit the bottom of the descending triangle but then shoot back up liquidating short positions and getting weak hands out of the market. Not financial advice just my opinion!

ETH about to explode!!!Ethereum is looking hella bullish right now we have had a nice run up all the way to our current resistance level at 2324$ (USD) we could see a rejection today but i think we are bound to break through here and continue our run up in the coming days, we have easily regained the 50 day SMA now well above it which will now act as support aswell as the 200 day SMA which is absolutely huge for ETH! Now we are looking at taking back the 100 day SMA which sits a little bit above us right now but once we continue our run i think taking this SMA back is inevitable! We had a beautiful break out of the top of this descending triangle on the 13th try if we count wicks lol, we could have a bit of a cooloff now because of the repeated green candles but i don't think we should worry we have lots and lots of underneath support. Looking at the Bollinger bands just like i said with xrp we are right on that top band and we could definitely see a big run up due to this, either tomorrow or in the coming days im thinking. Realistically this should give us way more than enough momentum to shoot up and blast right through the 100 day SMA turning it into again support. We recently had a very nice bullish cross on the daily MACD and now we are starting to see some nice separation within the bands which is always a positive sign and for sure reduces the chances of us having a soon bearish cross, we want to continue to see the blue MA take off away from the orange MA, also to keep seeing bigger or equal bars on the histogram, looking at it compared to our last bullish cross we realistically have many more green days to come histogram wise and if we see a similar cycle this time around, overall very bullish on Ethereum and altcoins as we are starting to see the reversal back into this bullish cycle! Not financial advice just my opinion!

Will it be bearish ?BINANCE:ETHUSDT
Is it headed for the highest price in 2018 ?
DISCLAIMER :
What I publish is my analysis for your overview. At your own risk.

Bearish PatternBINANCE:ETHUSDT
Is it headed for the highest price in 2018 ?
DISCLAIMER :
What I publish is my analysis for your overview. At your own risk.

MUST HOLD LEVEL FOR ETHEREUM!Eth has been getting dragged down with the market just like everything else and we are now at a pretty crucial level of support for ETH and if we dont hold this for our daily close there is a good chance we see a fall. We have broken out to the downside of this descending triangle and i have outlined the key pivot points that are in play, green being support, yellow as the pivot point and red as the resistances. We are holding up right on this first green support and we need to hold this level for daily close or the next support we have is the 0.7 FIB level. Now this is a very interesting situation because we are seeing some bearish indicators but to me the RSI is looking like we are due for a reversal, we are just about in the oversold area like a hair away and we could potentially see a fakeout with ETH, a fakeout to the downside of the descending triangle but then could see a recovery back up if this support is held and if our RSI starts to come back up, so this is definitely a hard one to judge on where we are headed, keep in mind if BTC keeps falling our indicators for the time being don't really mean anything. Now the bollinger bands we got to be very careful with as we are starting to ride the bottom band and you guys know what that means... a more than likely fall in price unless we see a recovery and some bull momentum. For sure an important chart to watch for daily close tonight! Not financial advice just my opinion!

ETHUSD July 18, 2021Ethereum's situation is much better than Bitcoin that's for sure because ETH price is still moving in an ascending channel
Right now price is in the bottom of this channel and it has support, It's important to keep it.
Let's not forget, ETH is the mother of altcoins.


ethETH possible double bottom to $1700, but here on 4h chart looks like Waves 12345 appear to be complete of possible to get a little more downside, I maintain my bullish bias here on ETH even with the pressure coming from H4 chart

ETH potential 9% drop looming!Ethereum against BTC has been pretty strong wee are trending slightly down but more of sideways movement within this descending wedge. i think that we could see a little more downside here until we start heading back up, for a few different reasons the first being if you look at my last BTC TA i think we are on the verge of a pullback in price and that will definitely shake up the market a little bit. looking at the coppock curve which isnt talked about very often is pretty accurate for finding market bottoms and reversals, so we see our wave is currently halfway to the bottom point, this indicator doesn't really ever ake any jagged turns or reversals and it smoothly transitions from bearish to bullish over time, we have a little trend line going for the wave bottoms and i think we are going to catch this support again before then transitioning back upwards. We recently got a bearish cross on the MACD and we notice some further separation in the MA's right off the bat and this shows we are getting further and further away from getting that bullish cross in the next phase, our histogram aswell has just started printing a few red bars and they are slightly getting bigger each time, we want to see these bars start to level off and ultimately start to reduce in size. Looking at the bollinger bands we are in an okay spot nothing to worry about here for now, the only thing is that price action is below the midline and we usually see our candles getting held down and below this level. Not financial advice just my opinion!

For Education Purpose ''Not Fınancıal Advise''The shown daily graph represents the hidden negative disharmony. It means that we may expect a slight decrease
TP1:1942.47
TP2:1920.77
TP3:1862.04
TP4:1832.07
TP4:1790.42
Good Luck.


Ethereum head and shoulderBINANCE:ETHUSDT
As we go to the bottom time frame you can see a pattern
Head and shoulders are forming and for that
The pattern can complete itself must the neckline
Broken upwards in addition to completing the pattern
Confirmation is also for the price increase

Ethereum head and shoulderBINANCE:ETHUSDT
As we go to the bottom time frame you can see a pattern
Head and shoulders are forming and for that
The pattern can complete itself must the neckline
Broken upwards in addition to completing the pattern
Confirmation is also for the price increase


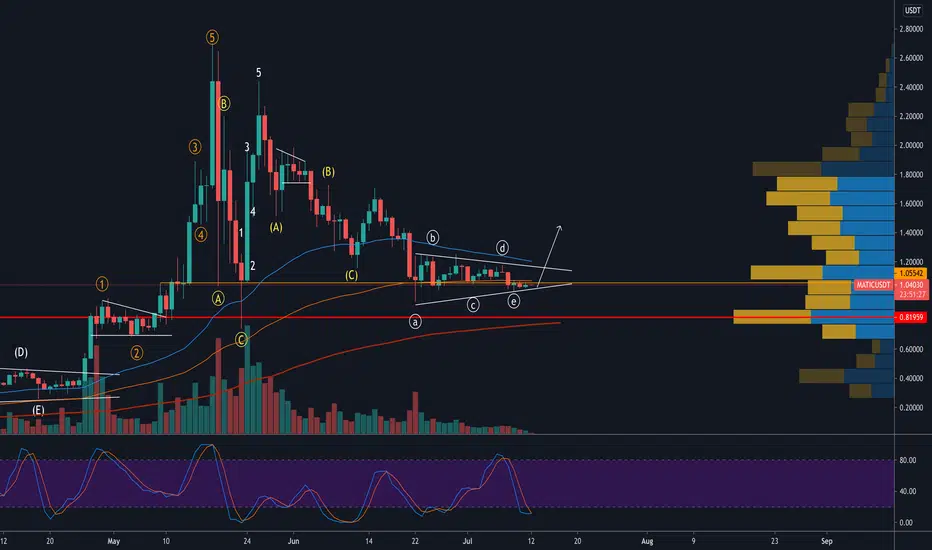
MATICMATIC i think the crash has been canceled here and would expect MATIC to turn here out of the Very complex correction since late May. Confirmation would be a break of top TL with volume around $1.20