ETH/BTC Poised for a Breakout: A Technical and Fundamental ViewA confluence of technical signals on the weekly ETH/BTC chart, coupled with significant fundamental developments for both Ethereum and Bitcoin, suggests a potential upward move for the pairing in the coming weeks.
Technical Analysis (TA)
The weekly chart for ETH/BTC on Binance reveals a potential bottoming formation after a prolonged downtrend. The price has been consolidating in recent months, and the latest weekly candle shows a strong bullish engulfing pattern, indicating a possible shift in momentum.
Key levels to watch, as identified on the chart, are:
Immediate Resistance: 0.02546 BTC. A decisive close above this level on the weekly timeframe would be the first confirmation of a potential trend reversal.
Further Resistance: 0.02929 BTC and 0.03451 BTC. These represent subsequent hurdles for the bulls to overcome.
Take Profit Target: 0.038 BTC. This level is marked as the ultimate target for this potential upward move.
Timeframe: The analysis on the chart suggests a maximum timeframe of 5 weeks for this trade idea to play out.
Moving Averages: The price is currently trading below the MA Ribbon (SMA, 20, 50, 100, 200), which could act as dynamic resistance. A break above this ribbon would further strengthen the bullish case.
Fundamental Analysis (FA)
The current market environment in July 2025 provides several fundamental catalysts that could impact the ETH/BTC ratio.
For Ethereum (ETH):
Growing Institutional Interest: Ethereum ETFs have seen significant inflows, with over $890 million in July 2025 alone, driven by increasing confidence from institutional investors. Asset managers like BlackRock are accumulating substantial amounts of ETH, reducing the available supply on the market.
Network Upgrades: The upcoming "Pectra" upgrade, which includes Proto-Danksharding (EIP-4844), is anticipated in Q3 or early Q4 2025. This is expected to significantly reduce Layer-2 transaction costs and improve scalability, further enhancing the utility of the Ethereum network. The earlier Pectra upgrade in 2025 already introduced user-friendly features like smart accounts.
Ecosystem Growth: The Linea project, a prominent player in Ethereum's DeFi ecosystem, has a Token Generation Event (TGE) scheduled for July 2025, which is expected to drive market shifts. The overall DeFi ecosystem on Ethereum is showing signs of revitalization.
For Bitcoin (BTC):
Strong Institutional Demand: Similar to Ethereum, Bitcoin is experiencing a wave of institutional adoption, with significant inflows into spot Bitcoin ETFs. Public companies are now holding BTC in their treasuries, and major financial institutions view it as a strategic asset.
New All-Time Highs: Bitcoin has recently surged to new all-time highs, breaking key trendlines and signaling a new bullish era. This strong performance often has a spillover effect on the broader crypto market, including altcoins like Ethereum.
Favorable Macro Environment: Some analysts point to a looser monetary policy from global central banks and inflation concerns as factors boosting demand for hard assets like Bitcoin.
ETH vs. BTC Dynamics:
While Bitcoin's price has seen impressive gains, some analysts believe Ethereum has room to catch up. The ETH/BTC ratio is a key metric for gauging the relative strength of the two leading cryptocurrencies. An upward trend in the ETH/BTC chart, as suggested by the technical analysis, would indicate that Ethereum is outperforming Bitcoin. The performance of ETH relative to Bitcoin is often seen as a barometer for the broader altcoin market.
My point of view
The technical setup on the ETH/BTC weekly chart presents a compelling case for a potential bullish reversal in the short to medium term. This is supported by strong fundamental developments within the Ethereum ecosystem, including significant institutional inflows and major network upgrades. While Bitcoin's own bullish momentum is a factor to consider, the potential for Ethereum to outperform in the coming weeks, as indicated by the provided chart analysis, offers an interesting trading opportunity. Traders should closely monitor the identified resistance levels for confirmation of a breakout.
ETHBTC

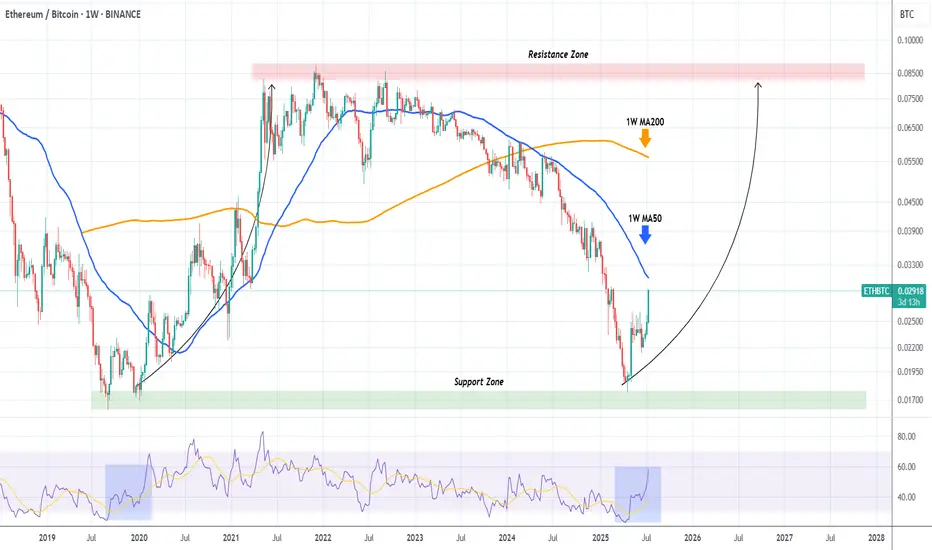
ETHBTC shows that Ethereum will outperform Bitcoin MASSIVELY!The ETHBTC pair has been rebounding hyper aggressively after the April 21 2025 Low on the 6-year Support Zone, and is now facing it's most important test, the 1W MA50 (blue trend-line).
This trend-line has been its Resistance since basically March 13 2023, so if broken, it will be a massive bullish break-out signal.
In fact during the 2020 - 2021 Bullish Leg, once the price broke above the 1W MA50, the market got the final confirmation of the upcoming long-term rally.
We expect Ethereum to outperform Bitcoin for the rest of the year at least.
-------------------------------------------------------------------------------
** Please LIKE 👍, FOLLOW ✅, SHARE 🙌 and COMMENT ✍ if you enjoy this idea! Also share your ideas and charts in the comments section below! This is best way to keep it relevant, support us, keep the content here free and allow the idea to reach as many people as possible. **
-------------------------------------------------------------------------------
💸💸💸💸💸💸
👇 👇 👇 👇 👇 👇
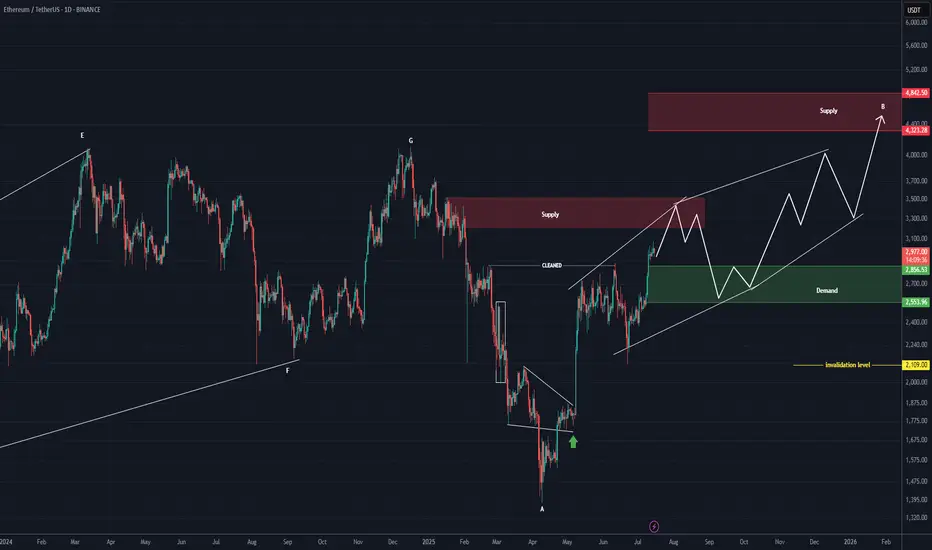
ETHEREUM Roara Map (1D)The previous phase of Ethereum appears to have been a completed diametric, and now it seems we are in a flat pattern.
It can be said that we are currently in wave B of the flat, which itself appears to be a diametric.
This diametric could even extend to the 4300–4800 range.
The green zone is the rebuy area.
A daily candle close below the invalidation level would invalidate this analysis.
For risk management, please don't forget stop loss and capital management
Comment if you have any questions
Thank You
Ethereum Breakout and Liquidations – A Lesson in Bear Traps and 📚💥 Ethereum Breakout and Liquidations – A Lesson in Bear Traps and Risk Management 🧠📈
Today, July 16th, Ethereum gave us a real-time masterclass in market psychology and risk management.
Let’s start with the facts:
📊 Liquidation Data
🔻 $36.34M in long liquidations
🔺 $86.02M in short liquidations
💣 Total ETH liquidations: $122.36M (data mentioned on video might differ, i made a small mistake)
🌐 Across crypto: $351M liquidated (more shorts than longs)
This imbalance tells us one thing: a bear trap played out, and it played out hard.
🧠 Educational Takeaways
1. Bear Traps Are Real — and Expensive
A bear trap occurs when the market appears bearish, drawing in short sellers — only to violently reverse upward. Today’s Ethereum move was a textbook example. If you’ve been following my analysis, we discussed the regression lines, divergences, and structure that all warned against going short at support.
2. Open Interest and Sentiment Signals
Open interest has been declining — which means fewer speculative positions. That often creates space for a real, organic move, not one fueled by overleveraged noise.
3. Spot vs. Leverage – Risk Control First
Leverage isn’t the enemy — unmanaged leverage is. I personally use a dedicated high-risk account to trade fast setups. This keeps my core capital untouched and my psychology stable.
✅ Risk is defined before the trade.
✅ Entries are structured like bullets — small, multiple attempts.
4. The Mental Game is the Real Game
Trading isn’t just technical. It’s deeply psychological. Whether you’re trading Ethereum, Bitcoin, or altcoins like AVAX and XRP, emotions must be managed before capital is deployed.
5. Like-Minded Community = Sharper Edge
My best trades and insights often come from conversations with trusted, sharp minds in this space. Surrounding yourself with serious traders can be the difference between evolving — and evaporating. To my brother Vlatko (met on Tradingview, been hanging around online ever since, met in person once, now a true friend that we frequently disagree but always agree to respect and empower each other = The power of our community here on TV!)
Final Word:
When markets move fast, lessons appear even faster.
Study the traps. Respect the levels. Structure your risk.
And above all: trade with a plan that allows joy.
One Love,
The FXPROFESSOR 💙
Disclosure: I am happy to be part of the Trade Nation's Influencer program and receive a monthly fee for using their TradingView charts in my analysis. Awesome broker, where the trader really comes first! 🌟🤝📈

ETH - Confirmed target is 4100- After successfully breakout from the major resistance price is heading towards the next resistance line.
- From the previous all time high, we have a clear resistance around 4100 range.
- We can expect this bullish trend to continue easily and reach the next resistance around 4100.
Stay tuned for more updates
Cheers
GreenCrypto

ETH – $7k Target in Sight
7k incoming on CRYPTOCAP:ETH —timing is up in the air, but the chart looks stellar.
A decisive break above $3,500 should kick off aggressive expansion.
Meanwhile, ETHBTC has been rallying hard off its lows; I’m eyeing a 50% gain against BTC over the next 2–3 months.
Holding through this strength makes sense—it’s been a long time since we’ve seen these setups.

ETH New Analysis (12H)This analysis is an update of the analysis you see in the "Related publications" section
The previous analysis is still valid | its timeframe is higher, but in this update, we've moved to the lower timeframes.
It seems a valid bottom has been formed on Ethereum, and we may not see a lower low, provided that the price doesn't move higher first but instead drops directly into our support zone. If that happens, the price could potentially move upward from there.
Ethereum seems to be searching for a support zone to reach higher levels. The marked area could potentially launch the price upward.
In this analysis, the support zone, targets, and invalidation level have been updated.
For risk management, please don't forget stop loss and capital management
When we reach the first target, save some profit and then change the stop to entry
Comment if you have any questions
Thank You

Ethereum & monthly 20MAEthereum is gaining strength and will likely break above the monthly 20 MA. Will it maintain this momentum by month's end and remain bullish in the coming months?
Good luck HODLRS ✌️🤞

ETHBTC Opportunity Buy: Major 2025 AltcoinSeason & Bull MarketThis is the big one and the good one. ETHBTC was bearish since December 2021 but this cycle finally came to an end in April this year. After the initial bullish breakout and higher low we can clearly see some bullish action developing; three consecutive weeks green. The bullish bias is now confirmed. It is still early.
We are looking at 200% potential. The "back to baseline" target. This is a price range where ETHBTC traded sideways as part of a distribution phase for more than two years. This is a must-to-be-tested resistance zone and thus opens up a sure 200% profits potential for this newly developing bullish wave.
Ethereum's ETFs are coming, Bitcoin already has its ETFs. This can mean Ethereum outperforming Bitcoin, and many altcoins, in so many ways. This also opens up the potential for a new all-time high on this pair.
The same sequence of 'low-higher low' happened in the last bull market. ETHBTC hit bottom in September 2019 then produced a higher low and this signaled the start of a major, long-term 447% rise. The conditions are similar now but the rise will be faster.
We have two main targets for the all-time high in late 2025 or early 2026.
1) 0.13207. With 442% profits potential from current price.
2) 0.20278. With 733% profits potential.
The entire bullish cycle for this pair can unravel within 4-6 months. If it becomes extended, it can last one year or longer. Both scenarios are possible.
It is 100% certain that ETHBTC will go on a major bullish cycle together with the rest of the altcoins market. Bitcoin will also grow.
Thanks a lot for your continued support.
If you are bullish on Crypto, comment below.
Namaste.

ETH/BTCPrice is following an AMD structure with a liquidity sweep to the downside. For full confirmation of the setup, a daily FVG inversion is required.
Watching closely — confirmation will unlock further directional bias.

ETH/USDT#ETH
The price is moving within a descending channel on the 1-hour frame and is expected to break and continue upward.
We have a trend to stabilize above the 100 moving average once again.
We have a downtrend on the RSI indicator that supports the upward break.
We have a support area at the lower limit of the channel at 2440, acting as strong support from which the price can rebound.
We have a major support area in green that pushed the price upward at 2440.
Entry price: 2500.
First target: 2545.
Second target: 2539.
Third target: 2641.
To manage risk, don't forget stop loss and capital management.
When you reach the first target, save some profits and then change your stop order to an entry order.
For inquiries, please comment.
Thank you.

ETHBTCTick tock
This is the most unlooked at chart in crypto because there is nothing bullish about it but eths fundamentals are insanely bullish
I'm a huge eth bull and hate looking at this chart
It will run it back at some point but its clearly not in a rush and lesser understood on the institutional finance side of the market.

Ethereum - ETH - Heading towards the CME Gap - 3200 Target+ After a significant crash, Ethereum has shown a strong recovery.
+ A large CME gap exists between $2,880 and $3,270.
+ Historically, 90% of CME gaps tend to get filled sooner or later.
+ Current price action suggests Ethereum is heading directly toward this gap.
+ High probability that the CME gap will be filled during this move.
+ Next target for ETH: $3,200.
Stay tuned for more updates.
Cheers,
GreenCrypto

ETHBTC: Ethereum to outperform massively Bitcoin.ETHBTC turned neutral again on its 1D technical outlook (RSI = 41.566, MACD = -0.00033, ADX = 21.423) as in the past 4 weeks it failed to extend the rebound of the April 14th bottom. Ahead of a MACD Bullish Cross, a little further correction to make a Double Bottom (DB) would make the pattern more bullish, much like the December 9th 2019 DB. That was the start of Ethereum's bull season. Similarly, we expect it to start outperforming Bitcoin massively and approach the R1 level (TP = 0.0800).
## If you like our free content follow our profile to get more daily ideas. ##
## Comments and likes are greatly appreciated. ##

Ethereum is still bullish!#ETH
The price is moving within a descending channel on the 30-minute frame and is expected to break and continue upward.
We have a trend to stabilize above the 100 moving average once again.
We have a downtrend on the RSI indicator that supports the upward move with a breakout.
We have a support area at the lower boundary of the channel at 2450, acting as strong support from which the price can rebound.
We have a major support area in green that pushed the price upward at 2400.
Entry price: 2460.
First target: 2485.
Second target: 2510.
Third target: 2543.
To manage risk, don't forget stop loss and capital management.
When you reach the first target, save some profits and then change your stop order to an entry order.
For inquiries, please comment.
Thank you.

#ETH/USDT#ETH
The price is moving within a descending channel on the 1-hour frame, adhering well to it, and is on its way to breaking it strongly upwards and retesting it.
We are seeing a rebound from the lower boundary of the descending channel, which is support at 2427.
We have a downtrend on the RSI indicator that is about to break and retest, which supports the upward trend.
We are looking for stability above the 100 moving average.
Entry price: 2447
First target: 2476
Second target: 2500
Third target: 2533

$ETH & $ETHBTCBINANCE:ETHBTC and CRYPTOCAP:ETH
BINANCE:ETHBTC is rejecting at the 0.382 fibs level.
Technically, any coin hitting 0.236 is showing weakness.
Another retest is fine, but we don't want to see 0.236 fib level break
For CRYPTOCAP:ETH , price needs to accept above POC and hold 2.5k. If not, a move back to 2k - 1.8k is likely

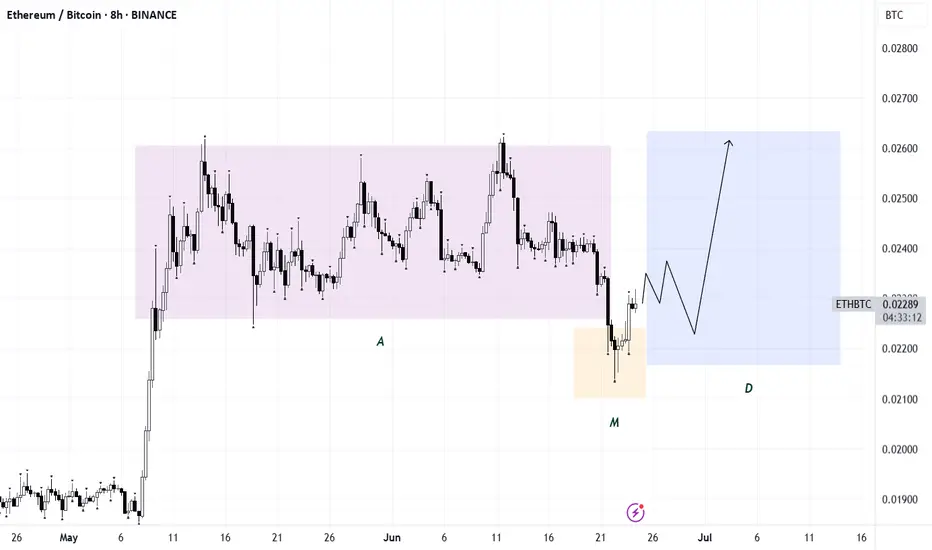
Decision Phase in ETHBTCI would like to offer an idea about ETHBTC. Although it showed a nice bottom formation with its last breakout move, I think it is at a very critical point with the horizontal movement and downward break that followed. If you look at the ETH chart ( ) , you can see that it corrected almost 60% of its sharp rise and gave a nice test to the red box and went up. It is currently trying to stay within its old range. ETHBTC, on the other hand, is making a downward move. It would not be wrong to say that it has evolved into an structure as if it made a downward retest, despite having made a similar move.
I have 3 plans for this process:
Plan 1: The price retesting the 0.026 levels after entering the old range and throwing it above this area with a slow and small pullback. I will consider the last downward move as manipulation and take a position accordingly.
Plan 2: Defining its last move as a retest to the range it broke down, continuing its decline and first coming back to the 0.019 levels. Maybe a decline to the green box zone below after the reaction there.
Plan 3: After making the rise in plan 1, testing the 0.021 levels for the last time by pulling back more and starting a rapid rise from there. Frankly, although it is a bit difficult, such a move seems good to me since seeing sharp movements and volume in the bottom formation will increase the opinion that the rate is the bottom.
This is the roadmap I will follow in general. I think these movements can be until the first week of July. I hope that the next 10 days will give a good idea of how we will spend the summer months. It should not move horizontally in these areas anymore and I don't think it will. I don't care about drawing both up and down and then saying "aha" and being right. If my goal is not to make money, being right is useless. If there is a movement that is suitable for one of the movements I draw, I want to take a position and turn it into reality.
Good day everyone.

ETH/BTCPotential AMD setup forming. Ideally, a distribution phase unfolds before July 9th — which could trigger a rotation into altcoins.
As always, confirmation is key for any entry. No confirmation — no trade.
ETH update 9.06.2025Hello everyone, many of you asked me to publish my vision for ETH.
Here you go!
I believe that the previous impulse movement was only the first upward movement, and now we are in a sideways correction movement — call it what you will, but the fact is that the exit from this flat will be upward.
1. End of the year
2. ETH is accumulating on the Onchain
3. Liquidity overflow from BTC can be seen on the ETHBTC chart, and the overflow began at the very bottom
4. What else can large conservative players accumulate?
5. We are going after liquidity from above and should break 4100 by September
Best Regards EXCAVO

$ETHBTC failed multiyear breakout. To understand the investor positioning in the Crypto markets we must understand the CRYPTOCAP:BTC values of the Altcoins. In terms of USD the valuations might go up but if we look at the pair trade of the Altcoins relative to CRYPTOCAP:BTC we can relay understand the flow among the various Cryptocurrencies.
Let’s understand the relationship between CRYPTOCAP:BTC and CRYPTOCAP:ETH , the second largest Crypto and the largest one in the CRYPTOCAP:TOTAL2 index. Below we have plotted a multiple year BINANCE:ETHBTC chart for reference. IN the previous cycle the BINANCE:ETHBTC char bottomed @ 0.02 and then BINANCE:ETHBTC had a bull run where the chart topped out on 0.09. This was during the rush of Crypto Punks and the likes which were traded using $ETH. At the same time the RSI of BINANCE:ETHBTC also peaked at 90. Since then, it has been bleeding slowly.
The BINANCE:ETHBTC has suffered a series of lower lows and lower highs forming a bearish pattern. The RSI also never regained in strength and has also been forming lower highs and lower lows. This April the BINANCE:ETHBTC touched the last cycle low of 0.02. Since then, it has tried a bounce back but failed again at 0.025. My prediction is that the BINANCE:ETHBTC will struggle to break out of the 0.236 Fib retracement levels plotted on the previous cycles Highs to the Lows.
Verdict : BINANCE:ETHBTC looks bearish on medium to long term. Short term bounce back possible to 0.0375.

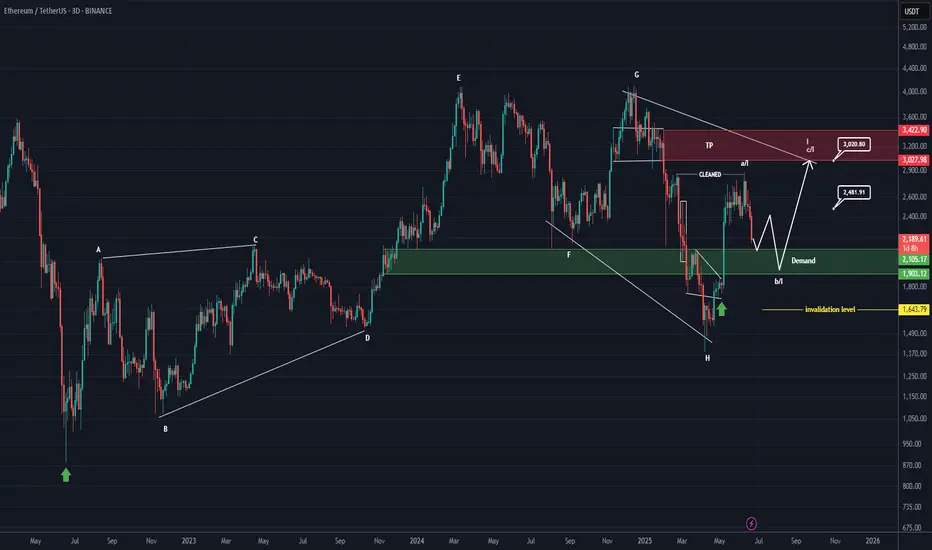
ETHEREUM Analysis (3D)First of all, pay close attention to the timeframe | it's a higher timeframe.
From the point where we placed the green arrow on the chart, Ethereum appears to have entered a bullish phase | specifically, a symmetrical pattern.
It currently seems to be in wave I of this symmetrical structure, which is the final wave. Wave I itself appears to be composed of three parts (ABC). At the moment, Ethereum seems to be in wave b of wave I.
We expect wave b of I to complete within the green zone, after which the price would move into wave c of I.
The price seems inclined to complete wave b of I near the bottom of the green zone.
Targets are marked on the chart.
In the green zone, it’s no longer reasonable to look for Sell/Short positions, especially when the price is approaching the bottom of the green area.
A weekly candle close below the green zone would invalidate this analysis.
For risk management, please don't forget stop loss and capital management
When we reach the first target, save some profit and then change the stop to entry
Comment if you have any questions
Thank You
ETH NEW UPDATE (8H)This analysis is an update of the analysis you see in the "Related publications" section
After the pump and hitting the red zone, it got rejected.
It's better not to open a short position on Ethereum, as its dominance appears bullish | which means it might be resilient against a potential drop.
The closing of a daily candle above the invalidation level will invalidate this analysis.
For risk management, please don't forget stop loss and capital management
Comment if you have any questions
Thank You
