ETHBTC

Is the rise over?Bitcoin worked three corrective bullish compound waves, and in the last compound third wave, it formed an expanding Diagonal shape, which is a form that rarely happens to be broad, and executed five overlapping waves, and it is about to end and begin to descend with a downward motive wave in the form of internal waves.. Let us see how true this is. Analysis as new data emerge

ETH CAN MAKE A CORRECTIONHi, dear traders. how are you ? Today we have a viewpoint to SELL/SHORT the ETH symbol.
For risk management, please don't forget stop loss and capital management
When we reach the first target, save some profit and then change the stop to entry
Comment if you have any questions
Thank You

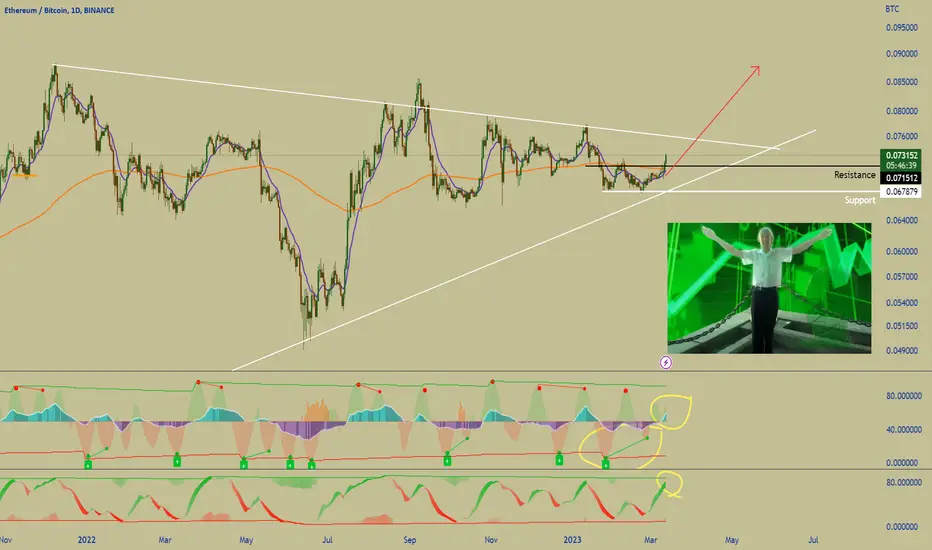
ETHBTC plan for AltcoinsSquiggles on ETHBTC chart for accumulating strong altcoins with longterm hold in mind.

💥 ETHUSD 4H-TIMEFRAME ANALYSIS💥 ETHUSD 4H-TIMEFRAME ANALYSIS
💗Hello ladies and gentlemen
This is my new idea for 💥ETHUSDT ETHBUSD
I hope my idea is clear
Support me by like and share thank you
Stay Safe💯💲💲💲
Good luck💰😍

The key is whether the price can sustain the rise above 1879.61Hello?
Traders, welcome.
If you "Follow", you can always get new information quickly.
Please also click "Boost".
Have a good day.
-------------------------------------
(ETHBTC 1W Chart)
The question is whether the price can sustain the move above 0.072484.
To do so, we need to see if it can rise above 0.067660.
-----------------------------------------
(ETHUSDT chart)
-------------------------------------------
(1W chart)
The key is whether the price can be maintained above the M-Signal indicator on the 1M chart.
(1D chart)
The question is whether it can rise above 1879.61.
If price holds above 1879.61, I would expect a move towards 2531.05.
However, there is a possibility of resistance around 2196.53, so you need to think about countermeasures against this.
If it fails to rise, you should check for support around 1340.12-1460.54.
The 1M chart's M-Signal, or MS-Signal indicator, is an indicator created to see trends.
Therefore, holding the price above the MS-Signal indicator indicates a strong uptrend.
The HA-Low and HA-High indicators are created for trading.
Therefore, being supported by the HA-Low and HA-High indicators means that buying is possible.
A decline from the HA-Low indicator can be interpreted as a possibility of renewing the recent low.
Being supported by the HA-High indicator can be interpreted as a possibility of renewing the recent high.
If you are resisted by the HA-High indicator and fall, there is a possibility of touching the HA-Low indicator, so you need to think about countermeasures.
The 1879.61 point is the previous HA-High indicator point on the 1M chart.
-------------------------------------------------- -------------------------------------------
** All descriptions are for reference only and do not guarantee profit or loss in investment.
** Even if you know other people's know-how, it takes a considerable period of time to make it your own.
** This is a chart created with my know-how.
---------------------------------

Why to follow 🌉Arbitrum🌉 (ARB)❗️❓As I have said before, I evaluate crypto projects based on various factors.👇
I have already introduced each of these factors with a brief explanation, so today, I will be looking at Arbitrum (ARB) , which will launch on Binance exchange on March 23rd. That is tomorrow.
🔥Let’s get into it:
🔰🔰🔰🔰🔰🔰
✅ Projects Goals : Technically, Arbitrum is an optimistic roll-up on Ethereum. To put it more simply, it is a suite of scaling solutions that provides faster speeds at a significantly
lower cost, with the same level of security as Ethereum. Since Ethereum users were very inconvenient during the last bull run due to the ridiculously high gas fees they had to pay, Arbitrum and other Layer2️⃣ scaling solutions became extremely necessary for the growth of user adoption in DeFi. That is why I have scored Arbitrum’s goals 10/10.
✅ Founders : Arbitrum is built by a company called Offchain Labs. Ed Felten, Steven Goldfeder, and Harry Kalodner are the co-founders of OffChain Labs🔬 and hence Arbitrum. Ed Felten is a computer science and public affairs professor at Princeton University. Steven Goldfeder has received a Ph.D. in philosophy from Princeton University, where he also worked at the intersection of cryptography and cryptocurrencies. Harry Kalodner also holds a Ph.D. in Computer Science from Princeton University. The co-founders' academic level and work experience made me score a 10/10 for the Arbitrum founders.
✅ Github : Since the founders are experienced computer scientists, users who are not tech-savvy don’t have to worry about Arbitrum’s code. The team is constantly working on updates to improve the Arbitrum networks🌐 making them easier to use with faster and cheaper transactions. But since there is still much more room to grow, the experts at I have scored Arbitrum’s Github 9/10.
✅ Inflation Rate : Arbitrum's $ARB token has a total supply of 10 billion and a maximum annual inflation rate of 2%. This is a decent inflation rate, so I have scored $ARB’s inflation rate 8/10.
✅ Community : Arbitrum’s user base mainly consists of OG Ethereum users who often transacted on Ethereum and started using Arbitrum due to the high gas fees. The Twitter account of Arbitrum has more than 610K followers👨🦰, and their Discord channel has more than 320K members. Also, with the launch of $ARB on March 23, the governance of Arbitrum starts, which enables the community to make decisions by themselves to grow the community further. This is why I have scored Arbitrum’s community 9/10.
✅ Whitepaper : Arbitrum’s whitepaper clearly states the project’s vision to the readers: providing scaling solutions to increase transaction speed and lower costs while staying as secure as Ethereum. The Arbitrum team has achieved many milestones till now and continues to do so, like the upcoming governance launch. This is why I have scored Arbitrum’s whitepaper 10/10.
✅ Developers : Since Arbitrum was founded by experienced computer scientists, the devs building Arbitrum are top quality which can also be realized by the number of projects building their DeFi protocols on Arbitrum. This is why I have scored Arbitrum’s developers 9/10.
✅ Tokenomics : The $ARB token distribution is as follows: 11.62% is airdropped to individual wallets, 1.13% is allocated to DAOs in the Arbitrum ecosystem, 17.53% goes to investors, 26.94% is allocated to the team, and future team, advisors, and the remaining 42.78% stays in the DAO treasury which can be governed by $ARB holders. This is an extremely fair token distribution, with the founding team receiving less than 30% of the total supply, so I have scored Arbitrum’s tokenomics 10/10.
✅ Venture Capital Investors : Arbitrum has a long list of VC investors, including Pantera Capital, Coinbase Ventures, Alchemy Ventures, and many more, which shows the credibility and the great vision of Arbitrum. This is why I have scored Arbitrum’s VC investors 10/10.
✅ Competitors Comparison : Arbitrum is one of the largest roll-ups providing scaling solutions for Ethereum, with over 3.5 million unique addresses on Arbitrum. But as an optimistic roll-up, Arbitrum faces heavy competition from other optimistic roll-ups like Optimisim and even ZK (Zero Knowledge) roll-ups. Each roll-up has its pros and cons, but without getting into the technical details, I have scored Arbitrum 8/10 in terms of competitor comparison.
⚠️ The overall score for Arbitrum is 9.3/10, which is an excellent score when evaluating a crypto project. But always remember that crypto tokens are generally risky assets that often face major volatility.
So you must do your research and even consider talking to an advisor before investing🤑 in any crypto project.


ETHBTC Altcoin indicator recovery due for alts? ETHBTC is used against Bitcoin, meaning, when Bitcoin is bullish ETHBTC will be bearish and when ETHBTC looks bullish Bitcoin will be looking weak.
Ever since 2016-2017 crypto investors have been using this tool as an early indicator to get in alts and to find "alt seasons".
You can also use this as an indicator along with Bitcoin to find when alts are going to be bloody all along. Whenever this indicator is looking bearish you know alts are going to be bearish together.
If you did not this before, let me narrow down the importance of using ETHBTC as an indicator to find ALT pumps or ALT szns:
-Ethereum Dominance: Ethereum is the second-largest cryptocurrency by market capitalization after Bitcoin. It has a significant influence on the overall cryptocurrency market, and many altcoins are built on the Ethereum blockchain. As such, ETHBTC can be a good indicator of the health and performance of altcoins.
-Historical Performance: The historical performance of ETHBTC during previous altcoin seasons has shown a correlation between the price of ETH and the price of altcoins. When ETHBTC is rising, it may indicate that altcoins are also likely to rise in price.
-Trading Pair: ETHBTC is a commonly used trading pair on many cryptocurrency exchanges, which makes it easy to track and trade. Investors can use ETHBTC to monitor the performance of altcoins and make trading decisions accordingly.
-Technical Analysis: Technical analysis can be used to identify trends and patterns in the price movements of cryptocurrencies. By analyzing the charts of ETHBTC, investors can identify potential buying or selling opportunities for altcoins during alt seasons.
-Diversification: Investing in altcoins can provide diversification in a cryptocurrency portfolio. By using ETHBTC as an indicator, investors can identify potential opportunities to diversify their portfolio and potentially increase their returns.
-Market Sentiment: The market sentiment towards Ethereum and Bitcoin can impact the performance of altcoins. If investors are bullish on Ethereum, it may indicate a positive sentiment towards altcoins as well.

ETHBTC hitting monthly support, likely to bounce from this zoneETHBTC is hitting monthly and weekly support level. This zone should be a good place for it to bounce. There is another weekly support sitting here in case this one fails but I think this is already a good zone for bounce. It is possible that the price might spend some time inside this zone before it starts upward movement.

⚖️Does Ethereum repeat the sixth movement(6)❗️❓⚖️Today let's take a closer look at Ethereum in the weekly time frame. Do you see similar movements❗️❓
As you know, the price movement depends to some extent on the previous movements, so if we want to compare the previous 6 movements of Ethereum in the first correction phase with the current 6 movements, We should look for evidence and similar movements.🔎🔍
⚖️ Similar movements ⚖️:
The movements of Ethereum microwaves in the correction phases are almost similar to each other.
The third movement (3) in both moves are 50% Fibonacci movement 1-2.
The fourth movement (4) in both moves are 78.8%-61.8% Fibonacci movement 2-3.
The fifth movement (5) in both moves are 78.8% Fibonacci movement 3-4.
The fifth movement (5) in both moves are 61.8% Fibonacci(Extension) movements 2-3-4.
The angles of both support lines are almost equal.
There seems to be good evidence that these two corrective moves are very similar, so we can expect the sixth movement (6) to be perhaps a bit slower than the first corrective movement (the sixth movement (6) was sharper under the influence of 🦠Covid🦠).
Ethereum Analyze ( ETHUSD ), Weekly time frame ⏰.
Do not forget to put Stop loss for your positions (For every position you want to open).
Please follow your strategy, this is just my Idea, and I will be glad to see your ideas in this post.
Please do not forget the ✅' like '✅ button 🙏😊 & Share it with your friends; thanks, and Trade safe.

A big correction is coming for ETHA triple flat was formed, and it was a correction for the previous decline, and it is about to complete the correction, and the decline will be completed, and Ethereum and alternative currencies will weaken accordingly, and the acquisition of Bitcoin will be strengthened at the expense of currencies and Ethereum

#Bitcoin Gains 12% versus ETH in Less Than 10 DaysPast Performance of ETHBTC
Bitcoin bulls are in the driving seat, adding 12% versus ETH, looking at the candlestick arrangement in the daily chart. Notably, the coin is within a breakout formation, forcing ETH back below October 2022 lows. As it is, BTC bulls can continue looking for entries on every attempt higher towards resistance at 0.066 BTC, targeting 0.058 BTC in the short term.
#ETHBTC Technical Analysis
From the daily chart, the uptrend is clear. Even though BTC bulls are in a commanding position, it is evident that ETH bulls are in charge from a top-down preview. Notice that from June 2022, prices were mostly in consolidation, registering a bull flag until last week's push lower below the base. Still, ETH buyers are in a good position as BTC pushes hard, retesting the 61.8% Fibonacci retracement level. ETH might recover, but this may first require prices to expand above 0.066 BTC with rising volumes. In the short term, losses below 0.062 BTC may trigger even more losses towards 0.057 BTC, the 78.6% Fibonacci retracement of the June to September 2022 trade range. Aggressive traders can continue shorting any push higher with targets at this week's lows.
What to Expect from #ETHBTC?
Bitcoin bulls are in control, outperforming ETH in the short term. Since price action is within a bearish breakout formation, the downtrend remains, and prices might contract even more toward 0.062 BTC.
Resistance level to watch out for: 0.066 BTC
Support level to watch out for: 0.062 BTC
Disclaimer: Opinions expressed are not investment advice. Do your research.

Ethusdt Looks Promising For Midterm Seems Like Eth Is Ready For Massive Recovery In Coming Weeks
Descending Broadening Wedge & Symmetrical Triangle breakout Has Already Confirmed In 2days Timeframe Expecting Massive Bullish Moves In coming Months
our 1st Target would be 2300 2nd 3400 3rd & Final Target will be 4600

Significance of the 1572.69-1879.61 sectionHello?
Traders, welcome.
If you "Follow", you can always get new information quickly.
Please also click "Boost".
Have a good day.
-------------------------------------
(ETHBTC 1W Chart)
If it rises above the 0.072484-0.079552 range, it is expected to dissipate its upward force.
To do so, it must show support by rising at least 0.074044.
The uptrend lines (1) and (2) are long-term uptrend lines, and I think that an upward break through these uptrend lines is a very meaningful event (?).
-----------------------------------------
--------------------------------------------
(ETHUSDT 1W chart)
The HA-Low and HA-High indicators are converging, and they are supported and rising in this section.
The key is whether it can rise above 1611.62 and rise above the M-Signal on the 1M chart.
(1D chart)
The key is whether it can be supported and rise in the 1572.69-1879.61 section, which is an important support and resistance section.
If not, you need to make sure it has support around 1519.34, the point where the new HA-Low indicator is about to be created.
If the price holds above 1611.62, near the HA-Low indicator point (1609.43), it is expected that it will lead to an attempt to break above the M-Signal on the 1M chart.
If it breaks below 1519.34, you should check for support near 1340.12-1460.54.
-------------------------------------------------- -------------------------------------------
** All descriptions are for reference only and do not guarantee profit or loss in investment.
** Even if you know other people's know-how, it takes a considerable period of time to make it your own.
** This is a chart created with my know-how.
---------------------------------

ETH/BTC possible bounce entryAs BTC is ripping , altcoins are getting destroyed.
This is mainly because people are switching their altcoins into bitcoins in order to preserve their bitcoins. Bitcoin just went 70%+ in 1 week and destroyed altcoins there leaving them behind .
Above, i have provided possible targets to where altcoins can start bouncing.

ETH/BTC Alt Season indicator bullish!ETH/BTC seen as the ALT SZN indicator has broken a significant resistance despite the negative news surrounding the US economy and the world. It is said that if this goes up, alts go up.
EthbtcRetesting the .618 here
Probably as low as we go here imo
Infinite use case eth has been hardly effected by the bear market at all on the btc pairing
This is the area to scale across imo
Charting vs eth here for the rest of the year given eths 1st full market cycle chart
Deflationary aspects of eth should kickin sooner rather than later in terms of price action

ETH 4H SUPPORTETH 4H support is now at ~$1610
Enter 50% at the current price
and try to set some BUY orders near the support zone
If ETH stays above the trendline,
the Take-Profit target would be 5%, 10%, and 15% from your entry
Cheers

Ethereum - Trendline from 2015 is breaking down! (unbeliveable)
This is very negative news for ETH because this trendline on the monthly chart from 2015 to 2023 is currently breaking down!
It's the first time you see this very important info, so make sure you follow me to not miss updates that no one talks about.
What does it mean for ETH? There is a great chance that investors are going to sell ETH completely or sell ETH and buy BTC instead. Both are negative for the price of Ethereum.
Expect some bad news on Ethereum; currently, we do not know what it's going to be, but it's probably going to happen, and very soon.
2 scenarios can happen. The first is that BTC will rise drastically and ETH only slowly. The second is that BTC will drop and ETH will drop even more with a big red dildo.
This analysis is not a trade setup; there is no stop-loss, entry point, profit target, expected duration of the trade, risk-to-reward ratio, or timing. I post trade setups privately.
If we take a look at the 20-month moving average, the price is currently below it, and historically, it has been a pretty good indicator.
From the Elliott Wave perspective, the ETHBTC pair is moving in ABC 3-wave patterns all the time, which is no surprise because this is not a trending market. ETHBTC doesn't have a trend; it has choppy price action, something like EURUSD.
I expect the ETHBTC pair to go down by 75%, which is a reasonable level to convert into ETH again. It's also the 0.5 FIB retracement.
I am sure you like this information that no one is talking about; now do your own due diligence on ETH.
Thank you, and for more ideas, hit "Like" and "Follow"!

ETH/BTC Weekly range ETH/BTC still rangebound within the higher time frames, a monthly close above the range high could indicate a bullish continuation since both previous attempts were rejected on the monthly time frame.

Eth is in a range long termI believe that eth is going to follow bitcoin into its previously mapped halving cycle. Eth is currently in a range marked between the two blue solid lines, with a middle resistance marked with dotted line. This is looking like a long term formation, accumulation below bottom blue line would be nice. Also, can buy the retest on a breakout. I'm sitting out until accumulation zone. My bet is range before range lows sub 1000 into next bull market.
