The price faces the resistance of $1,645The price of Ethereum has risen above $1,620. However, the price faces the resistance of $1,645.
If the price surpasses this level, the first significant resistance zone will be near $1,670, followed by the $1,700 area. If the price breaks above the $1,700 resistance zone, it could steadily increase toward the $1,800 level, and any further gains could lead to a move toward the $1,880 level.
On the other hand, if Ethereum fails to clear the $1,670 resistance, it could trigger a downside correction. The first support level on the downside is near $1,620, followed by the next major support near the $1,585 zone. If the price falls below $1,596, it might drop toward the $1,569 support, and any further losses could lead to a test of the $1,500 level.
ETHBTC

Eth Showing Signs Of LifeSeems Like Getting Ready For Further Continuation
Forming Bulish Descending Channel In H2 Timeframe
Incase Of Breakout Expecting 10 -12% Bulish Move

ETHBTC 1D Descending Triangle Until Feb '23ETHBTC appears to be caught in a mid-term descending triangle for the next couple of months. There'll be plenty of movements in and around this area, but we'd expect a net total of about -5% over the course of the next 2 months.
Crypto Tipster v2 is currently showing a Sell signal although the market has been a tad choppy recently, and with a potential squeeze on the cards you'd need to keep your eyes on this one.

Ethereum - Final 24% drop before a new all time high!
Ethereum is now in an extremely difficult situation because the price is at the resistance of this symmetrical triangle and also inside the bearish rising wedge pattern on the daily chart! These patterns are bearish, so the probability of breaking down is higher at this point. Of course, we can breakout bullish, but do you really want to bet on it?
What's more, it looks like the first impulse Elliott wave has been completed, and we should take a look for a potential buying level on the next bull run! An ABC correction is on the way, and in this case personally, I am targeting the previous POC or the 0.618 FIB of the impulse wave, which is a 24% drop.
The very good news is that this triangle has impulse waves to the upside and corrective waves to the downside. It's a sign of trend reversal, and that's why I think this symmetrical triangle will break to the upside (later)! I think the bull market has started, but we are still stuck in this symmetrical range.
This analysis is not a trade setup; there is no stop-loss, entry point, profit target, expected duration of the trade, risk-to-reward ratio, or timing. I post trade setups privately.
As you can clearly see, we have an unfilled GAP, and it is very dangerous to go up without filling it. The reason is that the market will want to fill the gap later, maybe in 2024, and you probably don't want it. So let's fill it now.
If you haven't seen my previous very popular idea about "Bitcoin to 18K," "The big crash is coming!" You have to check out the related section down below, because it's absolutely mind-blowing.
Currently I am bearish on Ethereum and Bitcoin, but only temporarily until we reach my targets. It's hard to speculate on the breakout of the symmetrical triangle while the price is still inside it. So from my perspective, the probability of going down is 75%.
It was a very good rally with tons of profits, but now we need to trade the market differently. Of course, it will be more difficult for the majority of traders, but it is doable!
Thank you, and for more ideas, hit "Like" and "Follow"!

ETHBTC - Falling Wedge within a Falling Wedge16hr chart UTC +1
Falling Wedge within a Falling Wedge . 1 to zero fib extension drawing levels of support and resistance . Clear breakout from smaller Falling Wedge . Tp (Take profit) zones included. Daily and weekly support levels included.

Ethbtc Forming Bullish Pennant Seems Like Getting Ready For Bullish Moves
Over All Forming Symmetrical In Daily Timeframe
Recently Falling Wedge Broken In H4 Timeframe
Expecting Test Of Upper Trend line Of Triangle If Trend line Got Cleared Too Expecting Another 35 -40% Bullish Move

Bullish and bearish scenariosBullish scenario: If Ethereum can break and stabilizes the price above the $1,660 level, it will face major resistance at the $1,670 zone. The next major resistance is near the $1,720 zone.
Closing over the $1,720 resistance range might start a rising trend to the $1,780 level. Any more gain may pave the way for a move to the $1,840 area.
Bearish scenario: If Ethereum fails to stabilize above the $1,600 zone, another downside correction could start, and the price might drop toward the $1,535 support. Any more losses might call for a test of the $1,500 level.

Ethereum was losing minor supportEthereum was losing minor support in the $1,622-$1,635 range. Even the $1,600 support range was briefly broken, and the Ethereum price corrected to the $1,580 area.
Given that Bitcoin has yet to settle on support if the price decline continues, we can expect selling pressure to push the price of Ethereum to crucial support in the $1,550 range.
At this level, we expect a positive reaction.
The range is $1,611 as a pivot level. If the breaking of this range is accompanied by breaking the resistance of the $1,622 to $1,635 range, we can expect further growth to higher resistance levels.

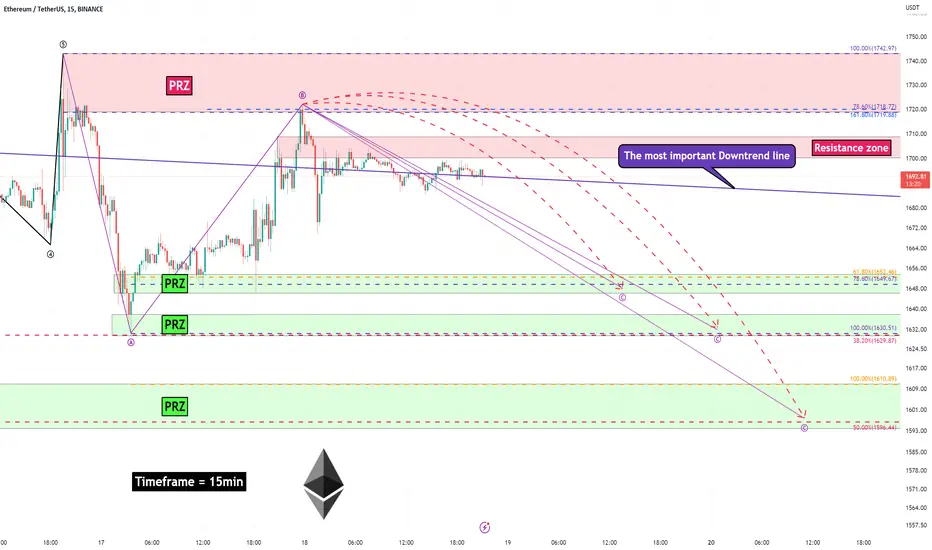
Ethereum Analyze (Short Term,15-minute Time Frame,02/18/2023)!!!Ethereum is moving in near its important downtrend line, at the same time, it seems to have found the end of wave B near this line and PRZ.
I expect Ethereum to drop at least until the first PRZ, although further price drops are possible.
Ethereum Analyze ( ETHUSDT), 15-minute time frame ⏰.
Do not forget to put Stop loss for your positions (For every position that you want to open).
Please follow your strategy, this is just my Idea, and I will be glad to see your ideas in this post.
Please do not forget the ✅' like '✅ button 🙏😊 & Share it with your friends; thanks, and Trade safe.
ETHBTC - Inverse Head and Shoulders Monthly Time FrameInverse Head and Shoulder pattern on monthly time frame with recent what seems a decent monthly support. Also Fib 0.382 from low to high - signalling possible Bull Flag.

Positive swingOver the past 24 hours, Ethereum has been falling to the $1,600 support area, and we've seen a positive swing on it with a strong reaction to this support level.
There is currently support in the range of $1622-1635, which is expected to maintain this range and a positive reaction from this level to continue the daily uptrend. In this case, the price increase can continue up to 1730 and even 1790 dollars.
But if there is no positive reaction in the retest of this support, we can expect the price to drop and enter the $1,500 channel.

Ethereum is ready for a massive pump! (again)
It has been one of the best 2 months in crypto history, with tremendous gains on altcoins. Euphoria is at a very high level, but it's going to be even higher because ETH is forming this incredibly bullish pattern!
My main focus is and always will be on altcoins, and I am monitoring all futures + spot pairs on major exchanges. I prefer to trade on leverage, so you don't need too much margin compared to the spot.
Ethereum's chart is displaying an inverse head and shoulders pattern, and I am confident that once we break the neckline, we will see a massive green dildo, which is why you should be in.
It's a good idea to buy ETH right now and set your stop-loss below the right shoulder. You don't want to wait for a confirmation! You want a higher risk-to-reward ratio instead.
This analysis is not a trade setup; there is no stop-loss, entry point, profit target, expected duration of the trade, risk-to-reward ratio, or timing. I post trade setups privately.
On higher timeframes, ETH has been moving in an ascending parallel channel on the LOG scale. This channel is indeed very resistant; make sure you are aware of it.
From the Elliott Wave perspective, the wave structure is totally incomplete. We are still in the 3d wave, and we have plenty of time for the upcoming uptrend!
Some altcoins are skyrocketing with 100% - 500% gains already. Do not forget to take a look at my previous analysis on BTC - "30k next stop, then big crash! (Whales plan)."
Thank you, and for more ideas, hit "Like" and "Follow"!

ETH/USD 1DAY UPDATE BY CRYPTO SANDERS !!Hello, welcome to this ETHEREUM /USD update by CRYPTO SANDERS.
CHART ANALYSIS:-Ethereum (ETH) was in the red for a second consecutive session, breaking out of a key support point in the process.
Following a high of $1,682.78 on Tuesday, ETH/USD slipped to a bottom of $1,628.69 earlier in the day.
Today’s drop came as ethereum moved further below a long-term support zone at the $1,675 mark, with $1,625 acting as an interim floor.
Since hitting this low, bulls have somewhat reentered the market, with ethereum now trading at $1,643.32.
Price strength has also plunged, with a floor of 57.00 giving way earlier in the session, with the RSI now tracking at 53.76.
Overall, ethereum is still trading nearly 6% higher from the same time last week.
I have tried to bring the best possible outcome to this chart.
Hit the like button if you like it and share your charts in the comments section.
Thank you

#ETHBTC - A Small Short Trade Here, But What's Next?After some mega trades throughout 2022 with #ETH #BTC we've been a little quiet recently ranging within a smaller channel with trades showing small profits and/or small losses.
We've got a chance now of another small profit from a Short trade but the real question is what's going to happen next? When a breakout of this ranging market happens (which it will!), the direction #ETHEREUM heads is up for debate!
What do you guys think?
If you enjoyed or agree with this idea - drop us a comment, like & follow! 😀
Ideas by theCrypster meet the guidance notes and disclaimer as mentioned below and within our website. See Signature for more info! ✌️
Crypto Tipster v2 by theCrypster

ETH/USD 1DAY UPDATE BY CRYPTO SANDERS !!Hello, welcome to this ETHEREUM /USD update by CRYPTO SANDERS.
CHART ANALYSIS:-Ethereum (ETH) also moved lower in today’s session, as bears pushed prices below the $1,700 level.
ETH/USD plunged to an intraday low of $1,671.98 on Tuesday, less than 24 hours after trading at a peak of $1,714.29.
Today’s drop sees ethereum move below its long-term support point at the $1,675 mark, which has been mainly stable for the past week.
the decline in prices comes as the 14-day RSI retreated from a recent ceiling at 61.00.
As of writing, the index is now tracking at a reading of 57.28 and appears to be rapidly nearing a floor of 57.00.
Should bears hit this bottom, ETH will likely be trading below $1,650.
I have tried to bring the best possible outcome to this chart.
Hit the like button if you like it and share your charts in the comments section.
Thank you

The price action has reacted to the R1 pivot resistanceEthereum rallied yesterday, breaking the daily pivot completely and turning this level into temporary daily support up to the resistances it had been marked for.
The price action has reacted to the R1 pivot resistance, and this level continues to have a positive reaction. For today, the resistance that we can consider is in the range of 1727 to 1735 dollars, and the second resistance range is considered in the price of 1788 to 1800 dollars.
The second resistance level can have a stronger reaction. Also, if this support is broken, the following support range is considered at the price of 1620 to 1630 dollars.
The bottom side of the triangle pattern is very important.

Ethereum Enron 2.0? Can anyone explain how this works? Somewhat confused here, I come from a traditional finance background TradFi if you wish, I decided to do some research on Ethereum as its in the talk next to Bitcoin .
What I discovered this Ethereum is a mix between Enron and WorldCom and completely useless.
Correct me if I'm wrong.
1. Ethereum is no longer PoW meaning there is no energy to create or maintain the network.
2. The only value I have seen on Ethereum making it relevant and keeping the structure going is stable coins that are ultimately after Bitcoin .
3. Ethereum developers who clearly cannot do math but they can code have create a collapse scenario for Ethereum .
Only posting this is I noticed people wondering why are my Ethereum tokens locked in something called the Merge?.. .
Well think about it, Tether and USDC don't need Ethereum , Ethereum needs them, Ethereum developers bright idea? add a APY / Yield for staking Ethereum .
This yield goes up the less Eth are staked and the more are sold, this is creating a government issued bond but there's no country backing Ethereum .
The thought process is institutions and banks will plug into Eth to do transactions when in reality they're laughing at the Ethereum community.
Institutions will create their own network to transact to Bitcoin , they're never going to opt into a network that they have to pay for a token? to transact stable coins?
What you're going to see is Bitcoin rise Ethereum fall, more Ethereum users run to unstake the Yield will rise creating more Ethereum > causing more people to unstake > more selling Ethereum .
Like its not even like we did not just go through something similar collapsing.
Have listen to a few Ethereum developer calls and I'm wondering do you even understand what you just created? probably not because none of these people have any clue about finance.
You can actually already start to see a deflationary death spiral before the coins locked have even been unlocked?

Breaking of the top of the triangleIn the last 24 hours, Ethereum showed strong reactions to its support and resistance ranges.
At first, the upward movement of Ethereum continued up to the $1730 range, but with price reactions to the resistance levels, we saw a sharp return to the support range.
Previous support was considered on the chart in the $1,650-$1,630 range.
A strongly positive reaction to this level has been observed.
Ethereum's daily pivot is in the range of $1,690-$1,695, and if this minor resistance is broken, Ethereum can grow again to the previous resistances.
The trend of Ethereum has also ranged like Bitcoin. The uptrend can continue as long as the support levels marked on the chart are not broken.
With the breaking of the top of the triangle, Ethereum will be able to rise well in price

The main resistance of EthereumEthereum's volatility range was between $1,713 and $1,680 yesterday, forming a doji candle well within its previous candle's range. In the 4-hour timeframe, Ethereum is still bullish, and after hitting minor support in the $1,627-$1,654 range, the price is again trying to form a higher ceiling.
The main resistance of Ethereum in the range of $1727 - $1808 is one of the strongest levels that Ethereum has not yet stabilized above this range after eight months.
Due to the economic situation and the negative news after that, the price above this level needed to be stabilized.
Also, this range is confirmed by the Smart Money indicator. The thing about this resistance is that if the number of collisions increases to this level, the probability of breaking it increases.

BTC 🔵 or 🔴 ?Roses are red, violets are blue. Bitcoin pumping⛽ but currently being below trendline resistance. I have 2 bullish scenarios in my head how we could get to the target. Blue🔵 or red🔴? We could hit the target in few weeks anyway. Target being projection of the previous range 100%-0%, it's just measured move added to the range high (100% @ 21480). Simple yet powerful technique. See the REKTanglez😁 on pic below, and it should be clear.
PS: Hover over the BIZ circle and you will find a treasure!
Check my other stuff in related ideas.
Please boost🚀, comment🗣️, follow me✒️, enjoy📺!
⚠️Disclaimer: I'm not financial advisor. This is not a financial advice. Do your own due dilingence.

BTC better to hold this supportPlease 1st of all smash the boost🚀 button to support my work if you like it! It's absolutely for free.
Bitcoin having nice ride up. I will not sell as long as this cyan support zone created by cluster of uptrendlines holds.
Check my other stuff in related ideas.
Please boost🚀, comment🗣️, follow me✒️, enjoy📺!
⚠️Disclaimer: I'm not financial advisor. This is not a financial advice. Do your own due dilingence.

Ethereum had a small correctionEthereum had a small correction in the last 24 hours and rebounded before reaching the $1,600 support area.
The return of the price to the previous ceiling range has again been accompanied by a reaction, and in general, has increased the potential to enter the range trend.
Only the first signs of entering the range trend have been observed. But before that, there is a possibility of further growth and a move towards a more important resistance that is considered in the $1800 range.
For today, as long as Ethereum is above the $1,666-$1,675 range, we can consider the short-term daily trend to be bullish. Daily short-term targets will be in the ranges of $1720, $1740, $1775, and $1800.

Volatility in the marketIn the last 24 hours, there has been a lot of volatility in the market and market sellers have gained strength.
With the continuation of the upward trend of Ethereum and the formation of a new ceiling in the 4-hour time frame, the price hit the range of 1727 to 1808 dollars.
This resistance has been seen as a strong supply area on the Ethereum chart for the past few weeks when the price hit this range again after a 6-month gap.
Also, the trend of Ethereum below this resistance zone can be ranged. But in the 4-hour timeframe, due to the creation of a higher ceiling, we see the Ethereum trend rising again.
So two important supports are considered for Ethereum, which considering the type of correction and the high angle to the horizon, we can expect the price to hit these levels.
The first support is in the rand range of $1600, and the second support is in the range of $1545-1555.
