Ethereum Accumlation Area! Reminder: The Merge Won’t Solve Ethereum’s Scaling Woes by Itself!!
Ethereum’s transition to proof-of-stake might finally be around the corner, but true scale won’t come from a single upgrade, After yet another delay, the Ethereum network took a step closer to “the Merge” with its first Ethereum mainnet “shadow fork” – a successful test run of the network’s eventual transition to proof-of-stake.
As many of you will remember, Ethereum’s transition to proof-of-stake was originally set to accompany another upgrade: “sharding,” which promised to split up the network into pieces in an effort to increase transaction throughput and decrease fees.
But sharding won’t be coming any time soon. In order to expedite the shift to PoS, sharding was postponed until after the Merge and is now slated to come sometime in 2023 (though Ethereum timelines have a way of stretching out).
In the meantime, the focus has shifted away from the Ethereum network itself to layer 2 systems like “rollups,” which scale the Ethereum network off-chain while borrowing its essential security guarantees. An entire layer 2 industry has popped up to scale, or increase capacity on, Ethereum, with leading products such as Arbitrum, Optimism and Loopring allowing users to transact at a fraction of the cost of Ethereum, and attracting billions of dollars in combined total value locked (TVL) as a result.
ETHBTC

ETH ANALYSIS#ETH UPDATE.
#ETH isd currently trading at the blue box daily support and if eth loses the current daily support it is lost likely that eth might test the green box support on daily soon.The next possible move would take 4-6 hours so keep eyes on that,however purple box is the current resistance and eth needs to close above this level for any upside move.

ETHEREUM 1D Important SupportIn the previous analysis, we mentioned the failure of the upward trend, which has led to the formation of a descending channel. If you maintain a support range, we expect the price to rise to the channel ceiling, otherwise the process will continue to $ 1,000 and $ 800.
Its not Buy or Sell SIGNAL
DYOR
BY : M.TeriZ - @AtonicShark

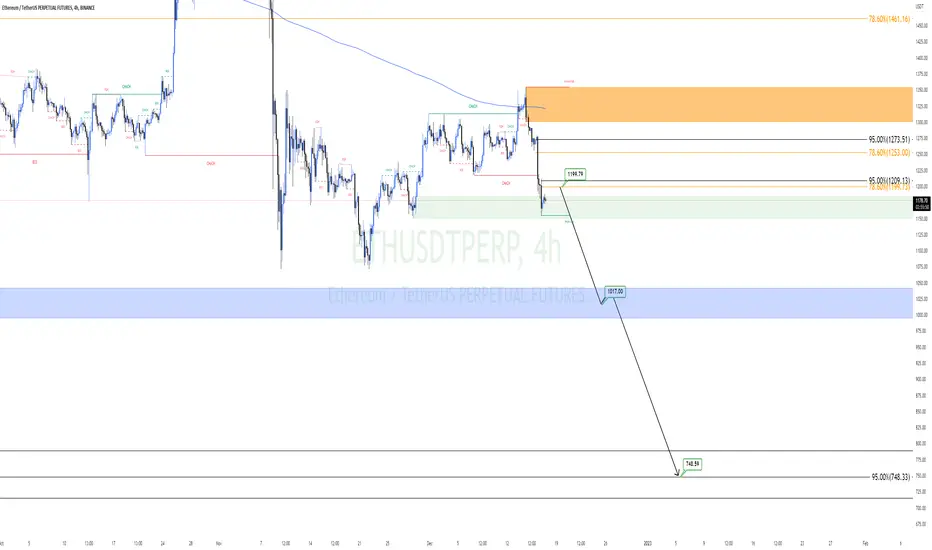
ETHUSDTP Rdy For ShortHello to all my dear friends, I have done the Ethereum analysis for you.
In this analysis, we want to buy the Ethereum cell, and our entry point will be $1,199, as well as the desired targets, $1,017 and $748.
The loss limit that we have set is $1,220.
Also, we will enter into this transaction with 50% of the original capital.
Good luck, dear Manouchehr Azar
BITCOIN 6H breaking channel NowIn the previous analysis of Bitcoin, we mentioned the channel that today the channel's support for the data went and updated the support ranges.
Its not Buy or Sell SIGNAL
DYOR
BY : M.TeriZ - @AtonicShark

ETHUSD - It is what it is - Still more downside to comeETHUSD looks bearish.
It is what it is . Probably many people would prefer to see higher prices but BTC broke the key support and ETH is lagging behind. It will have to catch up .
Probably some FUD would be a trigger for a dump.
What could it be? Do you have any clue? Feel free to share your FUD ideas in the comment section !

ETHEREUM 6H breaking TrendLine NowAccording to the chart, we are in an important range where we expect a drop if the trend line is broken, and if this range is maintained, the upward trend will continue. Currently, we are breaking the trend line and stabilization.
Its not Buy or Sell SIGNAL
DYOR
BY : M.TeriZ - @AtonicShark

Ethereum waves (correction will end soon)We have a large diameter and I think the g-wave has become another diameter. We can experience a good climb from the green zone

Ethereum Remains Higher Ahead of Fed Rate DecisionHello, welcome to this ETH /USDT 1DAY chart update by @CRYPTOSANDERS.
I have tried to bring the best possible outcome to this chart.
CHART ANALYSIS:-Ethereum (ETH) was also trading near a multi-week high in today’s session, as traders geared up for the U.S. Federal Reserve policy meeting.
Many expect the Fed to increase interest rates by 50 basis points, following the better-than-expected inflation report.
ETH/USD hit a high of $1,341.44 on Wednesday, which comes less than 24 hours after trading at a bottom of $1,289.23.
As can be seen from the chart, ethereum remains close to a five-week high, with prices in the green for a third consecutive session.
Like with bitcoin earlier, the RSI is now hovering close to a key resistance level of 59.00, with a current reading of 58.06.
Market pressure could intensify should bulls force a breakout of this hurdle, potentially leading ETH toward $1,400.
This is not a piece of financial advice.
Hit the like button if you like it and share your charts in the comments section.
Thank you

Unique Update Of Ethereum
Hello, welcome to this ETH /USDT 1DAY chart update by CRYPTOSANDERS.
I have tried to bring the best possible outcome to this chart.
CHART ANALYSIS:-Ethereum(ETH) also rose in today’s session, as bulls reentered the market, taking prices close to the $1,300 level.
ETH/USD raced to a high of $1,294.10 in today’s session, which comes less than a day after hovering at a low of $1,248.36.
As a result of today’s move, ETH/USD moved closer to a recent resistance level of $1,300, as prices were almost 4% higher than Monday’s peak.
Like with bitcoin, bullish sentiment in ethereum returned following a breakout of a resistance level at the 53.00 mark.
As of writing, the index is tracking at 53.75 and now seems to be moving toward a ceiling of 55.00.
ETH will likely recapture the $1,300 level, however, what happens at that level is the key question for traders.
This is not a piece of financial advice.
Hit the like button if you like it and share your charts in the comments section.
Thank you

Ethereum Bullish Technical Analysis Update#Ethereum Technical Analysis Update:-
As per Chart ETHUSDT Broke out inverted H&S Pattern and Trading around $1270
H&S Pattern ( Head Height is 14% ) so Target will be $1400 ( 14% from Breakout Point )
- Breakout Resistance Level :- $1230
- Breakout H&S Pattern:- $1230
- Short Time frame Also looking Bullish.
- Waiting for Another Resistance breakout which is around:- $1300
- Overall I am Bullish in Short Term above $1200
Targets:- $1400/$1480/$1570
Never Trade Blindly always placed Stop Loss below Support Level.
The market is highly volatile because of Global Inflations.

Ethereum is about to crashWe are inside the diametric f wave. This wave itself has turned into a flat and we are now in wave 2 of c. From the supply zone, it could fall to $960-840

ETH UPDATE We are inside the diametric f wave. This wave itself has turned into a flat and we are now in wave 2 of c. From the supply zone , it could fall to $960-840

ADA is going to the lower end of the channelBINANCE:ADAUSDT has been trending on a downward bearish channel for sometime now, and it was rejected from the median line of the channel. We will likely see a continuation to the lower bound of the channel completing an ABC correction.

ETH 6H BUY / SUPPORT ZONEETH 6H support is at ~$1230
Enter 50% at the current price
and try to set some BUY orders near the support zone
If ETH stays above the trendline,
the Take-Profit target would be 5%, 10%, and 15% from your entry
Cheers

Important resistance!Ethereum remained well-bid and strong above the $1,220 zone.
It could start another drop if it fails to climb above the $1,300 resistance. Initial support on the downside is near the $1,260 level and the 100 hourly simple moving average.
A close above the $1,300 resistance might start a new increase. The next major resistance is near the $1,320 level, above which ether price could gain bullish momentum for a move to $1,400.

Ethereum is bullish! | Bull flag is ready!
This bullish flag is absolutely ready for a breakout! I am bullish on ETH, and I opened a quick long position. I will exit at the resistance, and after that, I am going to short ETH!
As you can see, the price is in this rectangle range, and usually the market is ranging 75% of the time, so there is a huge chance that the bears will step in at the resistance! I recommend shorting ETH later.
In my opinion, there is currently only a 25% chance that this rectangle pattern will be destroyed by the bulls on the first try. I expect a strong rejection and will go back to the POC that you can see on the right side of the chart.
There are a lot of stop losses above this flag, so I believe the market wants the liquidity.
From the Elliott Wave perspective, it looks like a corrective tripple zigzag pattern (WXYXZ), because we have an overlap between the major waves, which is not a good sign for the bulls.
This overlap is a problem. It shows the weakness, and I don't like it. Let me know in the comment section what you think!
We have a double bottom pattern on ETH. The neckline needs to be broken to confirm this pattern, but it's not going to be easy.
I don't know what about you, but I am now temporarily bullish on ETH, and I have my orders set to close long and open short at the resistance.
I wish you a lot of fun during your trades!
I post trade setups privately. This analysis is not a trade setup; there is no stop-loss, entry point, profit target, expected duration of the trade, risk-to-reward ratio, or timing.
For more ideas, hit "Like" and "Follow"!

Ethereum waves (correction will end soon)We have a large diameter and I think the g-wave has become another diameter. We can experience a good climb from the green zone

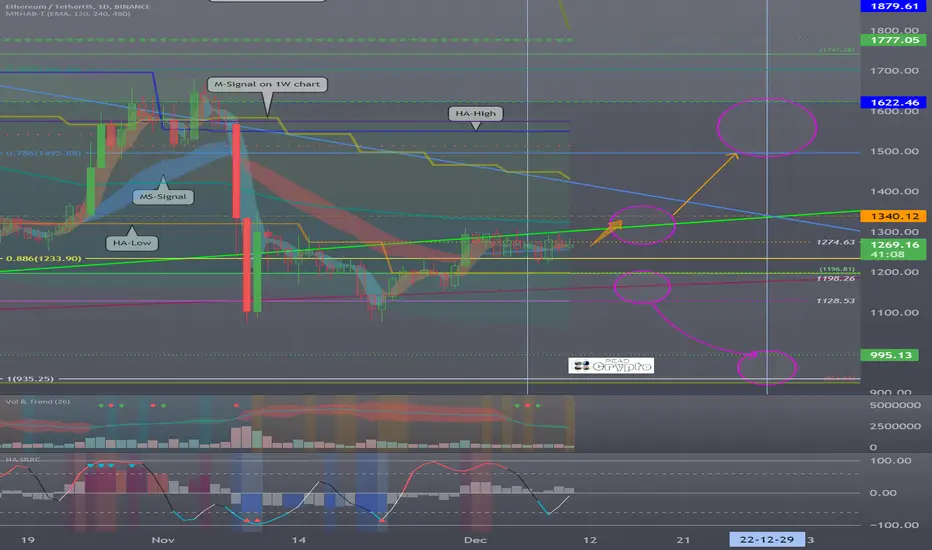
A new trend is yet to be seen. Rise above 1340!Hello?
Traders, welcome.
If you "Follow", you can always get new information quickly.
Please also click "Boost".
Have a good day.
-------------------------------------
(ETHBTC 1W Chart)
We need to see if we can continue the uptrend along the uptrend line.
--------------------------------------
(ETHUSDT 1W chart)
The HA-Low line is still holding at 3962.19.
So, you can see that it hasn't had a rebound or a sharp uptrend yet.
In order to break this trend, it needs to show a rise above the downtrend line.
(1D chart)
On the BTC 1D chart, the -100 indicator is falling, creating a new trend, but ETH is still at the -100 indicator at 1777.05.
Therefore, the key is whether you can show a movement to show a new flow.
It is important to be able to come up with an upward trend crossing the uptrend line.
The next period of volatility is around December 29th.
-------------------------------------------------- -------------------------------------------
** All descriptions are for reference only and do not guarantee profit or loss in investment.
** If you share this chart, you can use the indicators normally.
** The MRHAB-T indicator includes indicators that indicate points of support and resistance.
** SR_R_C indicators are displayed as StochRSI (line), RSI (columns), and CCI (bgcolor).
** The CCI indicator is displayed in the overbought section (CCI > +100) and oversold section (CCI < -100).
(Short-term Stop Loss can be said to be a point where profit or loss can be preserved or additional entry can be made by split trading. This is a short-term investment perspective.)
---------------------------------
ETH rising wedgeBINANCE:ETHUSDT is creating a rising wedge on the 1h chart. it's possible that we will see a pullback in the short term before resuming higher.

Bitcoin rising wedgeBINANCE:BTCUSDT is forming a rising wedge on the 1h timeframe. It seems in the short term we will see a pullback to the lower bound of the range

ETH ANALYSIS#ETH UPDATE.
#ETH has bounced back from the double bottom after the breakdown from the ascending triangle Longs will be open only if eth closes above the red box resistance on daily,however on losing the purple box support eth will test the green box support area .

Short-term buying tendencies have not yet disappeared!In the four-hour time frame, until the price creates a close below the $1,226-$1,208 range, short-term buying tendencies have not yet disappeared.
Breaking above $1260 can be a warning for buyers to regain strength and continue this growth up to $1330-1345.
If the mentioned support is lost, it can be expected to continue to decrease to the range of 1100 dollars.
