Ethbtclong

ETHBTC Long comparisonLong comparison of Digibyte which has reached the 1.618 line
and ETHBTC which is yet to reach the line
I expect to see what is happening to DigiByte at current, to happen to ETH during that time
Included some long term targets for ETH which i think are reasonable..

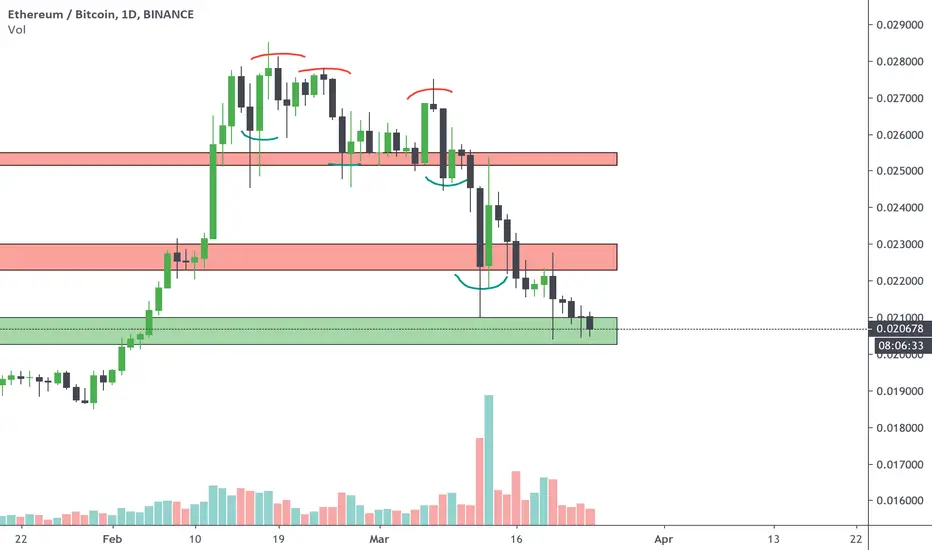
ETHBTC Dips ETHBTC has tendency to dip below 50MA just to climb back up over and break upwards through the trend
This has occurred twice, outlined in yellow boxes, will it happen a third time?
Price is currently at the top of a resistance line of a Gann fan on my other analysis of ETHBTC A H&S formation may be underway.
I trust this previous analysis more than this one, Gann is quite reliable.
Thought i would post this bullish outlook regardless..

ETH/USD (Retest recent High at 190 dollars?)ETH/USD
-found support at ascending trendline of support
-holding 20ma as immediate dynamic support
-bullish cross of 50ma & 100ma
-if 3rd candle close bullish green, we could expect another move up
-the initial target is the recent high at 190 dollars
-strong sell area is at 210 dollars
-our stoploss should be below 165 dollars

Something coolETHBTC
Price can be seen to be climbing nicely around the Fibonacci spiral
With a golden cross present
and no resistance in sight
this is very bullish
heres my previous analysis on ETHBTC forecasting a price

ETHEREUM Is ready to hit $200? (ETH/USDT BREAKOUT POINT)Ethereum opened the early hours of today sitting comfortably above the Pivot Point on the 1hr Chart, and so did ETH/USDT.
But what does this mean for ETH/USDT?
In the current bear zone($169-$172) where everything looks like bear market surge, nothing moves but stop loss keeps getting hunted down, (don't be one of those who call this type of situation a market manipulation as this is likely to affect how you make decisions in the future which will eventually lead to fear(EMOTION) clouding your judgements.
(Kindly like this post and share this idea if you find it useful, to encourage me make more future analysis on ETH/USDT.)
If we look at my last analysis on ETH/USDT, I stated that we will eventually consolidate for 2-4 days between $176- $152 when the price was still at $152.
Todays is the 5th day since my post, We have been able to eventually hit $174.95 and will today hit my proposed 1st TA $176.
In my opinion, From today We will see over 75% chances of breakout to the upside.
Why am I confident ETH/USDT will see $176 ?
If you look at the 1hr chart above, the early hours of the day opened above Pivot Point and it is still holding strongly for over 12hrs .
a lil dip is expected at $175 before hitting 176
This to me is a good bullish sign and in my opinion , Eth will out perform BTC in this run.
Another good look at the higher time frame(Daily)
My last analysis I warned show we could encounter a lil dip on the $176 before moving further to above $200.
To make it to above $200 Eth/Usdt will have to cross $176 or we will be pulled back by the bears.

ETH/BTC (Bullish Pattern Breakout: Confirmed)ETH/BTC
-a bullish breakout of the bull flag
-RSI hits above 70 condition level
-bullish EMA cross
-upside target is up to 0.026 sats
-stoploss below 50MA


ETH/USD (Bullish pattern still in play?)ETH/USD
-ETH bounced at 100MA on 4H chart
-key support today is 148 dollars
-ETH is trading inside this bullish channel
-if the pattern broke to the upside, the target is 173 dollars
-a break below 148 dollars will invalid this scenario

eth/btc Maybe !!!! support by Rsismall profit for 4 H if the volume increased in this few coming hours
Good luck..


Ethereum to outperform bitcoin?Symbol: ETH.D
Compared to bitcoin ethereum dominance has done the opposite. Looks stronger than btc dominance currently.
----------------------------------------------------
Want to level up your trading skills?
We just realesed our new course! Follow our tradingview page and visit the link in our bio if you are looking for new strategy to add to your arsenal.
Also checkout our trading indicator available in the link on our page.
---------------------------------------------------
Thank you for your continued support, God bless.
- Major League Trader

ETHBTC forming final leg of Shark | Good long opportunity aheadFormation of bullish Shark:
This time on very short term hourly chart the price action of Ethereum with Bitcoin pair is forming bullish harmonic Shark pattern and soon it will be entered in potential reversal zone.
Buying And Sell Targets:
The buying and sell targets according to harmonic Shark pattern should be:
Buy between: 0.023043 to 0.022906 sats
Sell between: 0.023164 to 0.023438 sats
Stop Loss:
The potential reversal zone area which is up to 0.022906 sats can be used as stop loss in case of complete candle sticks closes below this level.
This idea is for short term traders not a long term idea; I will be keep posting more trading ideas.
Note: This idea is education purpose only and not intended to be investment advice, please seek a duly licensed professional and do you own research before any investment.

ETH.BTC (Y20.P2.E2).Macro.Outperform BTCHi All,
It is of my opinion that in the long run, ETH will outperform BTC.
> Simply based on the Wedge formation and fib levels (structure).
> and BTC dominance chart
> Not to forget, in the 2017 parabolic run, ETH and many other ALTs did the same.
My simple rule, below the 21 daily EMA, BTC dominates, above the 21 daily, ALTs dominate
Its ALT season !!
Please give me a tick or a like as an appreciation of this post.
Regards,
S.Sari.
BTC Dominance


ETHBTC - double bottomETH is growing faster than BTC.
in this pair is worth looking at.
double bottom pattern on the crypt market, it's working well;
Friends, thanks for your likes and comments!
Good luck with trading!

ETHBTC BUY IDEAI expect the price to react from the bottom of the channel and the trend line, the trend line that I marked with the first target arrow and if it breaks it, the new target will be the top of the channel
Please support by liking

ETHBTC Butterfly MA bounceBecause it looks like a butterfly.. Plotting potential movements of MA's on the ETHBTC pair. A 'scythe' pattern can be identified on the weekly chart, a bullish continuation pattern. This pattern tends to be more successful on larger timeframes, as with most patterns. A strong support level can be seen to have reached on the daily chart, potential upward movement in the coming weeks is likely.

ETHBTC: Still doesn't look goodETHBTC keeps falling and does not show strength after it was rejected at resistance around 0.022 BTC.
Won't touch it near support for this time.
Information is just for educational purposes, never financial advice. Always do your own research.
ETHBTC ScytheMy first pattern identified as my own, the Scythe :) It appears to look as a reapers 'scythe', it is a bullish continuation pattern. It can be identified various times on this chart, and is appearing quite often across major and minor alt coins. Alligator can be seen to at a reversal point and 'eating' bullishly. Lets go ETH!

ETH/USD TA Update (bullish pattern confirmed)ETH/USD
ETH broke bullish of this inverse H&S pattern a few hours ago and the price is already trading above 50MA on the 4H time-frame.
This is a good market shift to the upside in the short-term. The overshoot target is up to 170 areas in which the 100MA is approaching in.


ETHBTC analysisMultiple chart patterns present, including symmetrical triangles, bullflags, bullish W. All three bullish chart patterns. An initial symmetrical triangle can be observed followed by a bullflag, following another symmetrical triangle. Included possible pathing within the second symmetrical triangle, but honestly as long as it stays within the triangle we're good. Looks very bullish.
