Ethbtclong

Trading plan ETH/BTC 12.03.2019After the candlestick fixation abroad the channel , buy with a target of 0.037.

ETH/BTC - Good position - Long or short?Currently Market is under Symmetrical Triangle , a possibility of the breakout is there. Waves indicated by the arrow in the chart.
Grey box represents a good rejection range and will take support nearby 0.037 BTC and if the pattern fails then blue box represents good support range. Final target already indicated in chart.
If the market will not directly break the pattern then may it test the level of 0.0355 which also golden ratio of 0.32 fib.
Recommendation for leverage Trader: If there is a decent profit of 5-20% then book that profit. Don't hodl for longer duration.

ETHUSD - BREAKOUTBuy Price: Green Zone
SL: Below Red Line
Profit: Blue Zones
Invest Suggestion: 20 Percent
Profit Expectations: 40- 100 Percent
Looking at the chart of ETH , we could see all technicall indicators pointing to buy it , like MACD lines crossed , EWO starting a new wave and the HMA 13 crossed all others HMA's ( will cross the 100 EMA with this strength) and we have volume! Also, we have a triangle in the weekly chart, showing to us a triangle reversal pattern, another call to us.
So, feel free to but it in the region of 125$-130$! Remember that's a short-therm call!!
See me previous analysis and how profitable the are!
Sell when you get some profit, according the way you trade.
Keep following us and please like this idea.
Any doubts? Send in the comments or in our telegram or Inbox here.
Thanks for visiting.


ETHBTC LONG TARGET 0,048100Hello guys. I have 0,048100 target for ETHBTC. You can also take some profit (TP1) at 0,0400 - 0,04100 where there maybe a correction.
Wish you the best...

ETHBTC latest technical analysis 125% Target We are doing Analysis of ETHBTC on Weekly Timeframe .
I have Mention Support and resistance levels on Chart
Note: This is only for Educational Purpose this is not an Investment advice.
Please support the setup with your likes, comments and by following on Trading View.
Thanks
Adil Khan

ETHEREUM - The Sleeping Giant Is Waking up!Looking at ETH's daily chart, we can see that the price action has broken overhead resistance which has kept the price at bay since June of last year! That's almost 2 years of consolidating. There is a bullish cross over the zero line on the MACD. I think all systems are go on ETH.

ETHBTC Long Bullish outlook
(1) Bounced off from golden Fib Zone which is around 0.5 to 0.618 Fib
(2) RSi is gaining strength
(3) TTM Squeeze also suggests that Momentum is upwards
Possible Entry ladder buy around 0.335 to 0.33
Target Zone: Take profit target 1 0.038 (Around Daily EMA 200) %30
target 2 0.041 (Daily Swing high) %30
Remaining 40% keep open with SL at 0.038
Keep Looking at BTC as BTC can always bring this guy down.

ETHBTC Looking to Re-Test the 200 Day Moving AverageETHBTC is looking poised to launch off of a triple EMA cross on the daily time frame. In addition, the stochastic RSI shows plenty of room for the price to run (to the upside) based on prior patterns.
If ETHBTC does break to the upside, the 200-day MA and EMA are right above--and these averages rejected the price a month ago at the relative high. The price may now be looking to test these levels before continuing the overall macro-bearish trend.


Ethereum bottom #FractalETH bottom #Fractal
- Inverse Head & Shoulders / Adam & Eve meme reversal.
- 2 Day RSI Bullish Divergence .
Need close over .04 sats to get this Ethereum train rolling.
#Ethereum #ETH #FractalsByCurb #PagingVitalik
-@CryptoCurb

ethusd longETH LONG
STOP LOSS:107.7
TARGET 1: 136
TARGET 2: 142
TARGET 3: 180
TARGET 4: 200.5
TARGET 5: 240.82
SHORT TERM TARGETS IF 113 HOLDS(STOPLOSS)
TARGET 1: 121
TARGET 2: 124
TARGET 3: 128


ETHBTC Price analysis - TARGETS? Hi guys,seem like market formed an Ascending Triangle Pattren and breaked in bullish way as Ascending triangle is bullish continuation pattren, we predicted the targets as per pattern and our strategy.
We found a strong support and resistance from previous year around 0.0535 BTC and as per per condition market would not able to break the resistance of 0.0535 BTC. So as per our given targets markets may go till their and you can book your profit as per targets.

ETH-BTC 4H Chart MorningstarETH-BTC 4H Chart Morningstar. Also spotted in ETH-USDT. Let's see if it pushes up.
Targets
0.039
0.040

ETHUSD - BREAKOUTBuy Price: Green Zone
SL: Below Red Line
Profit: Blue Zones
Invest Suggestion: 20 Percent
Profit Expectations: 10 - 45 Percent
Looking at the chart of ETH , we could see all technicall indicators pointing to buy it , like MACD lines crossed , EWO green and the HMA 13 crossed all others HMA's and we have volume! Also, we have a triangle in the weekly chart, showing to us a triangle reversal pattern, another call to us.
ETH has a lot of new fundamentals news, like the hard fork on 14th January and the news about the plans to cut its absurd energy consumption by 99%!
So, feel free to but it in the region of 140$-153$! Remember that's a short-mid therm call!!
See me previous analysis and how profitable the are!
Sell when you get some profit, according the way you trade.
Keep following us and please like this idea.
Any doubts? Send in the comments or in our telegram or Inbox here.
Thanks for visiting.

ETH: Ethereum Bullish Triangle 50% Move !!Ascending triangle Bullish Pattern-
You Can Also set Own Risk reward.
Let see what Will be Next Move.
Warning- I m Not a Financial Advisor this idea Only For Educational Purpose Only.
Thank You !!


[EthBtc] Why 6 to 9 december are magic days for this ratioIf you are looking for proof of the existence of cycles into the markets, this chart should help you to find the magic.
You will find more on my new telegram channel:
t.me
Per Aspera ad Astra
Roy Reale

Ethereum (ETHSD) Closed ETH long for over 10% profit. Now short.The last trade I longed ETH and ETHBTC for over 10% return. ETH actually had a 19% pump, verifying my prediction that an ETHUSD long would be better than a BTC one. Check out that idea in the related section.
Now that it has hit resistance, I will be shorting. I believe Bitcoin will break down to test 3700, so an ETHUSD short will outperform a BTCUSD one.
Thanks for viewing!

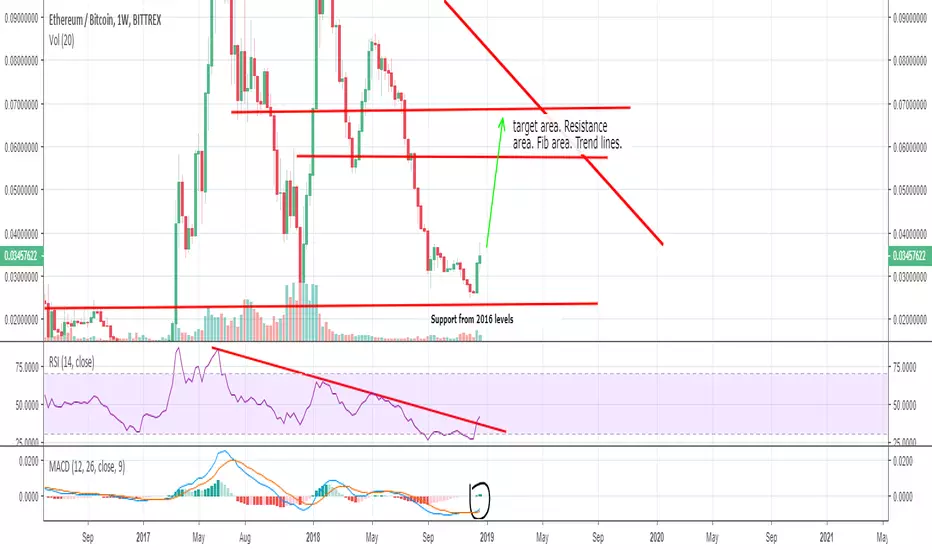
ETH/BTC Just the beginningIf you recall my last ETH/BTC post, it recommended going long at .03 for a longer term hold. the trade is in profit right now, but we still have a ways to go. there are a lot of different ways this could play out. With Constantinople coming out I anticipate we will get a massive move here at the first of January. We'll be targetting this .06 level and possibly the .07.
On the weekly chart MACD is starting to climb, RSI is bouncing off it's low indicating a move further to the upside is in the cards.
Happy Trading/hodling,
-Sherem
Position QHF 28.12.2018After the candlestick fixation of the model "wedge" abroad, buy with a target of 0.042.
