ETHBTCSHORT

No words neededETH at strong resistance with bearish divergence, very beautiful setup for ETH short 1:5 ratio


ETH BTC THOUGHTS$ETH - $BTC
Not looking good at all. If we lose the POC level that we're currently at, the next area I'd be interesting in longing is at 0.0108. Be careful.

ETHBTC opportunities aheadred line on chart has turned from support to resistance (for the time being). looking for a drop down to the first green box and if that does not hold, could see more downwards movement to the second green box; both areas would be good opportunities.

Worst Case Scenario for ETH/BTC Pair!!!This could be one of the scariest scenarios for ETH, according to TA a descending triangle projects a target measured from the top of the triangle down to the base. That distance measured, is subtracted from the base down to the projected target. If this descending triangle does come to fruition, ETH could drop down to ~0.0038 sats...

ETHBTC BREAKDOWN !!!ETHBTC is going to start a huge breackdown as MA crossings, divergence and aroon are all bearish!
BTC dominance is also increasing, meaning alts will suffer for now, and so ETH will.


ETH BTC SHORT$ETH $BTC
If it can't reclaim the POC as support, and $BTC ends up breaking upwards even further (10K mania), I think it's reasonable to think we could test the bottom of the range again at green.

LONG ETHBTC Latest technical Analysis 220% Target projection.I have Explain Each and Everyone thinks on Chart Read Chart properly and Make Decision.
Note: This is only for Educational Purpose this is not a piece of Investment advice.
Please support the setup with your likes, comments and by following on Trading View.
Thanks
Adil Khan

Trading plan ETH/BTC and ETH/USD 4/20/2019The prices of ETH is in a very difficult correction.
Wave-map and key support / resistance levels.

ETH - Can it eat dust or roar?Hello Friends,
#ETHBTC is making a good triangle formation on daily Patter.
Watch the chart, the probability is generally 50-50, so watchout for the breakout of the triangle, it can be either side.
And trade accordingly. Anyway, I will keep you posted when it breaks out.
#BTC, #ETHBTC, #ETH #eth
----------------------------------------------------------------------------
Checkout my signature.

Toileth sewn ded. Toileth hovering 2 long.
From past experience, + hunch + markets + total Mcap + VitalikClapping.gif + 0 news + HF + limbo .
Yeah.

$ETH in big BULL trap! BECAREFULI put all the comments on the chart.
Look forwarding to any comments.
Happy Trading!

ETHBTC latest technical analysis 125% Target We are doing Analysis of ETHBTC on Weekly Timeframe .
I have Mention Support and resistance levels on Chart
Note: This is only for Educational Purpose this is not an Investment advice.
Please support the setup with your likes, comments and by following on Trading View.
Thanks
Adil Khan

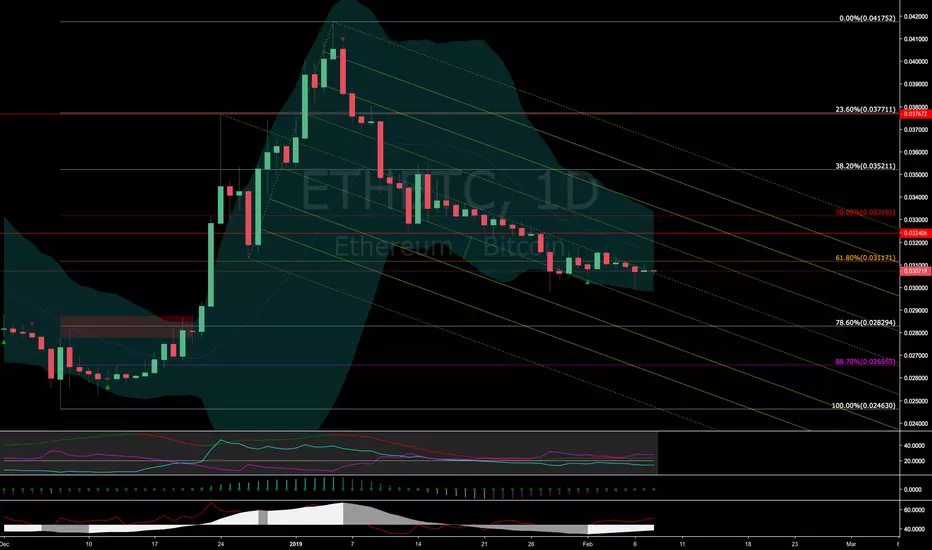
Ethereum - Teetering on shaky ground!Not financial advise. Do your own research. The ideas shared here are the personal opinions of the BitDoctor team. Trade at your risk.
Who loves Ethereum? Whether you love it or you hate it you have to pay attention to it. Typically Ethereum shows signs prior to a major market move. It's sort of like the precursor to big Bitcoin moves. I like to watch some of the bit btc trading pairs (XLM, ADA, ETH, XRP, etc ) and usually more often than not, they'll make a decent move minutes before BTC does.
Anyhow, let's get down to the meat and potatoes of this:
1. No bullish divergence here at all.
2. Trading right BELOW the median of this pitchfork for weeks and not really sitting on any significant recent support - this is fishy. There was support in this area back in October of 2018, though.
3. On the main impulse which took ETH up 100% against the USD trading pair, we've obviously fallen from there and have retraced well beyond the 61.8% retracement to have that count for any kind of support. It's not anymore.
4. We can find support at the 78.6 which seems the most plausible support level we should be focusing on. It's right where there was prior resistance (the red box) so I would expect that to be the next true support level.
Evaluate the price action there. I expect selling pressure after the Constantinople event . Do yourself a favor, though. Don't trade news events unless you get in early, then make sure you secure profits because trading news is risky and typically you end up losing unless you take profits on the way up.
Trade safely friends!
<3 -CE-
ethusd longETH LONG
STOP LOSS:107.7
TARGET 1: 136
TARGET 2: 142
TARGET 3: 180
TARGET 4: 200.5
TARGET 5: 240.82
SHORT TERM TARGETS IF 113 HOLDS(STOPLOSS)
TARGET 1: 121
TARGET 2: 124
TARGET 3: 128


ETHBTC Latest Technical AnalysisWe are doing Analysis of ETHBTC on Daily Timeframe .
ETHBTC Following Symetrical Triangle pattern break down .
I have Mention Support and resistance levels on Chart
Note: This is only for Educational Purpose this is not an Investment advice.
Please support the setup with your likes, comments and by following on Trading View.
Thanks
Adil Khan

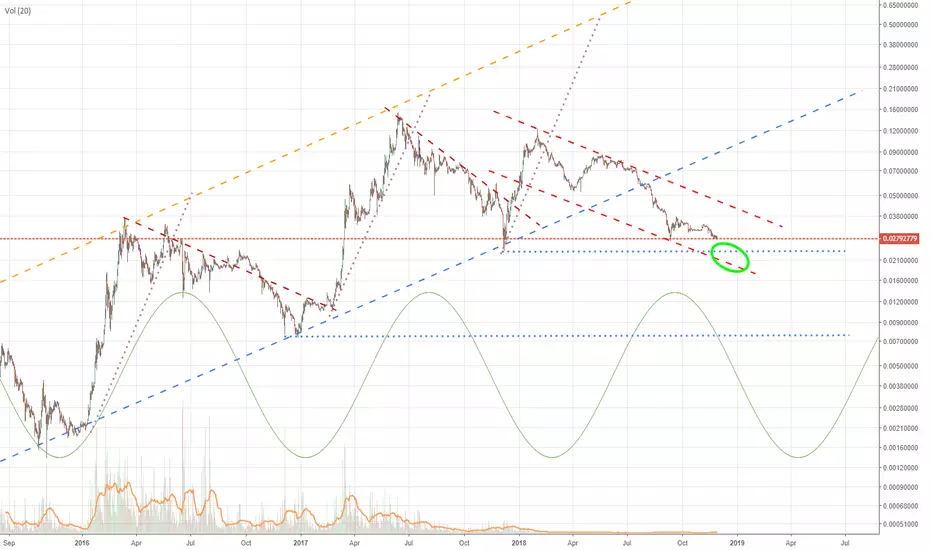
Ethereum long term chart, medium term channel Ethereum/Bitcoin pair, fifth impulse wave terminated well below the target in the channel exhibiting a lot of weakness, at least one more wave down likely to bottom of channel and support, good short opportunity to .024-.02 btc

ETHBTC Bulls CommingWe are doing Analysis of ETHBTC on Weekly Timeframe .
I have Mention Support and resistance levels on Chart
Note: This is only for Educational Purpose this is not an Investment advice.
Please support the setup with your likes, comments and by following on Trading View.
Thanks
Adil Khan

Etherium could see a decent pullback on higher time frameEtherium is reaching key resistance level marked within the red block, R/R is real good for a short opportunity once etherium trades within the bearish orderblock
