ETHUSD - Ethereum IdeaAn idea for Ethereum showing a large rounded structure forming above a stronger trend line
A down channel has also formed within this larger structure and I expect a very strong recovery from this channel at $1500 which we are close to.
Rounded structures usually break out bullishly when done.
Ether

A Giant Rising Wedge on ETHHello Traders,
A giant rising wedge can be seen on the weekly TF.
Invalidation level would be ~$2142. IF it can break and retest this as support, then this idea will be invalidated.
Please hit the boost button and follow me for more ideas.
Thanks

This is why i believe we are in for a -78% correction ETHUSDHello Crypto friends! SMASH THAT LIKE AND FOLLOW BUTTON then continue to read on!
I hope all of you are having a wonderful day as i am going to share a chart with you that i believe will transpire in front of us within the next month and a half.
Why would i believe LiquidMEX on such a bold call like this?
You would believe a call like this because i have year after year dating all the way back to 2017-2018 calling/predicting massive sell offs and calling/predicting massive up moves with sniper like accuracy on taking profits at the TOP! Check my catalog of charts on my profile to see the proof for yourself and i will also leave a few charts tagged to this one.
Why would ETHUSD drop -82 like your showing on the chart that it will?
Look at the high ETHUSD reached Monday November 8th 2021. At the ATH of ETHUSD we dropped -82% in a span of 224 days the bottom being $879 on June 16th 2022. Now take a look at April 14th 2023 when we reached the micro high at $2,157. Taking a date range tool from the micro high at $2,157 and sending it 224 days from that high brings us to the date of November 26th 2023 which is where i believe we will see the bottom of ETHUSD.
What are the most CRITICAL support levels to watch for?
Glad you asked, i have made this very simple to understand using the horizontal ray tool.
KEY SUPPORTS
1. $1,622
2. $1,368
3. $1,076
4. $879 CRITICAL
5. $368 BOTTOM
THE BEARFLAG
The bear flag is identified as a period of consolidation after the completion of prices initial decline. During this period, prices may slowly channel upward and retrace a portion of the initial move. At this point traders will wait for price to break to lower lows in the direction of the trend.
CONCLUSION
Summarizing everything you have just been told i expect the bottom of not only ETHUSD but also Bitcoin to be reached by or very close to the date of November 26th 2023.

ETH price under $500I hope I'm wrong, if not I want to buy a lot of ETH below $500, happy trading and hope for some comments.

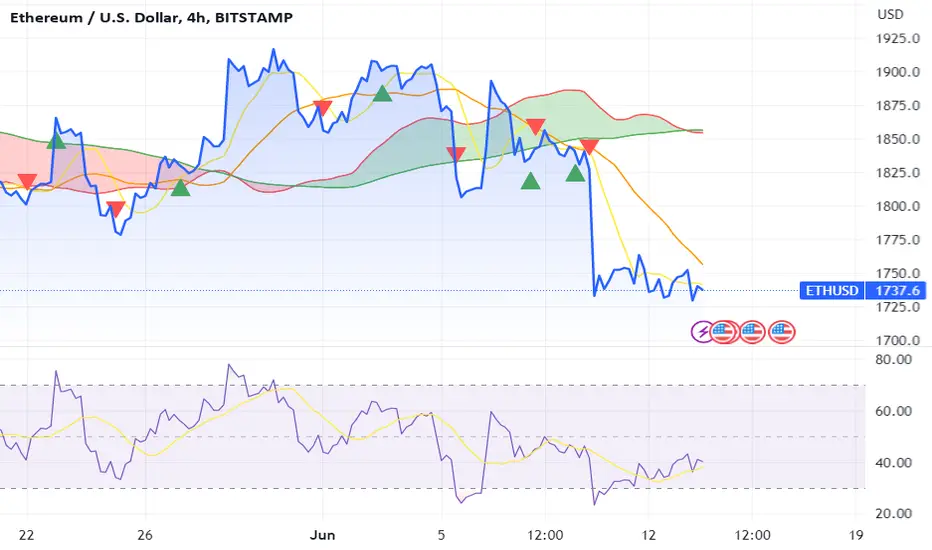
Ethereum Road Map🗺️!!!(4-hour time frame⏰)Hi everyone👋 (Reading time less than 3 minutes⏰) .
Today I want to show you the 🗺️roadmap🗺️ for Ethereum for the next 7 days in the 4-hour time frame using the Elliott wave theory.
Ethereum has started to form corrective waves after the completion of five impulsive waves; one of the signs of the beginning of corrective waves is the formation of the Head and Shoulders pattern .
Since the main wave A has 5 microwaves, I expect a corrective structure ahead of Ethereum Zigzag(ABC/5-3-5) .
Ethereum has managed to complete the main wave B in the 🟡 Price Reversal Zone(PRZ)-($1,918-$1899)🟡 (One of the signs of the completion of the main wave B is the breaking of the support line).
🌐 News 🌐: Vitalik Buterin Linked Wallet Invested 2013 Ethereum in OKX! Is it a Bearish Signal❗️❓
An address associated with Lookonchain Ethereum founder Vitalik Buterin said it has invested 2,013 ETH (worth $3.76 million) in OKX.
I expect the main wave C to finish near the support line and inside the 🟢 support zone($1,780-$1,750) 🟢.
📚 Educational Tip 📚: One of the signs of confirming the wave count is that wave A basically goes down to the end of wave 4 .
If we look at the ETHBTC chart, we will realize that if the cryptocurrency market falls, Ethereum will be more affected by this fall than Bitcoin.
For more information, I recommend you to read the following post.👇
Ethereum Analyze ( ETHUSDT ), 4-hour time frame⏰.
Do not forget to put Stop loss for your positions (For every position you want to open).
Please follow your strategy, this is just my Idea, and I will be glad to see your ideas in this post.
Please do not forget the ✅' like '✅ button 🙏😊 & Share it with your friends; thanks, and Trade safe.

ETH going sideways ETH seems to look for a direction and will probably follow BTC's next move. On the upside if we hold the 1865 livel we could bounce to 1925 where we have a big resistance. On the downside if we break down the box at 1840 look for 1770. NFA

Negative Money Flow Index for ETH - Explore AlternativesI write to you with caution regarding Ethereum (ETH) and its current negative dropping Money Flow Index (MFI).
As many of you know, the MFI is a popular technical indicator used to measure the strength and direction of money flowing in and out of an asset. It provides insights into market sentiment and can help identify potential buying or selling opportunities. Unfortunately, the recent MFI trend for ETH has raised concerns and warrants our attention.
Over the past few weeks, ETH's MFI has shown a consistent negative drop, indicating a significant outflow of money from the asset. While market fluctuations are common in cryptocurrencies, it is crucial to acknowledge this downward trend and consider its implications for your investment strategy.
Therefore, I urge you to step back and reevaluate your portfolio allocation, especially regarding ETH. While Ethereum has undoubtedly been a pioneer in the blockchain space and has witnessed remarkable growth, it is essential to remember that diversification is the key to long-term success in any investment venture.
Given ETH's negative dropping of MFI, I strongly encourage you to explore alternative asset classes within the cryptocurrency market. By diversifying your holdings, you can mitigate risks associated with a single asset's performance and potentially capitalize on emerging opportunities elsewhere.
Consider allocating a portion of your portfolio to other promising cryptocurrencies demonstrating positive signs and growth potential. Conduct thorough research and analysis, considering factors such as market demand, technological innovation, and the team behind each project. This approach will help you make informed decisions and reduce the impact of any adverse trends affecting a particular asset.
Remember, the cryptocurrency market is highly dynamic and ever-evolving. As traders, we are responsible for adapting and staying ahead of the curve. By considering alternatives to ETH and diversifying your investments, you can better position yourself to navigate the market's ups and downs while potentially maximizing your returns.

AT CryptoScan: ETHUSD rally off a baseIt has been a while and previously posted about ETHUSD to take a tumble... yes, it did albeit it took a longer time to get to the downside target. Since then, there has been some consolidation and minor breakouts. The custom MACD and VolDiv indicators in the weekly charts have also had significant crossovers which collectively are signaling the bottoming out of ETHUSD.
Seen in the weekly chart, a consolidation triangle breakout in mid-January 2023 gave the first signal, just below 1600. The second signal came from the range breakout in March 2023, just below 1800. Recently, a retest of the range happened in June 2023 and this retest was followed by a solid break up that brought ETHUSD to 1900.
Given the previous trigger points and admittedly, some skepticism on the validity of ETHUSD comeback, it appears that the tests have been positive and there is a possible real longer term sustainable breakout incoming.
Positioning at the last bounce off, am expecting the technical indicators to turn over up over the next month, and a break above 2000 to Fibonacci upside target at 2400. Candlestick pattern shows the first indication of a solid rally with momentum and needs to continue.
Noted this is the weekly chart for ETHUSD... so ranges are larger, and takes time to bake the cake. 2000 is a critical resistance which will be tested over the next weeks, and watching the outcome would be a really good thing at this point.
Heads up!

ETH Price Soaring with Bullish Flag - Time to ConsiderToday, I bring you exciting news: Ethereum (ETH) has shown a remarkable surge, accompanied by a bullish flag pattern that signals a potential upward trend. This is the perfect opportunity to consider adding ETH positions to your portfolio!
Over the past few weeks, ETH has been on an impressive upward trajectory, outperforming numerous other cryptocurrencies. However, what truly sets it apart is the recent formation of a bullish flag pattern. For those unfamiliar, a bullish flag is a technical analysis pattern that indicates a brief consolidation period before a potential continuation of the previous upward trend. This pattern often precedes a significant price surge, making it an exciting time for traders like us.
The recent surge in ETH price, coupled with the bullish flag pattern, suggests that we may be on the cusp of witnessing a substantial rally. As traders, we thrive on identifying such opportunities and capitalizing on them. Therefore, I encourage you to consider adding ETH positions to your trading strategy, taking advantage of this potentially lucrative period.
Here are a few reasons why ETH presents a compelling investment opportunity:
1. Ethereum 2.0 Upgrade: The much-anticipated Ethereum 2.0 upgrade is set to revolutionize the network, enhancing scalability, security, and efficiency. This upgrade has been a long time coming and is expected to attract increased adoption and investment in the Ethereum ecosystem.
2. DeFi Boom: The explosive growth of decentralized finance (DeFi) has driven ETH's recent surge. As the backbone of the DeFi ecosystem, Ethereum has become the go-to platform for innovative financial applications, attracting significant investor interest.
3. Institutional Adoption: The interest and involvement of institutional investors in the crypto space have been steadily increasing. With prominent institutions recognizing the potential of cryptocurrencies, including ETH, we can expect a surge in demand and subsequent price appreciation.
Now is the time to seize the moment and consider adding ETH positions to your trading portfolio. However, as with any investment, conducting thorough research, analyzing market trends, and managing risk is crucial. Stay informed, closely monitor market indicators, and make informed decisions to maximize your potential gains.
Remember, opportunities like these only come knocking sometimes. By staying ahead of the curve and embracing the bullish flag pattern, we position ourselves for potential profits in the ever-evolving world of cryptocurrencies.
So, what are you waiting for? Take action now and consider adding ETH positions to your trading strategy. Take advantage of this exciting opportunity to ride the wave of Ethereum's upward momentum!

Ethereum ETH potential rally with the Stock MarketCryptocurrencies were left behind by the recent Stock Market rally.
With the arrival of new BTC Bitcoin ETFs, I expect the Crypto Market to follow!
ETH/USDT prediction
Entry Range: $1800 - 1900
Take Profit 1: $1950
Take Profit 2: $2010
Take Profit 3: $2100
Stop Loss: $1730

ETH/BTC Analyze (Road Map, 06/23/2023)!!!🗺️First, let's see what the ETH/BTC chart is advantage :
It shows us whether to invest in Bitcoin or Ethereum, of course, according to the market cap of cryptocurrencies.
Considering that more than 80% of the tokens are in the Ethereum blockchain . When ETH/BTC is bullish, Bitcoin dominance is bearish, and the total market cap is bullish, we can expect the start of the Altseason .
ETH/BTC is in the form of a zigzag(ABC/5-3-5) corrective structure so that the main wave C is forming an Expanding Ending Diagonal .
I expect microwave 5 of main wave C to finish in the 🟡 Price reversal zone 🟡 and 🟢 heavy support zone 🟢.
Ethereum/Bitcoin Analyze ( ETHBTC ), Daily time frame ⏰.
Do not forget to put Stop loss for your positions (For every position you want to open).
Please follow your strategy, this is just my idea, and I will gladly see your ideas in this post.
Please do not forget the ✅' like '✅ button 🙏😊 & Share it with your friends; thanks, and Trade safe.

Ethereum ETH price slow as turtle, but stable at a long distanceToday, let's take a look at the prospects for ETHUSDT price movements in the medium term.
On the one hand, over the past week, the ETH price has grown +13%, which is worse than the BTC price +17%.
By the way, here we described our thoughts on the possible movement of the BTCUSDT price
On the other hand, buyers of ETHUSDT we can understand how difficult it is for them now, because the ETH price is now "stuck" in a powerful mirror zone. In 2021-2022, the $1750-2000 zone acted as a reliable support, and over the past calendar year, it has been acting as resistance and not letting it go up.
However, looking at this, as the Ethereum team and holders with investors are actively working to greatly reduce the supply of ETH on the market, we believe that the coin has a bright future.
It is also worth realizing that the current ETH is not the Ether of 2016-2017 or 2020-2021, when its price was multiplying every week. Now, Ethereum's capitalization share is 19-20% of the total crypto market capitalization, and now it is a very difficult task to move the price up by hundreds of %, as it was before, and requires exorbitant investments.
So now Ethereum has moved into the category of a "reliable, low-volatility investment", of course, by the standards of the crypto market.
Now, the main task of ETH buyers is to keep the price above $1750-1806. We consider this price range to be a reasonable one for a medium-term investment in Ethereum.
And the first target where you can sell at least part of your ETH savings is around $2870, which is +60%.
PS:
After the ETHUSDT price manages to gain a foothold above $2000, growth will become more dynamic.
_____________________
Did you like our analysis? Leave a comment, like, and follow to get more

$ETH - Level to Crack$2,150 serves as the ultimate point of resistance for ethereum.
Should we get another rejection here, it will be clear the directional bias moving into the second half of 2023.

Geometry 101 / ETHEREUM If you like geometry, you'r gonna love this chart !
ETH/USD 2016-2023
No indication, no long descriptions, no complex lines, just basic similarity.
The structure we saw between 2016 and 2020 stands before us again.
There is only one difference, a little smaller this time.
Although the time is a little shorter, the structure is the same.
Key levels are 1360-1400$ (support)
>If intensive technical analysis is challenging for you, you can start here :))
Don't worry about how it happens, it's customary in technical analysis. And in my opinion it is also important. See yaa :)

BTC wants $33kLooking for a CRYPTOCAP:BTC pump to BER:33K , this would be an excellent spot to take skin off the table. Pre-halving years do not produce expansive bull markets. This time will be no different - FOMO soon?

Ethereum Analyze [Road map!!!🗺️(06/19/2023)]Hi everyone👋( Reading time less than 2 minutes⏰ ).
Ethereum is moving as I expected in the previous roadmap.✅👇
At the moment, Ethereum has been moving in a descending channel for about 2 months ⏰.
The structure of the waves in the descending channel is Double Three Correction(WXY) .
Ethereum is currently moving in wave Y , and I expect this wave to end at the bottom of the descending channel at around $1500 .
I expect Ethereum to reach its minimum to the upper line of the descending channel after confirming the end of wave Y. However, the downward trend can continue up to the 🟢 support zone($ 1,440-$ 1,350) 🟢.
❗️ Note ❗️: Ethereum needs to break the 200-SMA downwards to confirm the wave count and especially the continuation of the downward trend of Ethereum.
Ethereum Analyze ( ETHUSDT ), Daily time frame ⏰.
Do not forget to put Stop loss for your positions (For every position you want to open).
Please follow your strategy, this is just my Idea, and I will be glad to see your ideas in this post.
Please do not forget the ✅' like '✅ button 🙏😊 & Share it with your friends; thanks, and Trade safe.

Ethereum Analyze [Road map!!!🗺️(04/10/2023)]Ethereum is moving in the 🔴heavy resistance zone🔴; if we look at Ethereum in terms of Elliott wave theory in the Daily time frame, we will find that Ethereum is completing 5 impulsive waves so that the fifth main wave follows the Expanding Ending Diagonal structure.
There are two signs to confirm the wave count:
1 - There is a Regular Divergence(RD-) between the main wave 3 and the main wave 5.
2 - The expanding triangle is mostly seen in wave 4.
I expect Ethereum to finish microwave 5 of the main wave 5 after reaching the 🟡Price Reversal Zone (PRZ)🟡.
Expanding Ending Diagonal structure in the 4-hour time frame (better view):👇
❗️ Note ❗️: If ETH goes over $ 2,120 , the scenario will change.
Ethereum Analyze ( ETHUSDT ), Daily time frame ⏰.
Do not forget to put Stop loss for your positions (For every position you want to open).
Please follow your strategy, this is just my Idea, and I will be glad to see your ideas in this post.
Please do not forget the ✅' like'✅ button 🙏😊 & Share it with your friends; thanks, and Trade safe.

Ethereum will fall like other coins ?!👋🏻 Hello everyone, today we would like to look at the Ethereum chart and possible scenarios.
Now the price is in the support zone, but we have several bearish signals:
1️⃣ Local lowering of highs and lows
2️⃣ The weakness of the entire market and the renewal of all time low on many top altcoins
3️⃣Increase in volumes on the fall
4️⃣Fixing below 50 and 100 daily MA
❗️But on the older time frame, we see a bullish structure and we can now consider this movement as a correction after the 57% rise (from $1370 to $2150).
Expecting that the correction will continue, we can predict the potential zones of the end of the correction as long as there are 2 of them:
🔹$1550 - $1630 (200 Daily MA ; Crossover of 50 and 100 Weakly MA)
🔹$1367 - $1440 (the zone of the beginning of the impulse and the trend line)
❌ Cancellation of the downward scenario will be a quick buyout of Ethereum in the coming days and a fixation above $1860 .Until this moment we would not advise considering longs.
But it is worth noting that the ethereum looks stronger than other alts and if signs of strength appear, we would buy it first in the portfolio.
❓What are your thoughts on Ethereum?

Will ETH push to $1800 with the current level of RSI?I wanted to share some Ethereum (ETH) trading updates with you. While ETH moved slightly higher, it is still trading below $1,800. In today's session, the price of ETH/USD reached a high of $1,757.89, an improvement from yesterday's low of $1,723.09. The recent surge in price was due to bullish activity at a floor of $1,730, with the RSI bouncing from a floor of its own at 38.00.
Per the daily chart, the current price strength is tracking at 39.33, with the next visible point of resistance being 43.00. If the index moves beyond this ceiling, there is a strong possibility that ETH will climb to $1,800.
I hope this information is helpful to you. If you have any questions or concerns, please do not hesitate to comment in this idea.
ETH volatility could start to spike but RSI is lowI am bringing to your attention the current state of Ethereum's price trend. As of now, Ethereum has been experiencing a notable downward trend in price when observed on a daily timeframe chart. It is currently trading at approximately $1,740, which reflects a decline of over 5%.
It’s becoming increasingly evident that Ethereum is experiencing a bearish trend in the market, as indicated by its RSI dropping below 40. To add fuel to the fire, the current volatility level of Ethereum is at a measly 0.01%. If you're a Bitcoin trader, it's time to pay attention and make informed decisions accordingly. Check out Furthermore for more insights.
Additionally, the Bollinger Band analysis indicates that ETH is currently experiencing a certain level of volatility. However, the band's elasticity suggests that the current volatility is relatively minimal.
I hope this information is helpful to you. Please let me know if you have any questions or concerns in the comments.

ETH Head & Shoulders!KUCOIN:ETHUSDT
ETH has had an impressive run to 2140.
Pullback sits currently at 1874 and in a Head & Shoulders.
Break of Neckline will possibly provide short ideas with target ideas to 1690, 1520, 1370 zones.
If the Neckline does not break and volume sets in go long - for targets see my 18-Apr ETHUSDT post
with this chart: www.tradingview.com
Always having Plan A and Plan B scenarios so we can react once the markets provide an opportunity to execute our edge.
If you liked this idea or if you have your own opinion about it, write in the comments.
The information and publications are not meant to be, and do not constitute, financial, investment, trading, or other types of advice or recommendations.

ETH Ethereum Head and Shoulders Bearish Chart PatternIf you haven`t sold Ethereum here:
Then you should know that Ethereum, currently trading at $1841, has formed a head and shoulders pattern, indicating a potential bearish trend. This pattern consists of three peaks, with the middle peak forming the head and the other two forming the shoulders. The neckline, a key support level, must be closely watched as a break below it may trigger a further price decline.
While the target for the head and shoulders pattern suggests a larger drop, attention should also be given to the 200-day moving average support at $1620. This level has historically served as a significant support zone. Traders and investors should monitor Ethereum's price movement closely to gauge whether it reaches this support level.
In summary, the emergence of a head and shoulders pattern in Ethereum signals a bearish sentiment. Traders and investors should exercise caution, closely track the neckline support, and keep an eye on the 200-day moving average as a potential support level.
Looking forward to read your opinion about it.

ETHUSD - Top Cap IndicatorUsing the Top Cap indicator to plot the next bullrun
each bullrun the top cap is touched or nearly touched
I think the previous bull run was just a taste of what we are yet to see on ETHUSD
Bars patterns show my thoughts
Daily Chart
