ETH/USDT | ETH Under Pressure – Watch $3500 Support!By analyzing the Ethereum chart on the weekly timeframe, we can see that after reaching the $3940 zone, ETH faced selling pressure and is now trading around $3540. If the price fails to hold the key $3500 support, a deeper decline is likely, with potential targets at $3040 first and possibly $2680 as the second bearish target.
Please support me with your likes and comments to motivate me to share more analysis with you and share your opinion about the possible trend of this chart with me !
Best Regards , Arman Shaban
Ethereum (Cryptocurrency)

ETH 1H – Trendline + Demand Zone Converge, Will Bulls Step In?Ethereum is approaching a high-confluence zone on the 1H chart — where rising trendline support intersects with a prior demand zone that triggered the last major rally.
This area around $3,500–$3,430 represents a key test of short-term momentum and trend structure.
🔹 Technical Confluence
Strong ascending trendline from mid-July has held through 3 clean touches — and is now under pressure again.
The blue demand zone was the launchpad for ETH’s move toward $3,800, showing clear price memory.
Price is now approaching both zones while momentum is fully reset on the Stoch RSI.
🔹 Momentum & Setup
The Stoch RSI is hovering in oversold territory — just as ETH returns to structure.
A higher low in this zone would confirm buyer interest and setup a potential breakout toward $3,900+.
🔹 Scenario to Watch
A clean bounce + reclaim of local structure would confirm a bullish continuation setup.
Failure to hold this level could trigger a trendline break and deeper retracement — invalidating short-term bullish structure.
Will ETH defend this zone and continue the trend — or is a breakdown brewing?
Let me know your thoughts in the comments 👇

BCH May Be The Next MYX - 5-10x Coin TL;DR – BCH is lining up a classic supply-shock + utility-boom setup.
Halving has already cut new coins 50 %, while CashTokens + May-25 upgrade unlock real smart-contract demand. Fees are still < $0.01 so merchants keep onboarding, and Wall-Street-backed EDX just gave institutions a clean on-ramp. With on-chain volume at multi-year highs and regulatory clouds clearing (CLARITY Act), even a modest uptick in adoption can squeeze a float that’s shrinking fast. Add it up and the 10 factors below paint a clear path for BCH to re-rate well beyond current levels.
Post-halving supply squeeze – The 2 April 2024 halving cut block rewards 50 % to 3.125 BCH, slashing new supply while demand stays constant.
May 2025 protocol upgrade – Adds VM Limits & BigInt, letting devs deploy more complex smart-contracts directly on BCH.
CashTokens layer live – Since May 2023, anyone can mint fungible tokens & NFTs; 26 000+ tokens launched in the first 24 h.
Institutional on-ramp via EDX Markets – Wall-Street-backed exchange lists BCH next to BTC & ETH, unlocking RIA and pension flows.
Ultra-low fees (< US $0.01) & 32 MB blocks – Makes BCH practical for point-of-sale payments while BTC fees hover near US $2.
Growing merchant footprint – BCH ranks #4 on Crypwerk; BitPay shows alt-coin check-outs (inc. BCH) now 36 % of crypto payments.
On-chain activity surging – Daily tx count ~53 k; social buzz has pushed BCH to new 2025 highs, signaling fresh interest.
Regulatory clarity coming (CLARITY Act 2025) – Likely to classify many tokens as commodities, reducing U.S. legal overhang.
Re-rating potential – Still 60 % below 2021 high; a modest multiple expansion on revived fundamentals could move price sharply.
Positive momentum & analyst targets – After reclaiming US $600, several desks now project a move toward US $1 000 this cycle.
Marty Boots | 17-Year Trader — smash that 👍👍, hit LIKE & SUBSCRIBE, and share your views in the comments below so we can make better trades & grow together!

Ethereum (ETH/USDT) – Midline Break Retest and Channel Top in Si🔍 Technical Overview
Ethereum has recently broken above the midline of its descending channel, indicating a potential bullish shift within the short-term corrective structure. The price action suggests that we are currently witnessing a retest of the broken midline, which is now acting as dynamic support.
This behavior is consistent with smart money principles — where a previously broken internal structure gets tested before continuation.
⸻
🧠 NEoWave Context
Structurally, ETH appears to be developing a Contracting Corrective pattern, with the current leg likely evolving as Wave D. This wave typically exhibits strength and complexity, often stretching toward the channel top while still respecting broader consolidation boundaries.
⸻
💡 Smart Money Insights
• ✅ BOS already confirmed on LTF (1H, 4H) with higher lows
• 🔄 Price has reclaimed the internal broken structure (midline) and is retesting it
• 🔋 Bullish OB around $3,480–$3,510 acted as a launch zone for current leg
• 📍 Next resistance is the channel top near $3,740
⸻
📊 Trade Scenarios
🟩 Bullish Scenario (Preferred):
If the retest of the midline holds, ETH is likely to continue its move toward the upper boundary of the descending channel (~$3,730–$3,750). This aligns with Wave D expectations in complex corrections.
🟥 Bearish Invalidations:
A breakdown back below $3,520 and loss of the internal bullish structure would negate this short-term bullish scenario and reopen downside potential toward $3,350.
⸻
⚠️ Trader Tip:
Retests of internal structures like midlines or internal trendlines often provide low-risk continuation setups — if confirmed by bullish internal BOS.
⸻
✅ Conclusion
Ethereum remains technically corrective but with bullish momentum building within the channel. As long as the midline holds, we expect continuation toward the channel top, completing Wave D structure before potential reversal.
💬 Drop your alt counts or thoughts in the comments.
Ethereum - Finally new all time highs!🔬Ethereum ( CRYPTO:ETHUSD ) will break out now:
🔎Analysis summary:
For more than four years, Ethereum has overall been moving sideways. However now Ethereum is once again retesting previous all time highs and preparing a bullish breakout. Multiple retests are generally considered bullish so the breakout is very likely to happen any time soon.
📝Levels to watch:
$4.000
🙏🏻#LONGTERMVISION
SwingTraderPhil

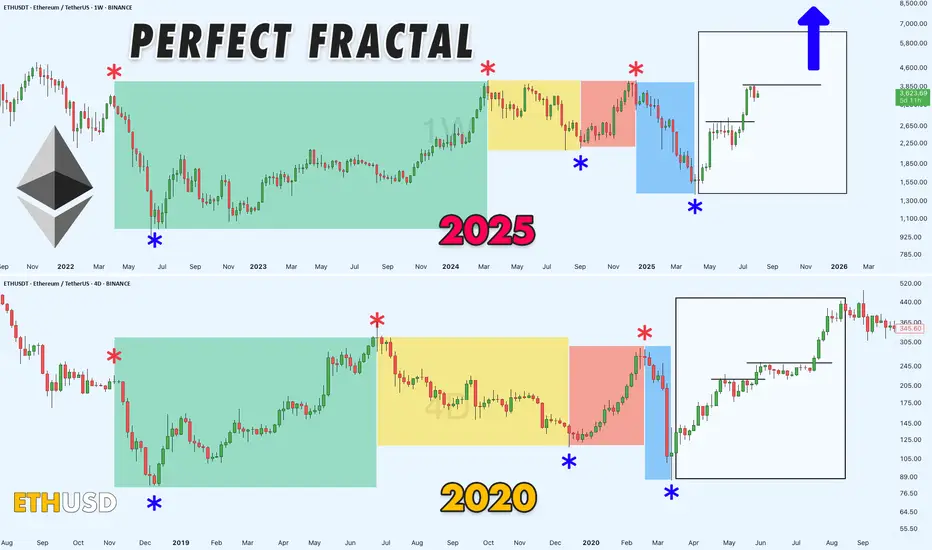
Haven't Posted in a Bit, Here's a Solid Chart for You All!Alright, been a while, but here's the deal: still no altseason in sight.
Meanwhile, ETHUSDT dropping some serious hints of a wild bull run on this fractal chart. It s got that 2020 vibe, though the timing s a tad off especially when you factor in Bitcoin s cycles.
Gonna be a blast watching this play out!
TON/USDT |Toncoin Pullback – Watching for Bounce Toward $4.20+By analyzing the Toncoin chart on the 3-day timeframe, we can see that after reaching $3.73, the price has entered a correction phase and is currently trading around $3.30. We should soon watch for a potential bullish reaction from the $3.03–$3.30 zone. If the next upward move begins, the bullish targets will be $3.74, $4.20, and $4.68.
Please support me with your likes and comments to motivate me to share more analysis with you and share your opinion about the possible trend of this chart with me !
Best Regards , Arman Shaban

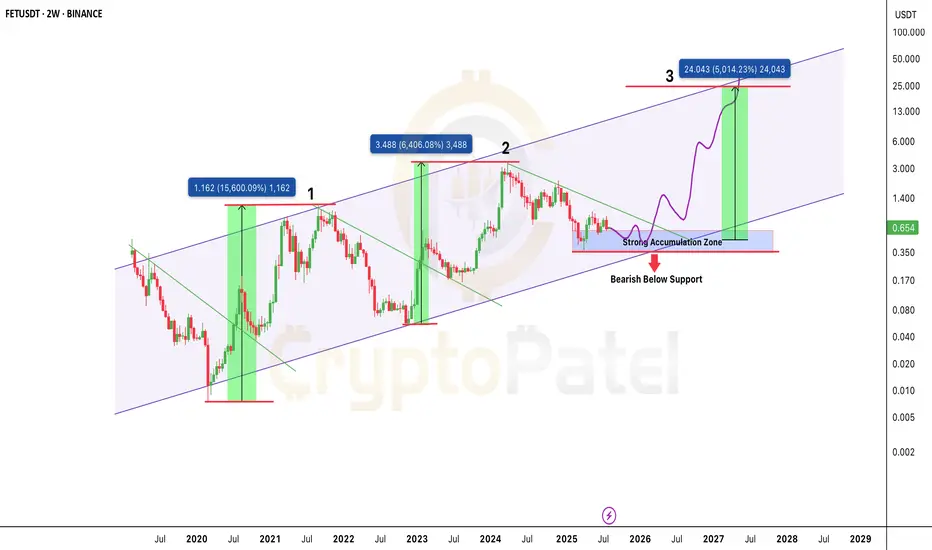
$FET is back in the zone that sparked 15,000%+ rallies?NYSE:FET is back in the zone that sparked 15,000%+ rallies. Same setup. 50x incoming?
FET continues to respect its multi-year ascending channel structure, active since 2020.
Price Action History:
🔹 Wave 1 (2020–2021): +15,600% rally from channel support to resistance
🔹 Wave 2 (2022–2024): +6,400% move following a similar breakout pattern.
🔹 Current Cycle (2025): Price is consolidating in the same accumulation range of $0.35–$0.65.
Key Demand Zone: $0.35–$0.65
Upside Target: ~$24.00 (5,000%+ potential)
🔻 Breakdown Level: Below $0.35 = Structure invalidation
Structure Insight:
Each macro move begins with:
🔹 Accumulation at channel support
🔹 Break of falling trendline
🔹 Aggressive expansion toward the upper boundary
The projected Wave 3 follows this same path if demand zone holds. The structure remains bullish as long as price stays above $0.35.
FET is trading at a high probability accumulation level within a valid macro trend. If history repeats, this could be the next major leg up.
✅ Favor long accumulation strategies
❌ Exit plan needed below $0.35
NFa & DYOR
Important Trend Determination Area: 3708.87-3762.33
Hello, traders!
Follow us to get the latest information quickly.
Have a great day!
-------------------------------------
(ETHUSDT 1D Chart)
The price began to rise after breaking above the important 2419.83-2706.15 area.
This can be interpreted as the beginning of a step-up trend, with an upward breakout of the HA-High ~ DOM(60) range.
The HA-High ~ DOM(60) range corresponds to the 2581.59-2681.60 range.
This suggests that the price is currently testing whether a second step-up trend will continue or whether it will simply end as the first step-up trend.
The HA-High ~ DOM(60) range is currently 3708.87-3762.33.
Therefore, if the price rises above 3708.87-3762.33 and maintains this level through the upcoming volatility period, a second step-up trend is expected.
The conditions for this are as follows:
- The K value of the StochRSI indicator must rise from the oversold zone and show an upward trend with K > D. - The OBV indicator must rise above the High Line and maintain an upward trend.
- The TC (Trend Check) indicator must continue its upward trend. (If possible, it's best to stay above 0.)
The next volatility period for ETH is expected to last from around August 6th to 10th.
However, it's worth keeping an eye on the movements during the BTC volatility period.
-
Thank you for reading to the end.
I wish you successful trading.
--------------------------------------------------
- This is an explanation of the big picture.
(3-year bull market, 1-year bear market pattern)
I will explain in more detail when the bear market begins.
------------------------------------------------------

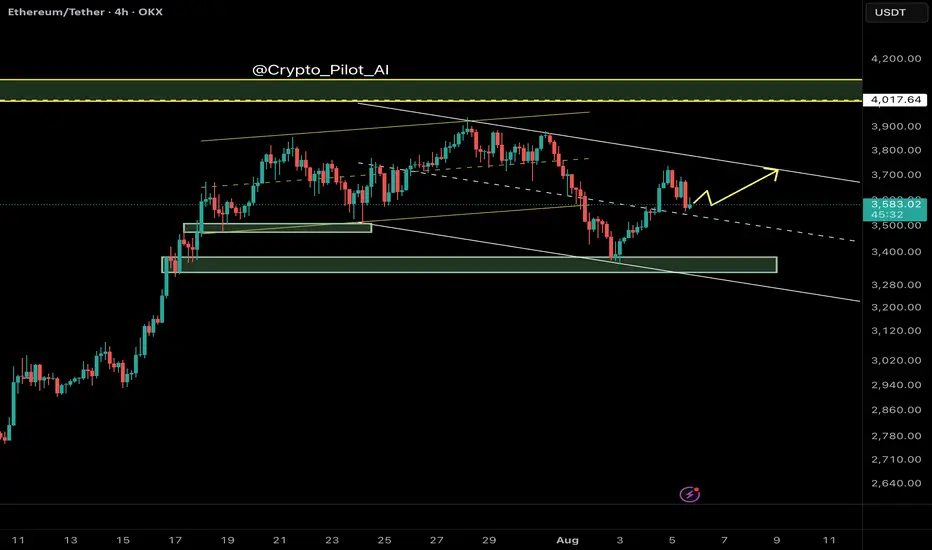
#ETH/USDT : Price is going as expected in previous ideas on eth#ETH
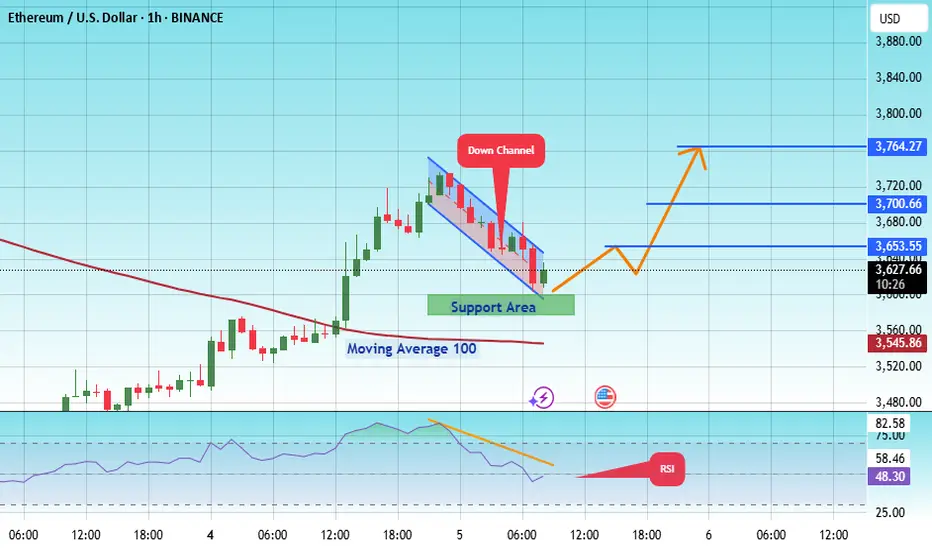
The price is moving within an ascending channel on the 1-hour frame, adhering well to it, and is on track to break it strongly upwards and retest it.
We have support from the lower boundary of the ascending channel, at 3593.
We have a downtrend on the RSI indicator that is about to break and retest, supporting the upside.
There is a major support area in green at 3582, which represents a strong basis for the upside.
Don't forget a simple thing: ease and capital.
When you reach the first target, save some money and then change your stop-loss order to an entry order.
For inquiries, please leave a comment.
We have a trend to hold above the 100 Moving Average.
Entry price: 3626.
First target: 3653.
Second target: 3700.
Third target: 3764.
Don't forget a simple thing: ease and capital.
When you reach your first target, save some money and then change your stop-loss order to an entry order.
For inquiries, please leave a comment.
Thank you.
ETHUSD bullish consolidation supported at 3,485The ETHUSD remains in a bullish trend, with recent price action showing signs of a corrective pullback within the broader uptrend.
Support Zone: 3,485 – a key level from previous consolidation. Price is currently testing or approaching this level.
A bullish rebound from 3,485 would confirm ongoing upside momentum, with potential targets at:
3,800 – initial resistance
3,855 – psychological and structural level
3,930 – extended resistance on the longer-term chart
Bearish Scenario:
A confirmed break and daily close below 3,485 would weaken the bullish outlook and suggest deeper downside risk toward:
3,372 – minor support
3,240 – stronger support and potential demand zone
Outlook:
Bullish bias remains intact while the ETHUSD holds above 3,485. A sustained break below this level could shift momentum to the downside in the short term.
This communication is for informational purposes only and should not be viewed as any form of recommendation as to a particular course of action or as investment advice. It is not intended as an offer or solicitation for the purchase or sale of any financial instrument or as an official confirmation of any transaction. Opinions, estimates and assumptions expressed herein are made as of the date of this communication and are subject to change without notice. This communication has been prepared based upon information, including market prices, data and other information, believed to be reliable; however, Trade Nation does not warrant its completeness or accuracy. All market prices and market data contained in or attached to this communication are indicative and subject to change without notice.

Ethereum is approaching the key level ┆ HolderStatKUCOIN:ETHUSDT is consolidating between $3,368 and $3,866 following a strong impulse move. Sideways range formation and trendline support hint at bullish continuation. Breakout above $3,866 may resume the upward trend toward new highs.

Ethereum PumpingA breakthrough is coming for Ethereum after testing $3800 for the fourth time, with $8000 as the target.

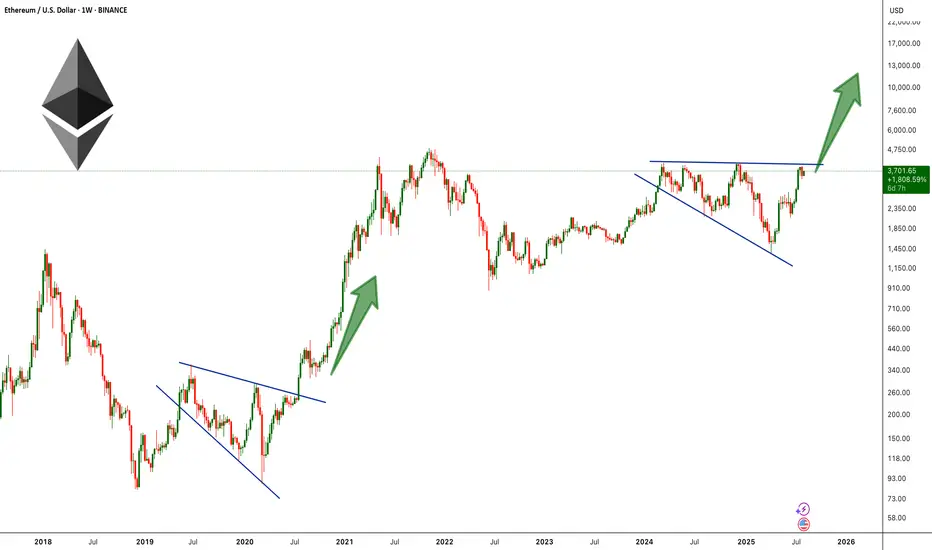
ETH Broadening Wedge Formation !BINANCE:ETHUSDT is forming a broadening wedge pattern on the weekly chart, a structure that often signals high volatility and strong momentum once the price breaks out. This setup is reminiscent of ETH’s 2019–2020 pattern, which also formed as a broadening wedge before breaking to the upside and triggering a historic rally to new all-time highs.
Currently, ETH is pressing against the upper resistance line of the wedge near the $3,900–$4100 zone, a level that has acted as major resistance multiple times in recent months. A decisive breakout above this barrier could ignite strong bullish momentum, opening the path toward the $6,000–$10,000 range.
Cheers
Hexa
ETHEREUM SEASON LOADING!Ethereum appears to be literally following bitcoin's pattern ahead of its 2021 bull run

ETH-----Sell around 3670, target 3600 areaAugust 5th ETH Contract Technical Analysis:
Today, the daily chart closed with a small bullish candlestick pattern, with consecutive bullish candlesticks and prices consolidating at high levels. The accompanying indicator formed a death cross. The price did not break through the previous high on the pullback, so the overall downtrend is still favorable. However, it should be noted that yesterday's pullback interrupted the ongoing downward trend, so this is important to note. The hourly chart showed continued gains during the European and American sessions, while prices came under downward pressure during the Asian morning session. The current candlestick pattern is a series of bearish candlesticks, with the accompanying indicator forming a downward death cross. This suggests a continued upward trend within the next few days, but the strength and impact of the European session remain important to monitor.
Today's ETH Short-Term Contract Trading Strategy:
Sell on pullbacks to the 3670 area, with a stop loss at 3700 and a target at 3600.

EthusdHonestly probably marks up very heavily soon...
We are entering etf bid war phase of the cycle.
Can't even really draw how vertical this chart could go as certain macro economic conditions seem to be brewing...
15k is the predicted target of certain large tradfi firms that are accumulating, bitmine for example.
They are basing their targets from the success of the circle internet groups public listing as well as fundamental factors such as JPMorgan and other institutions launching their own stable coins on ethereum...
Multiple companies rushing to accumulate 5% of the supply while predictions of a 75bps rate cut from the fed are starting to brew...
Supply shock combined with inflationary event aswell as eths successful merge earlier this year are incredibly bullish catalysts and we aren't even at the ath valuations seen last cycle.

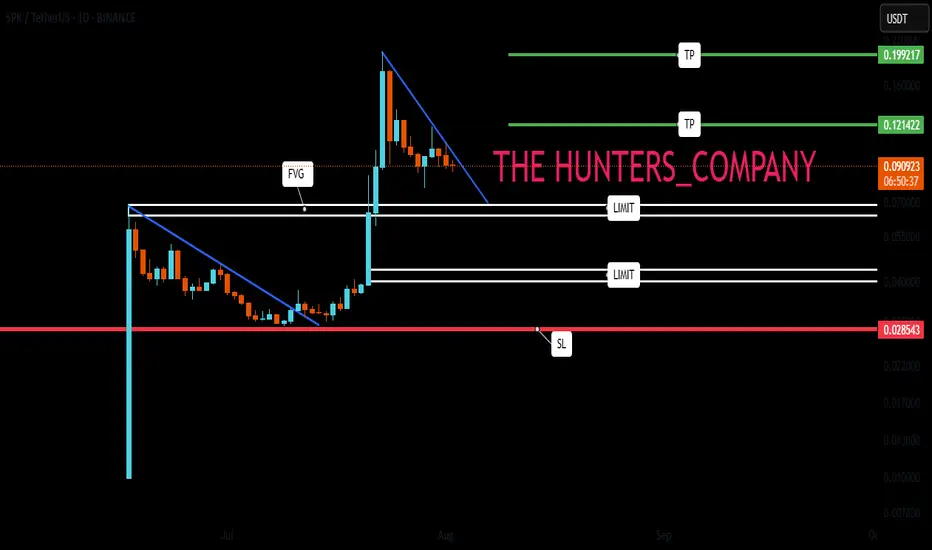
SPK : Does history repeat itself?Hello friends🙌
✅You see that once a pattern was formed and after the resistance was broken, we had a good growth.
✅Now the same pattern has formed again and the price is in the accumulation phase.
✅We have to see if history repeats itself and if the buyers support the price again or not.
✅We have obtained important support areas for you, so that if it falls, you can buy in steps and if the pattern breaks, you can buy in steps right here, of course with capital and risk management.
🔥Follow us for more signals🔥
*Trade safely with us*
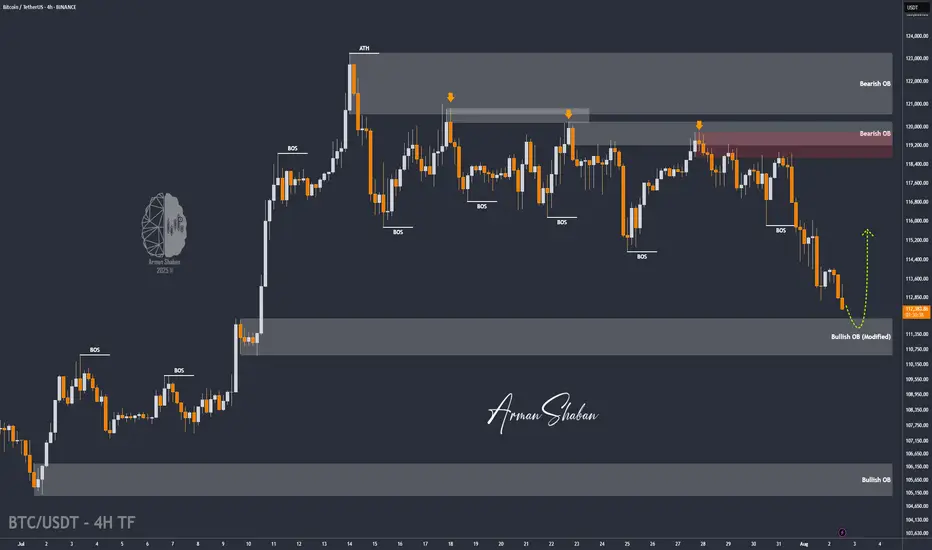
BTC/USDT | Bitcoin Eyes Rebound from $110K Support Zone! (READ)By analyzing the Bitcoin chart on the 4-hour timeframe, we can see that after reaching a new high at $123,218, the price began to pull back and has now corrected down to around $112,500. I expect the current volatility to ease soon. The next critical support zone lies between $110,500–$112,000 — watch price action closely here, as BTC could bounce from this area and push back toward $116,000+. Other key demand zones are located at $109,000, $107,900, and the $105,000–$106,000 range.
Please support me with your likes and comments to motivate me to share more analysis with you and share your opinion about the possible trend of this chart with me !
Best Regards , Arman Shaban
ETH 4H – Demand Ladder Holding Strong, Bullish Set Up?Ethereum has been climbing a ladder of demand zones on the 4H chart — with each major impulse followed by consolidation and a successful retest of prior support. This current pullback has once again tapped into a reclaimed demand area near $3,400–$3,500.
So far, every past structure has acted as a springboard for the next leg up — a pattern that’s held since April.
📊 Key insights:
– Multiple confirmed demand zones stacking higher
– Prior demand flips to support after each breakout
– Most recent pullback held structure with Stoch RSI bouncing from oversold
– Structure and momentum suggest potential continuation if $3,400 holds
A breakdown of this final zone could invalidate the staircase, but until then, structure favors the bulls.
Is ETH gearing up for $4,000+ or finally losing steam?
Drop your thoughts in the comments.

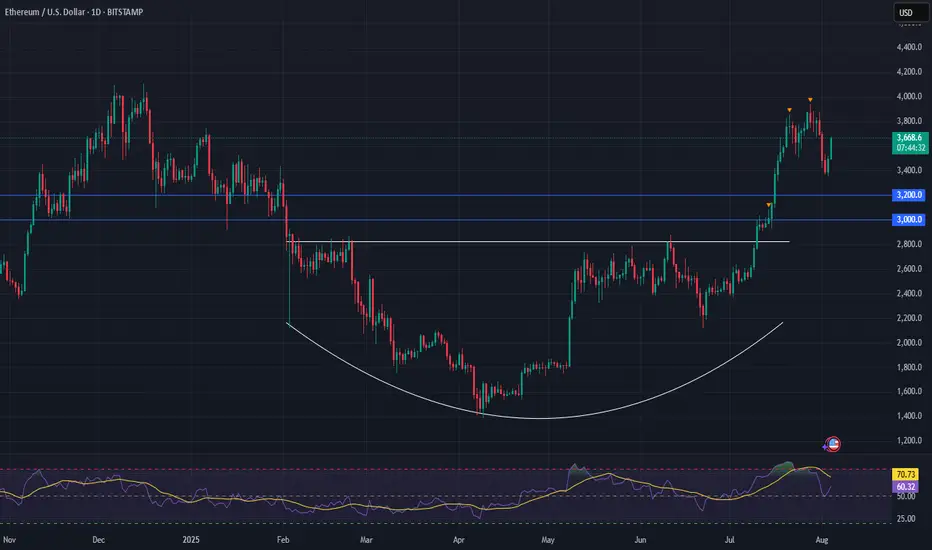
Ethereum (ETH) is setting up for a powerful moveFollowing a strong breakout, ETH has entered a healthy consolidation phase—setting the stage for its next leg higher.
Momentum remains firmly on the bulls’ side, with the breakout from a long-term saucer pattern fueling continued upside pressure.
📈 Technical Highlights:
✅ Short-term target: $4,000+ (breakout continuation)
✅ Long-term potential: $7,000+
🛡️ Key support: $3,000–$3,200 (bullish as long as this holds)
📣 Takeaway:
Ethereum is showing classic bullish structure. With higher-lows forming and strong support below, pullbacks are likely to offer high-probability entries for both traders and long-term holders.
#Ethereum #ETHUSD #Crypto #Trading #TechnicalAnalysis #CryptoTrading #EthereumPrice #Altcoins #Bullish #Breakout
ETH/BTC Golden Cross Ignites
This is ETH/BTC on the daily chart.
The golden cross is now confirmed: 50MA has officially crossed above the 200MA.
Price reacted immediately, jumping straight to the 0.786 Fib level at 0.0347 a key resistance.
This confirms the bullish structure we’ve been tracking:
– Golden cross ✅
– Breakout above 200MA ✅
– Push into major resistance ✅
Now all eyes are on the 0.0347 zone.
If price can flip it into support, momentum could accelerate quickly.
Always take profits and manage risk.
Interaction is welcome.

ETH/BTC: Golden Cross Reloaded?This is ETH/BTC on the daily chart.
A major event is about to unfold: the golden cross, where the 50MA crosses above the 200MA.
The last time this happened was in early 2020, around the same price zone, right after a bounce off the 2019 low double bottom and a rejection from the 0.5 Fib level, which sits halfway between the 2019 low and the 0.786 Fib.
In 2025, we’re seeing a strikingly similar pattern:
– Price bounced off the 2019 low
– Got rejected again from the 0.5 level
– And now appears to be gathering strength to flip that level and the 200MA to confirm the Golden Cross
Always take profits and manage risk.
Interaction is welcome.
