$ETH (Ethereum) ready for 4,000 United States DollarsThis chart is so bullish I can't even believe it.
Check the monthly chart.
Ethereum-bitcoin

Get Ready for the Great Ascension. LeakNot investment Advice. ⬆︎
As you know, we have seen ethereum and bitcoin return to their former levels.
We think all altcoins will approach record levels.
Bottoms will appear with Bitcoin's Retest.
And we will never see these levels again.
Estimated levels
Bitcoin bottoms are 47800-48600-49400-51800-52300-53300.
Our goal is to increase our Ethereum Classic number.
We will buy again at support points.
We say we have increased the number of "Etc" we have.
We are not afraid of manipulators like JP Morgan.
+mining
+macd sales stopped
+grayscale
+jpmorgan
Congratulations in advance to the new rich.
Green = low
orange = medium
red = high

Kusama (KSM) Will Be Heating Up $400 IncomingKusama has been slowly marinating about to cook up. With Polkadot (DOT) trending towards all time highs Kusama will most likely follow in the weeks to come. Kusama has been moving sideways squeezing between $315 - $350 since September 21st and now fighting to bust pass the $370 resistance area . A run up back to the $400 point of control (POC) area will be more probable once a full break past resistance happens. Still a good amount of run up on the RSI as well. We've been on a nice steady uptrend since July 21st. Kusama has a good chance of re-testing its all time highs as well.
Keep Kusama on your radars! There's still a nice amount of room for growth with only a $3 billion market cap compared to Polkadot's $43.3 billion. Only a max supply of 10,000,000 coins!
Support: $315
Resistance: $370
Much peace, love, health, and wealth!

ETHUSD, Break Rising Wedge to 4700 ??Target 1 : > 4200
Target 2 : > 4500
Risk In Your Hand
Press Like & Follow if u like my content
--- Thank You ---

ETH-BTC During Bitcoin SeasonBitcoin is nearing it's all time high again. Assuming Bitcoin season is here, what is the likely path of ETH? For this bitcoin season it looks likely we'll be up in USD on ETH by December. In 2020, ETH doubled while BTC tripled in the fourth quarter. So it also ended up up in USD.
ETH/BTC support lies at 0.055. We'll see if we reach it before ethereum turns around for ETH season. I will keep track of where various points in the channel are as the cycle continues.

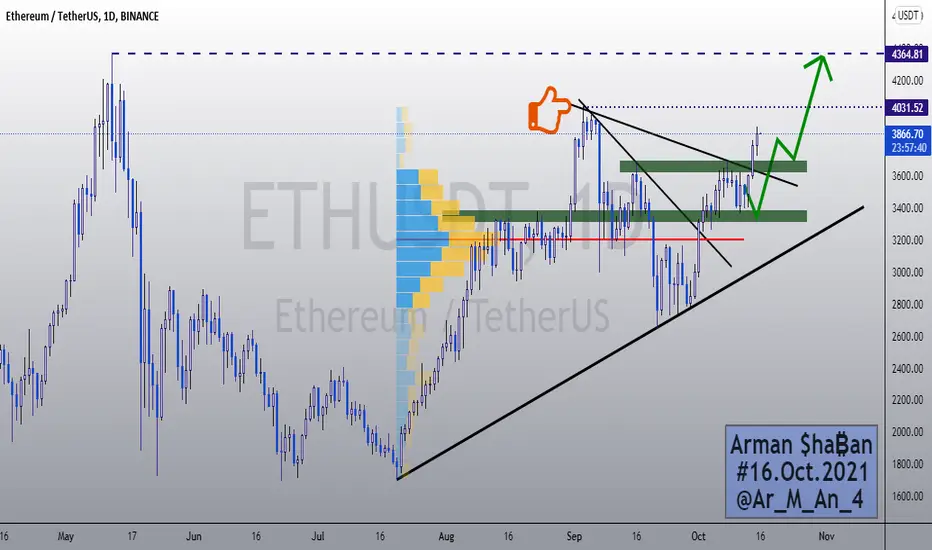
₿ ETHUSDT 1D ₿ : 16.Oct.2021 (Update)Well, as we can see, the price is still moving towards its ATH and the price peak will be reached soon. To find long-term targets, refer to the analysis attached to this analysis ... ETHEREUM will have a $ 20,000 target in the long run.
Long-term Analysis :
⚠️ This Analysis will be updated ...
👤 Arman Shaban : @Ar_M_An_4
📅 16.Oct.2021
⚠️(DYOR)
Our options going forward:Self explanatory.
We need a few pullbacks to heal the RSI but otherwise we are looking incredibly bullish.
Red arrow is much less anticipated than green but its a possibility.

The beginning of alt season?Two things to watch for when we are in a bull cycle waiting for an alt season to begin, are:
- BTC dominance weakening/consolidating after a sharp rise
- ETH/BTC becoming stronger. When ETH starts outpacing Bitcoin, this is generally a sign that we are on the brink of an alt-cycle.
As ETH is currently flirting with the 200 MA and the green support area, this is a pair I'll be closely watching for the coming days.

📍Extremely bullish on EthereumThe 0.61 Fibonacci level is now the minor support for the price.
I would like to see a break of the descending channel starting from the previous all-time high as a sign of bullish confirmation.
Based purely on the structure of the chart, a move up to retest its all-time high is a probable case.
Disclaimer: This is not investment advice. This is for educational purposes only.
--------------------------------------------
Best Regards, Reda Souhail™

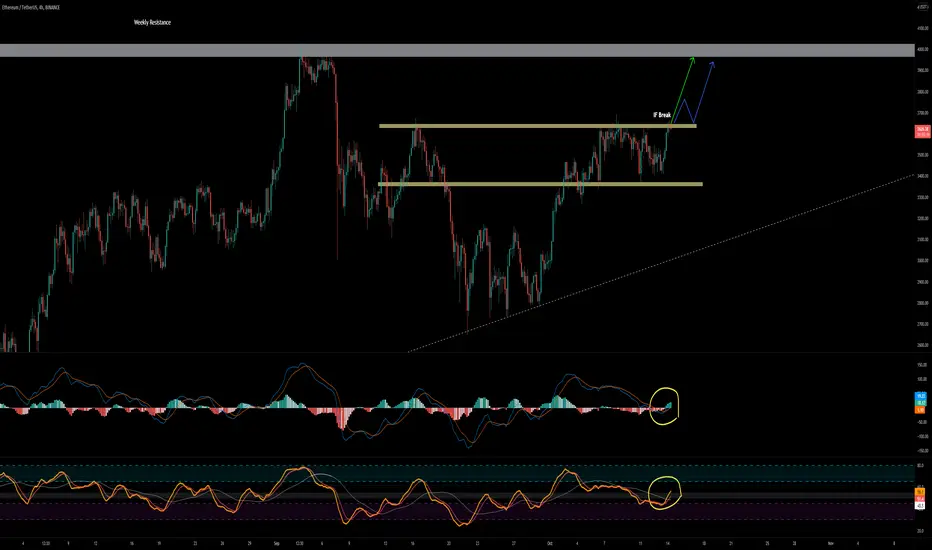
Ethereum (Complete Technical Analysis)Ethereum lost $ 3,500 support during the downtrend, But it continued to be in good demand and is now looking at key resistance at $ 3,650.
Ethereum traded higher at $ 3,634; It then lost $ 3,550 support and fell below the 100-hour moving average.
But Ethereum still seems to be in good demand above the $ 3,350 support level; As the $ 3,375 price floor reached a new uptrend. Resistance levels of $ 3,500 and $ 3,550 were broken. So far, the Fibonacci 50% level has returned to the bottom, falling from $ 3,634 to $ 3,375.
In the ETH / USD pair's hourly chart, the downtrend line, which had created resistance in the $ 3,560 range, has also been broken. ETH is currently trading above the $ 3,550 price level and the moving average.
In the current situation, the price is completely behind the level of Fibonacci 76.4%. We consider the nearest resistance level upstream to around $ 3,600. In the following, the first significant resistance is observed around $ 3,650. Crossing it will probably pave the way for a new upward movement. In that case, it is possible to climb up to $ 3,720. Above that is the key resistance of $ 3,800 ahead.
But if Ethereum is not able to climb above $ 3,650, there is a possibility of a fall. In this case, the first support is expected around $ 3,550.
Key support is currently in the $ 3,520 range and moving average. Any fall above these levels will increase the probability of Ethereum falling to the main support of $ 3,400.
What do you think? Tell me!
Ethereum (Minor Update)Ethereum is unable to hold above the $3600 area and has broken the zone below. The candle didn't close yet, the price might just wick it off. If the candle closes below then we're expecting a drop till $3300 - $3376, which is a strong support level.

Avalanche (AVAX) Looking InterestingAvalanche has been in a downtrend now currently oversold on the daily coming off of recently new all time highs. AVAX looks like its been cooling off. Its about to test the low end of this ascending channel. We'll see if this channel holds. Currently trading under point of control. AVAX is still going to be a strong cryptocurrency this cycle. The Avalanche ecosystem is greatly expanding fast. Keep a look out for AVAX, may be priming to set up for another new all time high if it holds this ascending channel. Cheers!
Local Support Zone: $57.30 - $59.90
Point of Control: $63.75

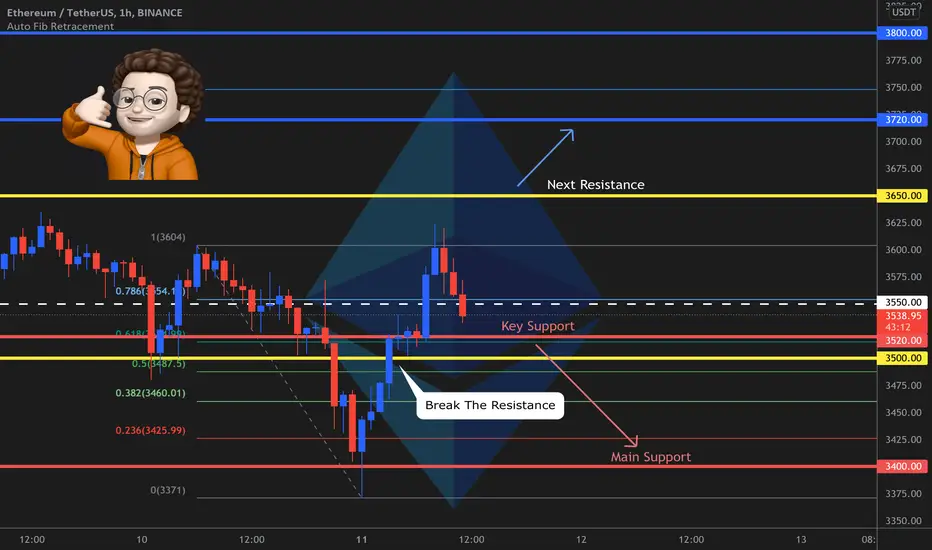
Ethereum (Complete Technical Analysis)Ethereum climbed above $ 3,500 resistance; It is now in a promising position and is likely to climb to $ 3,700.
ETH started a solid uptrend across the $ 3,350 resistance range. As a result, it managed to rise above the level of $ 3,450 and move away from the 100-hour moving average.
Even the $ 3,500 resistance level was crossed; So far, the $ 3,539 peak has been reached and an attempt is being made to dominate the current position. ETH has returned below $ 3,500 during this downtrend and is currently near the 23.6% Fibonacci retracement level of the uptrend from $ 3,275 to $ 3,339.
The ETH / USD pair's hourly chart shows a bullish trend line with support around $ 3,450. The nearest resistance upstream is expected at the same $ 3,500; Above that is the key resistance of $ 3,540.
Crossing the key $ 3,540 resistance will pave the way for the $ 3,700 range. If you go beyond that, there is no specific obstacle up to $ 3,800.
If ETH is unable to break the key resistance of $ 3,540, it may resume downtrend. In this case, the nearest downstream support level is around $ 3,450.
The $ 3,400 range has also become a key support level in this situation. The Fibonacci level of 50% has fallen in this range. With its collapse, ETH is likely to fall to $ 3,375 support and the moving average. The next strong support can be considered around $ 3,320.

₿ XRPUSDT 1D ₿ : 06.Oct.2021 (Update)Well, as we can see in the daily chart of Ripple, the price had started its ascent with the defeat of its downward trend, and now it has grown by more than 15%. If the resistance breaks and the price closes above the $ 1.4 range, we can expect growth up to $ 2 ...
⚠️ This Analysis will be updated ... BINANCE:XRPUSDT
👤 Arman Shaban : @Ar_M_An_4
📅 06.Oct.2021
⚠️(DYOR)

₿ ETHUSDT 1W TF ₿ : 06.Oct.2021 (Log)Well, as we can see, the Ethereum chart is climbing in the weekly timeframe with its dynamic support, and we expect the price to reach our targets if its historical High breaks , which is $ 4372 ... (it is a long-term analysis). The Targets are 7564$ , 12035$ and 19145$ respectively . The chart is in logarithmic mode .
⚠️ This Analysis will be updated ... BINANCE:ETHUSDT
👤 Arman Shaban : @Ar_M_An_4
📅 06.Oct.2021
⚠️(DYOR)

shiba inuelliot wave count approximate on shiba inu
as long as BTC is bullish this is my shiba inu wave count

ETHEREUM SHORT for $600-$900 downtrend momentumETHEREUM liquidity is drying up, and looks like it has just reached one of the key Fibonacci retracement levels, possible short from current levels and then downtrend may continue for $600-$900 downward up to the levels of 2500 or 2400


Ethereum (Update)ETH break the resistance of $3350 and now trading above it. We may see a retest of $3300 - $3350 support before going up.
If Ethereum unable to hold the $3300 area then we see a quick wick towards $3150 support.
The next resistance is $3500 - $3600 and $3900 level.

ETH Targets/Predictions! Currently on my chart you can see horizontal support/resistance lines as well as trends lines all based off of the 4h Binance ETH timeframe. I also have my Trend Fusion indicator overlaid as well.
The huge breakout on ETH occurred whenever it retested its trendline support on Sep 29th and also formed a double bottom. This is when we knew we were started a bullish trend.
Based off of the current price action, I'm looking for ETH to retest support at $3,343. This is strong historical support because it also coincides with the trendline support I drew in pink. If it breaks that support then I'm looking to retest micro support at $3,130 then strong support at $2,965. For a bullish case, I'm looking for ETH's next target of $3,570 before encountering any resistance.
If you have any questions about the lines I drew or my indicator, please comment below or DM me :)

₿ BNBUSDT 1D ₿ : 03.Oct.2021 : +30% ✅Well, as we can see, since the previous analysis, the price has grown by 30% and we were able to get a good return on it. According to a new project recently launched by BNB, we can expect even more growth and soon wait for the price of 600$ for this currency!
⚠️ This Analysis will be updated ... BINANCE:BNBUSDT
👤 Arman Shaban : @Ar_M_An_4
📅 03.Oct.2021
⚠️(DYOR)

Avalanche (AVAX) Looking to Hit $90 Avalanche has been on a rampage and has held up very well since July 21st. Avalanche is currently in price discovery and it has the potential to hit $90 in the coming weeks with the trend it's currently been on. The Fibonacci level of 1.618 is the next destination for price at around $91.
Current Support Zone: $61-$64
Current Resistance: $72.75
