Are You Not Ether-tained?It was just a matter of time before Ethereum could shine again.
With Bitcoin cooling off, that was the perfect scenario for Altcoins and Ethereum to run.
In January, Bitcoin has mostly traded on the downside, while Ethereum has quietly but steadily outperformed. When many DeFi-related coins double or triple in price in a matter of days, Ethereum meager 60% increase over a year may look like a weak performance. But what should be noted, more than the scale, is the consistency. Probably a key factor is a growing demand for Ether, which is facing a shrinking available supply.
DeFi protocols are booming. On the one hand, investors need Ether to cover the transaction fees, which are becoming increasingly expensive due to the network’s congestion. On the other, more Ether are either locked in smart-contract, farming yield, providing liquidity, or supporting the Ethereum 2.0 network’s development.
Bitcoin stopped at the resistance, and Ethereum rebounding on the support could buy a bit more time for the Alt-party.
But gradually take some profit on the way up, as the music can stop at any time when Bitcoin takes centre stage again.
Ethereum-bitcoin

ETHUSD: Bullish BreakoutHello Traders,
It is clear that Ethereum have broken major resistance and will be headed higher. The best thing to do is always wait for a retest of new support to enter a trade. There are two targets for this trade setup. As we have experienced, whenever a crypto assets break their previous all time high, they double in price; BTC, DOT, LINK, UNI, etc. It is highly possible that $2800 is where we will go at the minimum before slowing down.
Let me know what you think.

ETH/BTC Inverse Head and Shoulders breakout! Massive PT.Just a big ol' inverse head and shoulders breakout. The PT is the size of the head from the neckline breakout point. It's officially alt-coin season.
This is not trade advice, this is meant for entertainment purposes only ;)

OXT looks juicy In this kind of setup the pumpamentals are high enough
Rsi is on oversold levels
Pattern making a bull Flag
Needs a breakout
Tried breaking 2 times but retraced
Fundamentally
one of the least market cap on Coinbase
The Recent events pushing for Internet privacy could be a +ve sign for OXT
their vitrual confrence priv8 on march 6 also could be a big blow
Signal
Laddering buys around 0.35-0.36
S/L at 0.28
Tps at 0.42 0.48 0.51 0.77
0.48 to 0.51 i am expecting atleast
will be taking a position of $2000 here and HODL for sometime

Polkadot is Worth Taking a PositionPolkadot has proven itself as a serious contender crypto, moving up to just behind Ethereum to be the 3rd largest crypto (ignoring Tether and Ripple which IMO aren't real cryptos). It's had two huge moves up since December and is now in a sideways flat top consolidation. There's a good chance for a flat top breakout and another move up soon. Even though it's now the 3rd largest crypto it's still quite small at $15B market cap compared to Ethereum at $156B and Bitcoin at $636B. There's a lot of upside potential. It's certainly worth me putting a small position into the crypto to see where it goes.
I bought Polkadot on Kraken which is an exchange that provides staking*. So while I'm waiting for the breakout, I simply selected my position to be "staked" and immediately I'm getting a 12% annual return (paid out in Polkadot twice a week). Try to find that sort of return at your bank or broker. Ethereum can also be staked but it's a functionality in development and has some restrictions. If you were unaware of staking, you should look beyond Bitcoin into some of the newer things happening in crypto today.
I'm not an investment advisor and this is not investment advice. It's just a description of what I'm doing and my thoughts.
----
*Staking is using your crypto to help secure the Polkadot blockchain and validate transactions on the network. In return you get paid in Polkadot. It is related to bitcoin mining on bitcoin, but rather than requiring a lot of specialized mining computers and expertise, anyone can participate.

What will ETHEREUM do NEXT?!I got stopped out of my last trade as mentioned in my latest video coming out today. We appear now to be in an ascending channel and MANY retail investors have jumped in but like I said this could easily crash and take out retail trader stop losses below those latest swing lows. I am not buying here, I am waiting lower for a longer term positional buy because also I still believe we will drop from these resistance areas over the next couple of weeks. For now I prefer to stay out :)

ETH and BTC as a twin asset: Metcalfe's LawAs a network, Metcalfe's law is one way to value $ETH and BTC reasonably well.
Normalizing the price to a zero and 100 percent level is a powerful way to estimate the next price movement.
I put 0 at the lowest and 100 at 2017-2018 all-time high level and extend the Fibonacci lines.
The estimation is ETH at $4200 in the next 4-5 weeks following what bitcoin did.

CountOnCrypto - Ethereum Forecast - 01/02/2021COINBASE:ETHUSD has been performing well in the past week, it has seen a lot of battles due to the extreme volatility of COINBASE:BTCUSD .
As shown on the xRSI_KDJ_SMA indicator, Ethereum appears to be bottoming out, I believe this is a good opportunity to long a retest of the upper resistance.
I will be taking profits between now and the upper resistance line adjacent to the .786 Fibonacci retracement level.
If you trade this please use risk management, I always manage risk with a stop loss or low margin, study the market before you enter any trades or risk your money. I never claim to be 100% accurate, the market can often change direction unexpectedly! My trading strategy accounts for unforeseen circumstances due to my experience and knowledge.

ETHEREUM - Detailed Road Map!Ethereum is overall bullish trading inside the orange channel so we will be looking for Trend-Following Buy setups as it approaches our lower orange trendlines. WHAT NEXT?
SHORT-TERM Road Map:
ETH is now trading above our orange trendlines and below the ATH.
1- First, as mentioned, we will be looking for short-term buy setups around the lower orange trendlines.
2- Then, as ETH approaches our upper blue zone (ATH) we will be looking for short-term sell setups on lower timeframes.
LONG-TERM Road Map:
We have two possible scenarios here.
1- Full Reversal, and yes it is possible since ETH is sitting around its ATH, however, for the reveal to be confirmed, ETH has to break not only the lower orange trendlines downward but also the last swing low as shown in gray area. (projection in red)
2- Trend-Continuation, which we are all waiting for, for the bulls to take full control again, ETH has to break aggressively above the blue zone (ATH), in this case, we will be looking for trend-following buy setups on its retest, around the upper orange circle (purple projection)
Always follow your trading plan regarding entry, risk management, and trade management.
Good luck!
All Strategies Are Good; If Managed Properly!
~Rich

Deconstructing Charts: BITCOIN and ETHEREUM, Ying Yang!!!Hello Trading View Community,
Thank you guys for checking out this idea on BTCUSD . If you find this analysis useful, support us with a simple "Like" or "Follow".
Post your comment, ideas, or questions and check some of our other ideas on BITCOIN below.
Trade carefully and remember these are just ideas, not trading advise.

Ethereum: Time Is Running OutIt's make or break on Ethereum. The structure created was an ascending triangle, butting up against all time high resistance. It certainly is not a value area to be buying.
Ethereum is running out of room, and currently dropping below the ascending triangle demand line, although minor. A trader may play the measured move up or down. Probably the best play is to be long volatility. Most likely, Bitcoin will be the judge and jury of ETH's move.
Speaking of BTC, things don't look good for a trade. The Elon Musk tweet was not enough to sustain prices for a confirmed breakout, which is worrying. I would not be surprised if BTC broke below 30k in time.
If the SPX keeps selling off on Monday, the party could be over and the cash grab beginning with the strange market we currently find ourselves in.

Watching ETH closelyETH currently consolidating under resistance in an ascending triangle (tested three times so far at 2017 all time highs).
Believe we are close to breaking resistance and on to price discovery. Currently long.


Ascending triangle forming on ETHAscending triangle is forming on the 4h chart as you all see. Could there be a potential break to the upside soon? Way above ATHs?

ETHBTC SpikeYesterday BITFINEX:ETHBTC spiked out on the swing timeframes. So far it has held the key level of 0.04 but this could have been the key point of inflection.

Ethereum Breakout Imminent!!!Ethereum is back at highs, exactly as we anticipated in the last report. We told you that it was likely to form a consolidation pattern before another breakout. Sure enough, it appears to be forming a bull wedge. ETH is due for a breakout imminently. All the signs are there. We have consolidation at highs, and the Kovach OBV is quite bullish, suggesting momentum is bottling up. We may have one more retracement before the big breakout but it is doubtful. When we breakout, 1548 will be the next target.

ETHBTC LONG Elliot Wave Push For Wave 5Making my first published idea for you all to critique. Not financial advice here, but i see a potential push up . I have a trade here looking for a 3% to 10%. Stop loss below wave 4.

ETH DEVELOPS AN ASCENDING TRIANGLE!A day ago I told you guys an ascending triangle was possible forming and it looks like it has.I attached my previous idea to prove to you.It looks like it will break out first or second week of February.Ethereums run is just getting started.

POSSIBLE FUTURE FOR ETHEREUM!Ethereum could possibly be forming an ascending triangle.The breakout could be in mid February.I am buying heavily at the lower trendline since it is also close to the 100 MA making it a strong support.Please like and follow for more insightful ideas.

💡Don't miss the great buy opportunity in Ethereum/BitcoinTrading suggestion:
. There is a possibility of temporary retracement to suggested support line (0.0411). if so, traders can set orders based on Price Action and expect to reach short-term targets.
Technical analysis:
. Ethereum/Bitcoin ETHBTC is in a range bound and the beginning of uptrend is expected.
.The price is above the 21-Day WEMA which acts as a dynamic support.
. The RSI is at 63.
Take Profits:
TP1= @ 0.04320
TP2= @ 0.04500
TP3= @ 0.04750
TP4= @ 0.04970
TP5= @ 0.05150
SL= Break below S2
❤️ If you find this helpful and want more FREE forecasts in TradingView
. . . . . Please show your support back,
. . . . . . . . Hit the 👍 LIKE button,
. . . . . . . . . . . Drop some feedback below in the comment!
❤️ Your Support is very much 🙏 appreciated! ❤️
💎 Want us to help you become a better Forex trader ?
Now, It's your turn !
Be sure to leave a comment let us know how do you see this opportunity and forecast.
Trade well, ❤️
ForecastCity English Support Team ❤️

ETHEREUM - CRASH IMMINENT? | BEARISH ASCENDING WEDGE + TARGETS
Bitcoin alt coin decoupling may be happening however market direction is still preserved with the magnitude differing
Hence, since bitcoin is bearish (see idea linked below) and the ethereum chart itself is bearish, it is looking like a crash is imminent
Given the ascending wedge, a breakout out of this formation will trigger the collapse and begin the journey down towards the price targets
We have a minor 61.8% fibonacci swell as a major 61.8 fibonacci
The major fibonacci zone forms confluence with the healthy median trend line dating all the way back to the lows of 2020 and has been tested multiple times
Therefore the first fibonacci target will be a short term target with an expected overall target as the second fibonacci with the trend line at approx. $700
Price may wick or settle even lower at the major volume support zone at $600 but a wick is more likely due to high demand rejecting consolidation here

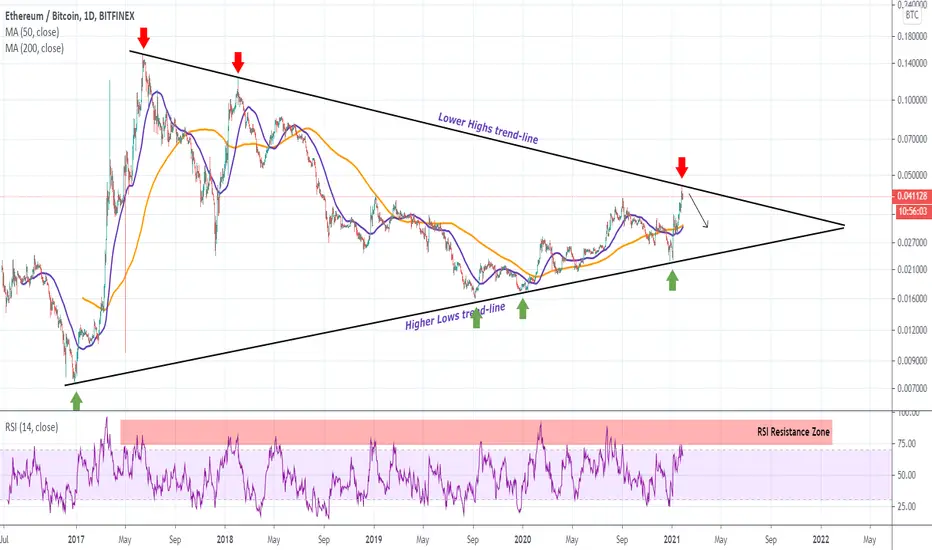
ETHBTC Time for Ethereum to cool off?The greater pattern of ETHBTC has been a Triangle since mid 2017. Yesterday the pair made contract with the pattern's Lower Highs trend-line for the first time since February 03, 2018! Also the 1D RSI is entering its 4 year Resistance Zone. Every time ETHBTC hit those levels, it pulled back to at least the 1D MA50 (blue trend-line).
Is it time? What do you think?
** Please support this idea with your likes and comments, it is the best way to keep it relevant and support me. **
--------------------------------------------------------------------------------------------------------
!! Donations via TradingView coins also help me a great deal at posting more free trading content and signals here !!
🎉 👍 Shout-out to TradingShot's 💰 top TradingView Coin donor 💰 this week ==> michaelzerna
--------------------------------------------------------------------------------------------------------