Pare ETH/BTC when to buyWait for the market to come to you, don't panic buy or panic sell and don't be greedy, make a plan and stick to it.
Ethereum-bitcoin

Major Unbiased Crypto, Blockchain, Bitcoin Move To The UpsideHere's A Weekly Fractal Pattern Measured From Exactly 19 Years Ago to the Pits of 2008. If History Ever Repeated Itself, The Next 2 Months + Could Be Real Nice For The Blockchain As The Value Of The Dollar & Crypto Cap Move In Conjunction As Similar Polarities Repelling Each Other.
To Make It Simple, Dollar Up = Crypto Down
And Vice Versa; Crypto Up = Dollar Down
If This Fractal Pattern Measured With A Fib Retracement Is True, We Are Exactly 50% To The Next Potential Dollar Pit Running The Next 3 Years.
As Each 1 Percentage Point The Dollar Decreased, The Cryptocurrency Market Cap Increased 24% Per That One Point Decrease Of USD. (Measuring The Run Up From March 2020 Bottom To August 31 2020)
As Each 1 Percentage Point The Dollar Decreased, The Cryptocurrency Market Cap Increased 44% Per That One Point Decrease Of USD. (Measuring The Run Up From September 21 2020 To January 4 2021). Since Then The Crypto Cap Saw A Healthy Correction Of 25%
If We Take The Average Of The Two Percentages (24 // 44) We Get 34 Right. If We Apply This Same Logic Or Thesis Of The Dollar Going Down And In Turn Crypto Going Up To The Next Projected Downfall Written In The Fractal Shown In The Snapshot, Potentially We May See A 2 Trillion + Crypto Cap Or A $70-80k Bitcoin In This Next Move.
Take What I Present Or Say For What It Is, Because You Are The Gunner At The End Of The Day.

ETH IS GOING TO GAIN RAPIDLY!Ethereum broke a multiyear very strong resistance.This resistance is very significant.It is now confirming it as support.Please like and follow for more updates.

ETHEREUM - All Time High ETH has recently broken its all time high as Bitcoin has taken a breather since reaching its own new all time high. Just as Bitcoin has retraced, ETH has now dipped around 14% as sellers are taking some profits. Bullish scenario is still in play unless a new major changes take place. We recently sold off to secure some profits and are awaiting new re-entry levels.
Levels we're watching on our 4hr chart:
1. The bottom of our parallel channel in blue (roughly $1190-1230 region)
2. The 200MA line in White (floating around $1100)
3. The golden Fib pocket at $900
Not sure if it would drop any lower if we did see a retrace but anything is possible in crypto as we've seen time and time again. Best case would be to ladder buy at these levels and have some cash ready to go in case we see a panic sell off. (We have limit buys set up around $700 levels in case of flash crash/panic sell off).
Shoot us a like and follow and we'll be back with some updates.
A
Cheers!
Disclaimer:
I do not provide personal investment advice and I am not a qualified licensed investment advisor. I am an amateur investor.
All information found here, including any ideas, opinions, views, predictions, forecasts, commentaries, suggestions, or stock picks, expressed or implied herein, are for informational, entertainment or educational purposes only and should not be construed as personal investment advice. While the information provided is believed to be accurate, it may include errors or inaccuracies. I will not and cannot be held liable for any actions you take as a result of anything you read here.
Conduct your own due diligence, or consult a licensed financial advisor or broker before making any and all investment decisions. Any investments, trades, speculations, or decisions made on the basis of any information found on here, expressed or implied herein, are committed at your own risk, financial or otherwise.
Ethereum is SPOT ON with the last cycle!This is amazing news. We are following this fractal perfectly. Get ready for a wild ride. I am looking to take some profits in the high 2000s to put into bitcoin when the ETH/BTC ratio is at its peak.

Eth poised to set new ATHEth is ready to break out and set a new all time high.
Ever since bitcoin hit its new ATH on the 8th January we have seen a steady decline in market dominance meaning that money is flowing into Altcoins.
An Ascending triangle is identified signalling towards a continuation of bullish trend.
Target
2277 (61.8% Fib)
-BreadCharts

Simply More Moon Lol Ya Totally Bullish LOL Taking profit is for weak hand HODL.
What are your thoughts? Is it bad that people like to realize gains or just something else?
-No advice to give just thoughts that I can't shake after the last 6 years in the world of "CRYPTO"
""KEEP CALM AND MANAGE THY RISK!""
Ya takes time indeed...

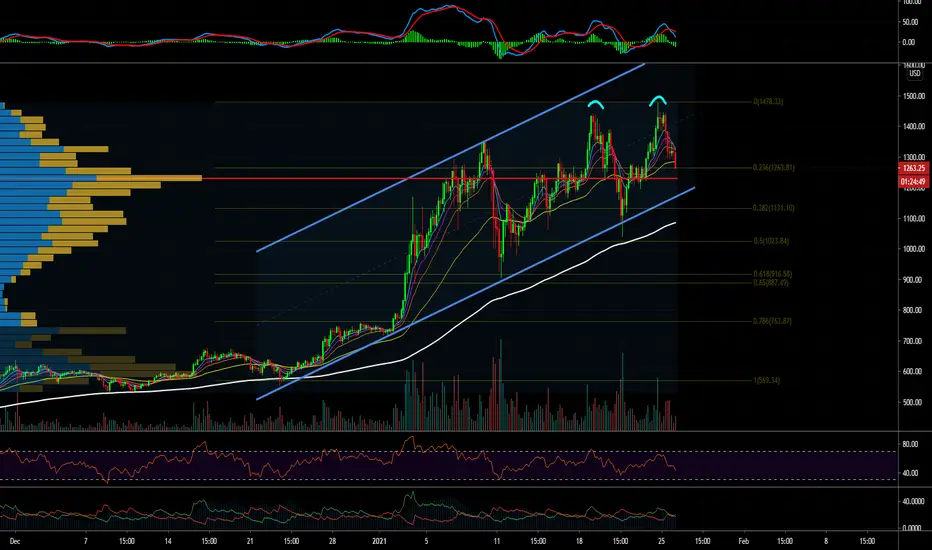
Ethereum New Highs!! Where are the Buying Opportunities??Ethereum made new highs then swiftly retreated. It is a bit extended right now, having crossed $1035 to $1430 since Thursday. We can anticipate further resistance at highs, and perhaps for a consolidation pattern to form (such as a bull wedge or flag) before another breakout. We could see up to a 50% retracement of this month's range, which would bring us to $1172. We would see support from some levels in between at $1320, and $1233 in between. We could dip all the way down to $913 and still be considered bullish. The Kovach OBV and Chande are both really strong, so it is highly likely the pendulum will swing back and we will see a retracement. Long term we are very bullish of ETH.

Inverse Head and Shoulders about to be confirmedWhen the Head-And-Shoulders-Pattern's breakout is confirmed by a weekly close above the neckline (0,04), the reach of the suggested target would break the upper trendline, which is drawn from the highest wicks of the mult-year downtrend. also watch out for a monthly close above 0,04. This will create a higher high on the monthly chart and would further confirm a trend reversal.

ETH/BTC - Break Of Resistance From 2018 = Parabolic ALTS!It's been a while since I've posted an idea. But we are looking very strong here for a big break to the upside and a catalyst for a full-blown alt season leading to a much bigger decline in the bitcoin dominance chart.
Historic levels held below since August 2018... This could get very fun...
Trade carefully.

ETH/BTC UPDATE Ethereum looks strong coming into the next resistance level of 0.040545
We've seen a slight rejection
Now looking for support at 0.039875 and 0.038820

ETH is BREAKING OUT! If Tyler and Cameron Winklevoss are right that #Bitcoin reaches $500K to surpass gold market cap, and if this $ETH $BTC chart and
@RaoulGMI are right, we reach 0.1 in this cycle, which means #ETH will reach $50,000. #Ethereum

Nice support line going forwardKRAKEN:ETHUSD
Ethereum is finding support but still being whipped around from BTC influence in the short term. I'll be looking for a break of the red resistance line to confirm the start of another run.


FALLING WEDGE IN ETHUSDPLAN
- Price Breaking below the Lower Trendline can lead to :
1. 1050
2. 933
- Price pumping up can retest the Upper Trendline but before that it should be able to break the 1246 region.
INFO
- Try to connect the ideas and get a clearer picture of the whole set up.
- This can play either way so keep an eye on the support and resistance as well.
Signing off,
THECRYPTONIZER

ridethepig | ETH Breaking Correlation 📌 ridethepig | ETH Breaking Correlation
A good example of a freeing move .
In similar positions, the break can trigger capitulation , since it opens up a test of the pivot level which is already somewhat cramped and is at the same time the appropriate positional response as we see profit taking in BTC help ETH catch up on the wing!
The break in correlation against BTC shows the underlying strength in the foundations of ETH... regulation is knocking at the door; governments will start to weigh heavier on BTC in 2021 than ETH. A +/- $300bn market cap for ETH looks about right in my books.
Thanks as usual for keeping the feedback coming 👍 or 👎

Ethereum correction finished? Alts hold strong against bitcoin!Ethereum has corrected back to the 15th-16th January support level and begun to resume higher.
Could this be the end of the correction or is there more to come?
Alt coins barely lost any value in bitcoin during the correction which indicates Alt coin strength and potential for a further run to the upside for them if bitcoin completes the large triangle pattern over the next week or 2.

ETHBTC is ready to breakout the iH&S Pattern to 0.1 TargetThe structure of the price is very solid.
A clear reversal pattern and possible to reach 0.1 in 2021

ETHEREUM IS STILL STRONG!Ethereum corrected back to the triangle trend line .If you bought at the trendline it would be a high probability success trade.There is nothing to worry about unless bitcoin breaks the 21 Day EMA which it is currently sitting on.

Ethereum, where are we going?I drew a fibonacci retracement from the previous high to the following low, which gives us clear price targets for ETH.
Nevertheless, we have just tested the ATH and are yet to break through with confidence. As we can see volume has been relatively low over the past couple of days. I'm hoping to see a strong break of the ATH with a large volume candle, which should take us straight to $2000.
Enjoy the ride guys!

ETH / USD 19 01 21 = BTC / USD 16 12 20 FractalToday is a very important day 19 01 2021. Pay attention to the fractal. Let me remind you that today 19 01 ETH against usd showed 1444.
1444 is the previous all-time high, for ETH it is the same as 20044 16 for BTC (the previous all-time high).
Let me remind you that BTC 19 01 21 is in a symmetrical triangle squeezed into a corner.
Change comes when the pain of staying the same is worse than the pain of change.
Nick Hinton
The main trend BTC. Published on 18 1 0 2020
BTC / USD Main trend. Triangle Secondary trend reversal zone.
+300%
Published on 31 03 2020
ETH / USD Triangle. The price is clamped. Coming soon.
More +1000%

ETH Triangle - BullishWait for breakout for the upside, enter aprox @442, SL@420
Global uptrend
BTC dominance falling

ETHBTC - Potential bullish pennant Potential bullish pennant for ETHBTC
Worth keeping an eye out on this.
