Altcoins' Downturn & Bitcoin's Unmatched SupremacyLet's cut to the chase. As an advanced analyst, I see a cataclysmic drop in altcoins on the horizon (obviously). This isn't just a hunch; my trusted charts reveal a looming dive to super low levels. Even stable-coins like tether, which often a safe haven, are part of this story, affecting the Total2 index. Stable coins make up about 120 billion dollars (20% of Total2) as of June 13, 2023.
But don't worry! Bitcoin stands tall amidst this chaos. It's the clear leader, shining in technical prowess and visuals. Altcoins, in comparison, are garbage securities which just don't measure up.
As altcoins lose steam and get sued to zero, I see money moving back into Bitcoin, further solidifying its top spot. In short, brace for an altcoin shake-up, stay prepared, and always trust the charts. Especially mine. Not these SCAM ARTISTS who know ASBOLUTELY NOTHING about financial markets.
See my inverse - Bullish Bitcoin idea linked below...
Ethereum-bitcoin

$BTC -Facing Debt CeilingBITMEX:XBT is fighting to maintain it's uptrend after facing resistance on 200EMA, with the nearest below support coming at 25.000$ Level Zone ;
(CHoCH + 0.618 Golden Zone)
Breaking the recent HigherLow at 25.785 $ will confirm more the Triangle breakdown
and the loss of S/R zone.
For now, this level is a small CHoCH of the previous low inside S/R zone of 26.5K
Looking it from a broader persperctive ,
Bitcoin's Uptrend remains intact from FTX's low of 15K,
as long as the the 19.300$ Higher Low is Violated through a Break Down with massive Sell Volume
'X' date of Debt Ceiling is approaching with the welcoming of June,
while just recently Secretary Janet Yellen stated that US might have reached is
Debt Peak Climax.
Will US once again intervene saving the markets by expanding M2 ?
Or will their Debt Monopoly Game be put in stop and the Imminent Crash is coming
for Financial Markets ?
TRADE SAFE
*** Note that this is not Financial Advice !
Please do your own research and consult your own Financial Advisor
before partaking on any trading activities based soly
upon this idea .

ETHBTC: targeting the top of the Channel Down.ETHBTC is consolidating right now on neutral 1D technicals (RSI = 55.810, MACD = 0.001, ADX = 53.149) supported by the HL trendline. A bounce on the 1D MA50 would be ideal for a new buy, but if it breaks the trend turns bearish. Until it does, we are bullish, targeting the 0.9 Fibonacci (TP = 0.07200) as it happend on January 2023. But of those where the bullish waves inside a long term Channel Down.
## If you like our free content follow our profile to get more daily ideas. ##
## Comments and likes are greatly appreciated. ##

ETHBTC showing upside to come to 0.08 due to W and TriangleW Formation has formed on the ETH/BTC pair.
There is also an Ascending Triangle, with higher lows and same highs.
We are near the neckline where the price is quite likely to break up and out of.
We have other signs like
7>21 MA
Price>200 MA
RSI>50
Target is for the ETH/BTC to head to 0.08
For those that don't know how it works...
HOW ETH/BTC works
ETHBTC is a trading pair similar to Forex pairs.
With crypto, it represents the exchange rate between Ethereum (ETH) and Bitcoin (BTC).
And as always with trading pairs, there is a primary and secondary coin.
The primary (Ethereum) is how much 1 unit of ETH can be exchanged for a certain amount of Bitcoin.
ETH/BTC
1 / X No. bitcoins.
Right now, the current ETH/BTC exchange rate is 0.06.
This means, 1 ETH is worth 0.06 BTC.
Or conversely, we can see how much 1 BTC is worth in ETH.
To do that we divide the two.
BTC/ETH = 1/0.06 = 16.66 Ethereum per Bitcoin.
ETHBTC works based on the principles of supply and demand in the cryptocurrency market.
The exchange rate is determined by the ongoing buying and selling activity of traders on the exchange platform.
When there is more demand for Ethereum relative to Bitcoin, the ETHBTC price tends to rise.
Conversely, if there is more demand for Bitcoin relative to Ethereum, the ETHBTC price tends to fall.
Right now we can expect the ETH/BTC to go up, which means Ethereum will mostly likely strengthen in the near future compared to Bitcoin.
Hence I expect the price to go to ETH / BTC = 1: 0.08.

eth/btc I see in next months some dangerous moves will happen in crypto market. BINANCE:ETHBTC is going up. and all whales are taking all Ethereum in exchanges. I Think all market will going up , but bitcoin will gonna down , and we will see almost a Flipping in market. But no one can take bitcoins place in world. that will hard for bitcoin. but bitcoin have to be success.

ETHBTC Potential bullish break-out of the 9 month Falling Wedge.The ETHBTC pair has been trading within a long-term Falling Wedge pattern since September 2022 and currently it is testing its top. This is also where the 1W MA50 (blue trend-line) is, so we can potentially have a double bullish break-out.
The 1W RSI has already broken above its 9-month Channel Down, issuing the first signal. If the price does break and close above the top of the Falling Wedge, we will target every Resistance level all the way to the 0.08560 High and buy on every pull-back. As you see the Fibonacci retracement levels match well with those Resistance levels, which are basically the Lower Highs of the Falling Wedge.
If the price fails to close above the Falling Wedge, then a potential rejection can pull it all the way down to the 0.06200 Low.
-------------------------------------------------------------------------------
** Please LIKE 👍, FOLLOW ✅, SHARE 🙌 and COMMENT ✍ if you enjoy this idea! Also share your ideas and charts in the comments section below! **
-------------------------------------------------------------------------------
💸💸💸💸💸💸
👇 👇 👇 👇 👇 👇

ETHUSD → Price strengthens and breaks resistance ETHUSDT exists within an uptrend bounded by resistance and support. For a long time the cryptocurrency pair was under the pressure of local resistance, which was broken yesterday.
The price breaks MA-50 and on another retest of the resistance the pair breaks through the resistance and exits the range, after which it forms a consolidation above the line.
If the bulls hold the price in the new channel, the coin will begin its strengthening.
The last few days the activity on the market is increasing, and we can assume that it all happens against the background of the economic fundamentals regarding the dollar index.
The moving averages are acting as support. The MA-200 coincides with the lower boundary of this uptrend channel, confirming the support line.
Strong support: 1880, 1846, 1775.
Strong resistance: 1920, 1941, 2021.
I expect that under the pressure of the bullish trend and sentiment, ETHEREUM will continue to 2021 followed by a breakout and strengthening to channel resistance.
Regards R. Linda!

ETHBTC Bullish Cross completed on 1W. Rally ahead.The ETHBTC pair has been trading inside a Triangle pattern for almost a year (since the June 13 2022 Low). For the past 3 weeks the 1D MA50 (blue trend-line) has been supporting while the 1D MA200 (orange trend-line) has been the Resistance since January 21 as the price has failed to close a 1D candle above it (having 3 clear rejections on it).
The key difference here is the formation of a Bullish Cross on the 1W MACD. In the past 12 months, this has always been a Buy Signal. We are buying and targeting the 1D MA200, and if it closes a 1D candle above the 1D MA200, we will extend buying towards the 0.618 Fibonacci level.
-------------------------------------------------------------------------------
** Please LIKE 👍, FOLLOW ✅, SHARE 🙌 and COMMENT ✍ if you enjoy this idea! Also share your ideas and charts in the comments section below! **
-------------------------------------------------------------------------------
💸💸💸💸💸💸
👇 👇 👇 👇 👇 👇

$ETHUSDT: Bird's eye viewTime@Mode can capture very profitable trends with incredible accuracy and very low risk, at times catching the bulk of returns in a given market, while sidestepping the volatile uninteresting periods.
To do this, you need to know the timeframe in control of the main trends in said instrument. Determining the Timeframe in control means finding the timeframe that explains the recent trend swings in the cleanest way possible.
If you follow crypto markets, you might want to be aware of these trends, and when they trigger, to be able to capture the biggest swings in a painless manner, and stand aside when things become tough and unforgiving (like they have been since basically April 2021).
This analysis breaks down the monthly trends in Ethereum and shows what to look for to capture the next bull run effectively. See the annotations in the chart to know what we have to look for here during the month of May.
Best of luck!
Cheers,
Ivan Labrie.

Just Putting This Into The Universe #EthereumUltra Bullish Ethereum outlook based on past cycles and price action.
Obviously a ridiculously high projection. Only way this is possible is if Ethereum becomes the backbone of the entire world financial system, which it could.

Ethereum - Time Based Theory (Update)Just an update to my time based series. Refer to my previous Ethereum time based ideas below if you haven't checked them out yet. Looking forward to watching how this plays out the rest of the year.

Ethereum Hasn't Reached 1.5x Target of its HSiThe eth/btc pair confirmed an inverted HS a while back, and hasn't yet reached its TP2 (or a 1.5x measured move from the neckline).
It hit TP 1 and has since consolidated between TP 1 and the 0.5x halfway mark. It may get a chance to test that area again, potentially even falling into the Accumulation Zone shown on the chart, which might be a good spot to increase position. It also may not.
Look for an eventual move to TP 2.
Alternatively, I think there's a chance it could fall as low as ~0.025, making a move symmetrical to the one on the far left of the chart before finally firing back up towards 0.1 and higher.
See links to related ideas below, including the alternate move back down near 0.025.

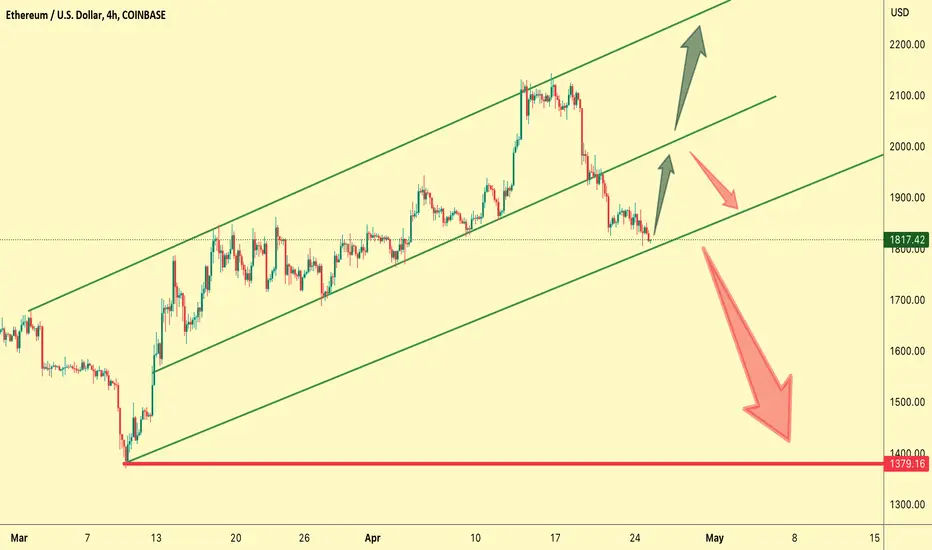
ETHEREUM -25/4/2023-• Ethereum is suffering from the overall crypto market correction
• After hitting the upper trend line of the broad ascending channel, price reversed and broke through the middle line as well indicating increasing selling pressure
• Price found some support at the lower bound of the channel
• Bulls will try to keep the price from breaking the channel even if they are not yet able to break through the middle line again
• Bears will gather their strength at a higher price and will try to break the channel
• There is no significant support below current level until 1380, which is the bears main target
• If bulls manage to defend the channel support and the market gains some momentum, they will aim to re-test the upper bound of the channel and make a new yearly high
• A break of the channel exposes 1380 and gives the bears the upper hand, weakening the bullish trend significantly
AW Crypto Market Update - Ethereum - Bitcoin - XLMThis video aims to give you an indication of where we are within the ongoing correction for each of these digital assets.
I expect to see weak price action with limited upside in these markets as the full corrections come to an end.
Once we see the momentum wane in a choppy manner, the final move in each market should lead to an inevitable blow off top.
Remember to use Disciplined Money Management Principles to ensure longevity as a trader.
If you don't know the long term pattern shouldn't you be doing your research instead of just following the crowd?
Just remember: I am not a financial adviser; I suggest using this only as a guide. Always do your own research.
***AriasWave is not the same as Elliott Wave so your counts may differ to mine if you happen to use it.***

Digital Assets Outlook 2023Digital assets have had a strong early 2023
Digital asset prices, led by Bitcoin, have had a strong 2023 so far. Bitcoin is up by over 70% this year and Ether is up by over 50%1. Together, these two assets still account for over 63% of the total market cap of the digital assets space. While the US Federal Reserve (Fed) is still raising interest rates, the market seems to expect that the recent bank failures (Silvergate Bank, Signature Bank, Silicon Valley Bank, Credit Suisse) will lead to central bank easing. Lower interest rates would benefit long-maturity assets, such as digital assets. Moreover, several traders have been caught off-guard and short-sellers expecting more downside in digital assets have had to liquidate positions leading to higher prices.
We believe we could be on the cusp of the fourth major bull market in crypto, although the exact timing is uncertain. Our belief is that the next bull market will be enabled by advancements in speed and scalability of the blockchain networks, more intuitive user interfaces, and innovations in blockchain wallets, as well as developments in digital identity, which will pave the way for Web3 applications. The critical determinant, of course, will be the user applications that will take the market by storm and we will keep monitoring potential candidates on a continuous basis.
Despite dismal price action last year, digital assets are supported by a healthy and vibrant software developer community. The number of monthly active developers actually rose last year by 5%2, which is significant, and confirms our view that developers remain actively engaged in their respective blockchain ecosystems.
Layer 2 networks finally coming into their own, promising to solve the scalability issue
The main impediment of current Bitcoin and Ethereum networks has been their inability to handle a large volume of transactions. It is estimated that, without a layer 2 solution, Bitcoin can only handle approximately 7-10 transactions per second while Ethereum can only handle approximately 15-30 transactions per second. While it is on Ethereum’s road map to be able to ultimately handle 50,000-100,000 transactions per second, this is not a reality at the moment. As a contrast, Visa is said to handle at least 1,700 transactions per second although there are some estimates that Visa could handle up to 24,000 transactions per second and Visa itself is claiming this number to be as high as 65,000 transactions per second3.
One way to solve the scalability issue of blockchains is to use a layer 2 network, which is built on top of a layer 1 blockchain. Layer 2 networks move transactions off-chain, roll them up and bundle multiple transactions into a single transaction, which can then be secured on the layer 1 blockchain benefiting from underlying blockchain’s security and robustness. This bundling enables faster throughput, faster settlement, and lower prices. For Bitcoin, the most well-known layer 2 solution is the Lightning Network, while for Ethereum there are several options available, including optimistic rollups, zero-knowledge rollups (ZK rollups) and sidechains. It is also worth mentioning that the Ethereum network is expected to go through so called ‘sharding’ later this year, which is expected to split the network into separate ‘shards’ thereby increasing the capacity of the network and reducing the transaction (gas) fees in the process.
Digital USD tokens emerging as a major use case
Stablecoins, digital tokens issued on public blockchains and pegged to an underlying asset, such as a currency or a physical asset, were initially used in trading and interexchange settlement but have become increasingly popular in payments and remittances. Because stablecoins are global and accessible to anyone, they offer an attractive way to cheaply and securely transmit money around the world 24/7 and settle transactions (almost) instantaneously. The world’s largest stablecoin, Tether’s USDT, is particularly popular in Asia, while in the West Circle’s USDC is widely used. Stablecoins are designed to offer stability while an asset like Bitcoin is more volatile.
To give an idea of the magnitude of transaction volumes, last year, Visa settled HKEX:12 trillion worth of payments, mainly related to consumer spending, while stablecoins settled HKEX:8 trillion worth of on-chain transactions, higher than the $2.2 trillion settled by Mastercard or HKEX:1 trillion settled by American Express4. This year, it is possible that the combined amount of stablecoin transactions exceeds the payments settled by Visa. These stablecoin transaction volumes, of course, are not related to consumer spending but rather to payments, trading and decentralised finance, and do not take into account trading volumes on centralised exchanges.
Competition for instant payments heating up
The market for instant settlement of payments seems to be in flux at the moment. Crypto regulation in both Europe and the US are focusing on stablecoins and are expected to set stringent reserve requirements for stablecoin issuers and also forbid interest being paid to stablecoin holders. We view transparency requirements into reserve assets of stablecoin issuers important but also believe that attention should be paid into issuers’ risk management, cybersecurity, and blockchain code testing quality.
In the US, the Federal Reserve is planning to launch an instant payment system called FedNow in July 2023. The network will not be based on blockchain but will be able to settle payments in seconds and can support transactions between consumers, merchants, and banks. Some believe that the closure of Silvergate’s SEN network and Signature Bank’s SigNet network in mid-March 2023, both offering instant settlement service where clients were able to move assets between fiat currencies and crypto exchanges at any time, could have had something to do with the launch of FedNow. Around the world, central bank digital currencies (CBDCs) are also being actively developed. They offer a digital form of a government-issued currency that is not pegged to any physical commodity and these digital currencies will continue to be based on the fractional reserve banking system.
In Europe, the European Commission adopted a legislative proposal in late October 2022 that mandates all banks to offer instant euro payments to any individual with a bank account in the eurozone. At the moment, the EU banking sector, on average, lags behind other major international markets in instant payments, although single-country solutions have been adopted and variations between countries are large. In some European countries, instant payments cover 70% of banks but, in others, only 1% of payments are settled instantly. The European banking sector has stated that they need up to two years to make banks instant-payment ready5.
Europe has its own version of an instant settlement network. BCB Group, regulated in the UK and Switzerland, offers BLINC network that links crypto companies to the banking system and enables business accounts to trade in fiat and digital assets 24/7. The company already offers fiat-to-crypto rails in sterling, euros, Swiss francs, and yen in Europe and plans to add USD fiat-to-crypto rails by early Q2 2023. BCB’s goal is to plug the gaps left by the SEN network. Unlike SEN, BLINC is multicurrency-based and is not tied to any single credit institution. It was designed as a payment institution to provide on-ramps to banks in Europe, the UK and Switzerland. The company emphasises that its funds are always 1:1 backed and are unleveraged and un-rehyphothecated6.
Sources
1 Source: Coingecko.com
2 Source: Electric Capital, 2022 Developer Report
3 Source: Visa Fact Sheet, 2022
4 Source: CoinMetrics
5 Source: Euromoney
6 Source: BCB Group, Coindesk

Ethereum 🔼$ETH has unlocked new highs not seen since Aug 2022, with recent 17 days range breakout and retest looks a good long to target $2000.
And this is ETHBTC, such move has the higher probability:
I will keep updating this in here, so make sure you follow me.

ETHBTC About to bottom and Ethereum to outperform?We haven't looked into the ETHBTC pair in a while but there is no better time than now, in the build up of what the market calls an 'alt season'. As you see the pair hit its 1D MA50 (blue trend-line) this week after a strong rebound on the RSI from below the 30.00 oversold barrier. Last time that happened was on June 13 2022.
The Fibonacci levels help at identifying key Support and Resistance levels within this two year horizon very effectively. The question is, do we have one last Lower Low on the 1D RSI trend-line before ETH starts outperforming BTC again?
-------------------------------------------------------------------------------
** Please LIKE 👍, FOLLOW ✅, SHARE 🙌 and COMMENT ✍ if you enjoy this idea! Also share your ideas and charts in the comments section below! **
-------------------------------------------------------------------------------
💸💸💸💸💸💸
👇 👇 👇 👇 👇 👇

ETHBTC plan for AltcoinsSquiggles on ETHBTC chart for accumulating strong altcoins with longterm hold in mind.

Correction Zone and wait for another impulse wave up to $6Hey traders,
Look at the chart, DYDX's in the correction wave.
Now, it's trading around $2.35
This level is a good point for join medium-term and wait the fifth wave at $6.
Wait and see

Less risky when join the race at 2.46BINANCE:OPUSDT is consolidating in range 2.4 - 2.5
- Ultra high volume previous dropped
- RSI < 50
- Price below MA
So it's can down one leg before go up to the Resistance Zone
Wait and see


Ethereum Time Based Theory {UPDATE}My time based theory is still in play, and with CPI print being released tomorrow, I think the probabilities are pretty reasonable that Ethereum is going to get extremely volatile, get close to one of these two key levels, and do so roughly around the date I have plotted with a vertical line. This theory is based on bitcoin having the same type of time based volatility over the last year. Let me know if you would like more details on bitcoins time based volatility. It is truly fascinating.

Something big is brewing with ETH?Ethereum has outperformed bitcoin in the bear market and has outperformed btc since 2020.
The price of eth-btc pair has gone sideways while bitcoin has seen a decline of over 70-75% in the last year or so.
So what is going on with ETH? On- chain statistics say a story that is quite remarkable.
A networks ability to survive does depend on its transactions , because if no one using a crypto currency for transactions - it will die.
While bitcoin's everyday transaction count on average has remained stable for over 4 years at an average of 250k transactions a day, Ethereum has continued to out perform bitcoin by 4x the number. Ethereum transaction count during the same period has sky rocketed from 300k transactions to averaging over 1.2 million transactions per day for the last 2 years. Ethereum use in every single crypto product out there speaks its own value. source : glassnode.
Thus my opinion despite the bad news is that Ethereum is not to be under-estimated.
Bitcoins current world Marketcap is 384 billion dollars.
Ethereum is valued at almost 167 billion dollars.
Ethereum is already half as valuable as bitcoin, But Ethereum is still a risky bet - It is CENTRALIZED - its product has depended on the leadership and skills of Vitalik since its inception. The SEC can declare ETHEREUM a SECURITY at any time - which makes it a risky bet still. If Ethereum is recognized as such it will create a host of problems for the entire crypto economy.
It remains to be seen what happens next - If ETHER is OFFICIALLY recognized as a security by the SEC we can forget the flippening ever happening.
Whether this sideways movement is DISTRIBUTION or further accumulation, only time will tell. I own some small amount of Ethereum in case it ever moons, but not too much to be up at night worrying about the price.
What are your thoughts? do you think Ethereum will flip bitcoin or will ether be recognized as a security which will doom a much broader crypto eco system?
