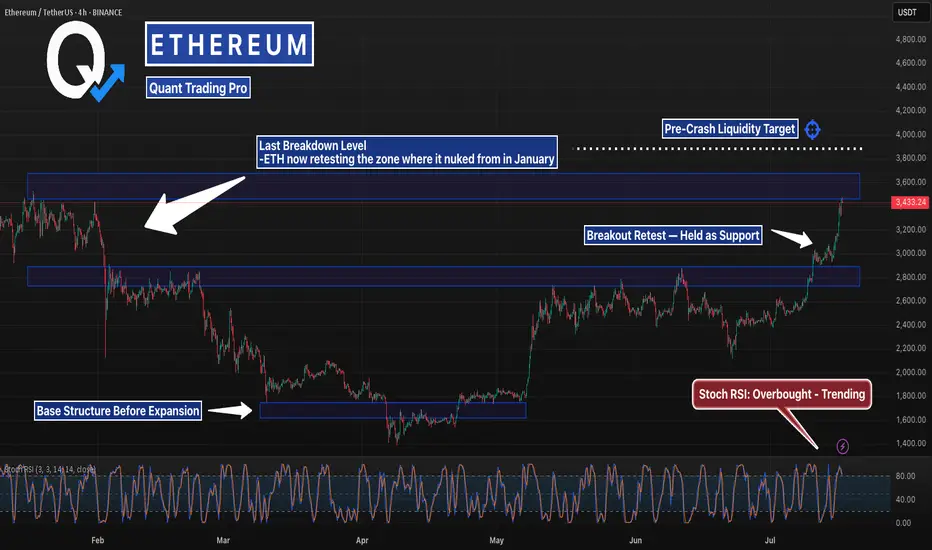
This Level Crashed ETH Last Time… It’s BackETH just blasted back into the same zone it collapsed from in January — but this time the structure underneath is stronger, tighter, and holding.
Stoch RSI is stretched, but bullish momentum remains intact. If it clears $3,870, lights out.
#Ethereum #ETHUSD #CryptoCharts #BreakoutLevels #ChartAnalysis #TradingView #QuantTradingPro #CryptoTraders #BacktestEverything
Ethereum (Cryptocurrency)
ADA/USDT : +50% in 21 Days, More Rise Ahead? (READ THE CAPTION)Over 50% growth in just 21 days — Cardano’s explosive rally continues, and the $0.76 target has now been hit! Since our last analysis, ADA has kept pushing higher, successfully reaching the next key level and bringing the total return from this move above 50%. Currently trading around $0.73, with strong bullish momentum still in play, I expect it won’t be long before we head toward the next targets. Upcoming levels to watch: $0.93, $1.05, and $1.33 — we’re getting closer to that 100% gain!
Please support me with your likes and comments to motivate me to share more analysis with you and share your opinion about the possible trend of this chart with me !
Best Regards , Arman Shaban

Ethereum – Calm Before the Next Leg Up?Ethereum had a disappointing start in 2025.
After pushing above $4,000 in mid-December 2024 — with headlines full of "$10K ETH coming!" — the new year began around $3,500, and what followed was a slow bleed.
By early April, Ethereum printed a shocking low at $1,380 — a level few believed was even possible.
But the bounce from there? ⚡
It was explosive — nearly +100% in just one month, with price topping around $2,700.
Since then, we’ve been consolidating — and that’s completely normal after such a vertical move.
🔍 So, what’s next?
Technically, ETH is forming a rectangle, a structure that often resolves as a continuation pattern.
The spike down to the $2,300 zone on May 19th was telling — buyers stepped in aggressively and pushed price back above $2,500, which now acts as a comfort zone for bulls.
📌 Conclusion
I’m looking to buy dips, ideally near $2,550, and my target is the $3,500 zone.
No need to reconsider the bullish outlook as long as price holds above $2,300.

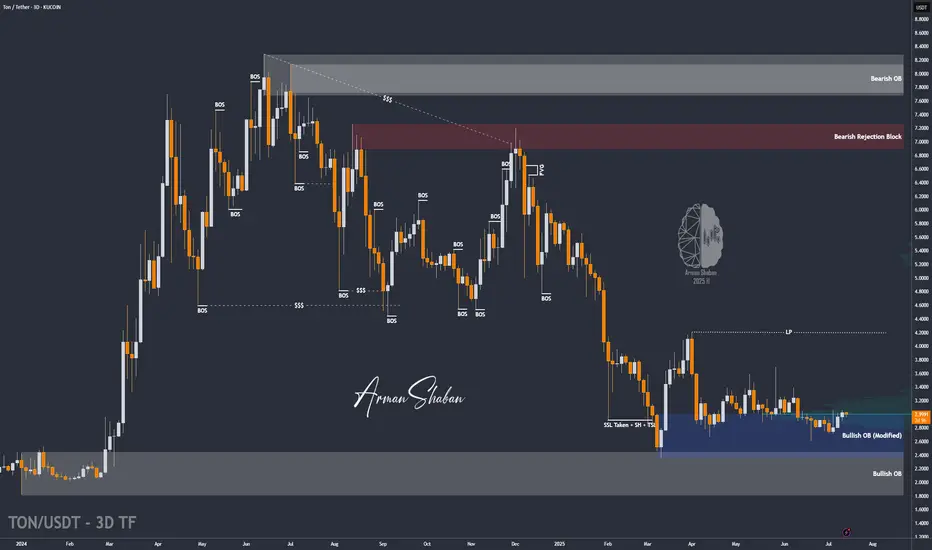
TON/USDT : Get Ready for a new Rally! (READ THE CAPTION)By analyzing the Toncoin chart on the 3-day timeframe, we can see that the price has finally managed to grow over 3% as expected, and is currently consolidating above the $3 level. We’ll have to see how far this bullish momentum can continue — but to be honest, I expected a stronger move considering the market rally and Bitcoin repeatedly hitting new ATHs. Still, no worries — once Bitcoin takes a breather, altcoins will likely begin their powerful runs! Based on previous analysis, the next targets are $3.15, $3.63, $4.20, and $4.68 respectively.
Please support me with your likes and comments to motivate me to share more analysis with you and share your opinion about the possible trend of this chart with me !
Best Regards , Arman Shaban
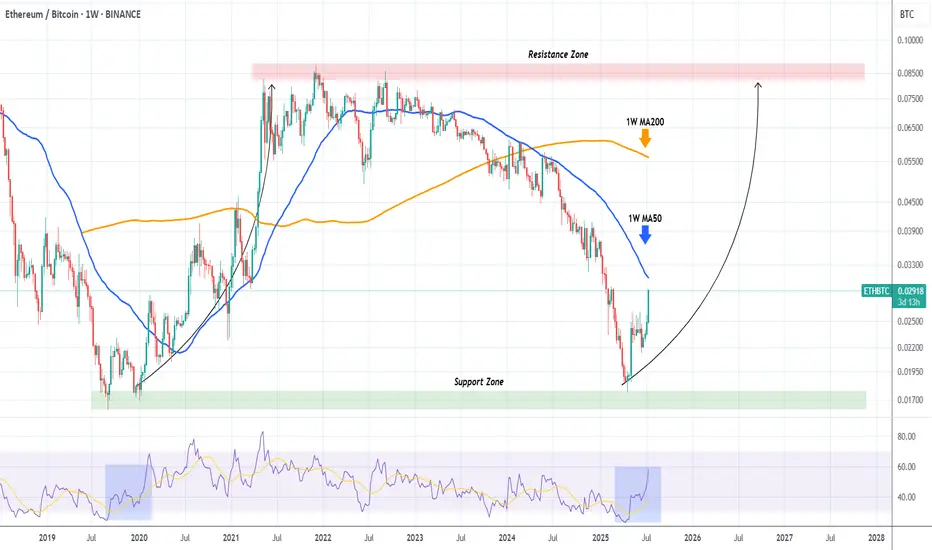
ETHBTC shows that Ethereum will outperform Bitcoin MASSIVELY!The ETHBTC pair has been rebounding hyper aggressively after the April 21 2025 Low on the 6-year Support Zone, and is now facing it's most important test, the 1W MA50 (blue trend-line).
This trend-line has been its Resistance since basically March 13 2023, so if broken, it will be a massive bullish break-out signal.
In fact during the 2020 - 2021 Bullish Leg, once the price broke above the 1W MA50, the market got the final confirmation of the upcoming long-term rally.
We expect Ethereum to outperform Bitcoin for the rest of the year at least.
-------------------------------------------------------------------------------
** Please LIKE 👍, FOLLOW ✅, SHARE 🙌 and COMMENT ✍ if you enjoy this idea! Also share your ideas and charts in the comments section below! This is best way to keep it relevant, support us, keep the content here free and allow the idea to reach as many people as possible. **
-------------------------------------------------------------------------------
💸💸💸💸💸💸
👇 👇 👇 👇 👇 👇
eth,long trend is comingmaybe last from 2025 to 2026
key points:4000,4800
Big big guess, value around $1 trillion, price near $8000

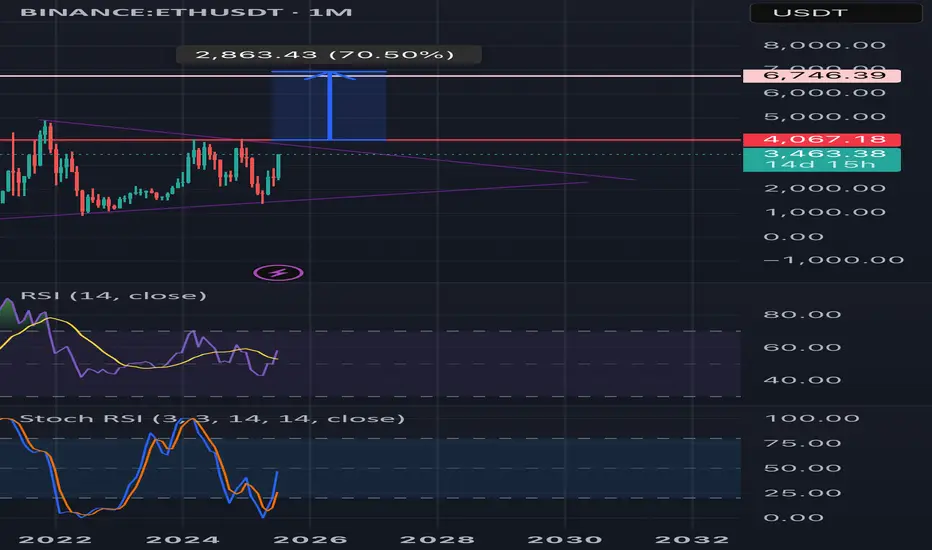
Upward breakout for ETH monthly?🟣 Ethereum Monthly Timeframe Analysis – Large Symmetrical Triangle
📌 Current Situation:
• On the monthly chart (1M), Ethereum (ETH) has formed a large symmetrical triangle pattern.
• This pattern typically signals a major price consolidation before a significant move.
• The descending resistance line connects the 2021 all-time high to recent lower highs.
• The ascending support line is drawn from the 2018 low through the 2022 bottom.
• Price is nearing the apex of the triangle, indicating a breakout is likely soon.
⸻
🔼 Bullish Scenario (Breakout to the Upside):
If ETH breaks above the triangle resistance and confirms the move:
✅ Signs of a Bullish Continuation:
• Strong breakout above the $4,000–$4,500 zone
• Increased volume confirming breakout
• Price holds above resistance-turned-support
🎯 Potential Price Targets by 2027 (based on triangle height & Fibonacci projections):
1. Target 1: $6,800 – $7,500
2. Target 2: $9,000 – $10,000
3. Long-term Target: $12,000 – $15,000 (if macro bull market continues)
⸻
🔽 Bearish Scenario (Fakeout or Breakdown):
If the breakout fails or price breaks down:
• ETH could revisit lower supports around $2,000 or even $1,400
• Bullish momentum delayed until another strong base forms
⸻
🔍 Conclusion:
• This triangle could mark the beginning of a major rally into 2027, especially if supported by fundamentals (e.g., ETF approval, DeFi growth).
• Wait for a confirmed breakout with volume and retest before entering a long-term position.
Ethereum reached to our target
Ethereum reached to $3400 that we talked about since weeks ago, but now the daily RSI is at overbought area and we might see a correction.

ETHUSDT minor trendsEthereum BINANCE:ETHUSDT is downtrend with lower highs from the bottom is nearly finished 📉 . For a stronger rise, it needs to stabilize above $2500 ⚡. Mid-term targets are $3300 (end of second leg) and $3700 (major resistance) 🎯. Key supports are $2500, $2070, $1800, and $1550, the base where the uptrend began 🛡️.
Supports & Resistances:
Supports: \$2500, \$2070, \$1800, \$1550
Resistances: \$2500 (critical level), \$3300, \$3700

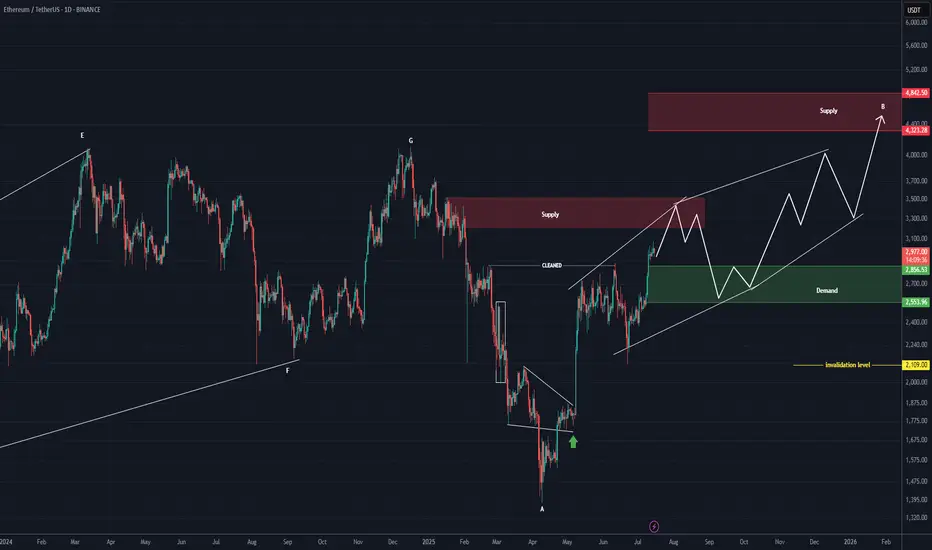
ETHEREUM Roara Map (1D)The previous phase of Ethereum appears to have been a completed diametric, and now it seems we are in a flat pattern.
It can be said that we are currently in wave B of the flat, which itself appears to be a diametric.
This diametric could even extend to the 4300–4800 range.
The green zone is the rebuy area.
A daily candle close below the invalidation level would invalidate this analysis.
For risk management, please don't forget stop loss and capital management
Comment if you have any questions
Thank You
ETHUSDT BUY / Long SetupThis 4hrs candle closes above the mentioned level, then took long from 50% fib level of the fvg, and put sl below the recent swing low, I will update the trade whether it's active or not? tp towards 3.3-3.4k , while btc.d getting recked so becareful shorting any altcoin.

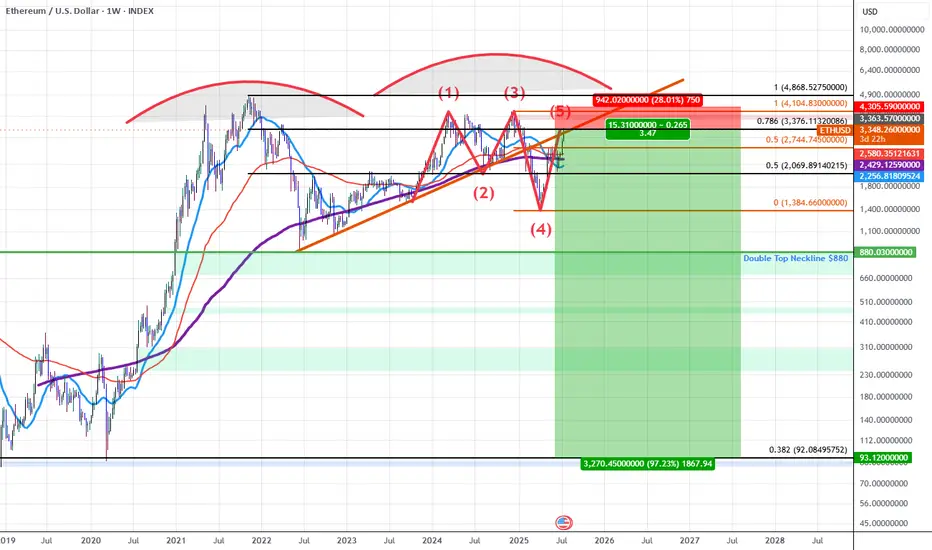
ETHUSD: Double Top into A Bearish 5-0 Breakdown (Extended)Updated Commentary: ETH has extended a bit further than projected as the Pattern Completed at the 0.618 but ETH gapped into the 0.786 instead. The gap up aligned with an upside gap fill on the CME futures as well as a gap fill on the grayscale ETH futures ETF $ETHE. The easier move from here to simply add to the ETH shorts and adjust the stop to be above the previous highs while sizing up at the 0.786 and playing off this gap higher as an anomaly. Beyond this, my view on ETH at the current 0.786 retrace remains the same as the original Idea posted as ETH rose into the initial 0.618 PCZ the details of which I will also include once again below as it still remains relevant.
ETH for the last 5 years has been developing a Double Topping pattern which has put in a series of lower highs during the most recent 2nd run up. As we've confirmed these lower highs we've broken down below trendline and are finding resistance at the trendline which happens to have confluence with the PCZ of a Bearish 5-0 wave formation near a 0.786 retrace.
As we begin to find weakness and Bearish price action begins I suspect price will make it's way towards the neckline of the double top aligning with the $880 price level if ETH breaks below that level there will be no significant support until it reaches the all-time 0.382 retrace down at around $92.10.
In short it seems ETH is in the early stages of a macro breakdown which could result in value declines greater than 80%.
I also suspect that we will see many of the assets that ran up significantly going into this week to sharply reverse those run-ups as this week comes to a close and the new week begins mainly due to the effects of OpEx, this includes: Bitcoin, MSTR, SOL, XLC, META, and BTBT. Long-dated Put accumulation on these assets at these levels is far easier to manage than naked short positions and that's how I will go about positioning here.
ETHUSD – Possible Correction from Channel Resistance!Pair: ETH/USD
Timeframe: 4H
Structure: Ascending Channel
Indicators: RSI Overbought, Bearish Divergence Forming
Volume: Spike into resistance
📉 What’s happening?
Ethereum just tagged the top of its ascending channel, showing early signs of rejection. RSI is hovering near overbought, with weakening momentum on the last push.
⚠️ Caution Zone:
$3,425 acting as upper resistance
Price may retrace to midline or lower channel support ($3,250 → $3,050 range)
📌 Confirmation:
Look for:
A strong bearish candle or
RSI breaking below 60
Volume divergence
Bias: Short-term bearish correction, bullish structure intact as long as price holds the channel.

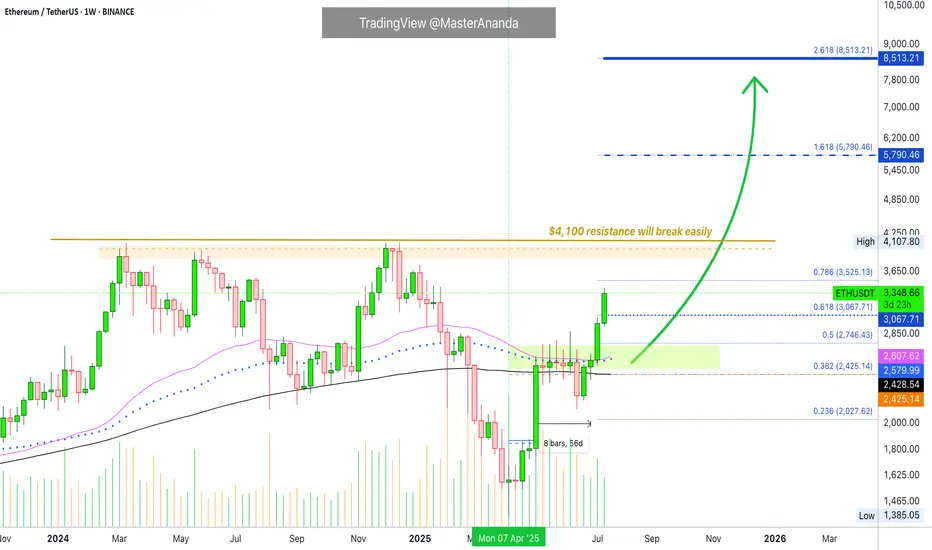
Ethereum · Going beyond $5,790 · $8,513 Next TargetThe eight weeks of consolidation, 56 days, happened as compressed (sandwich style) action right in-between MA200 and EMA55/89.
The EMA55/89 duo worked as resistance while MA200 worked as support.
Before a major move the market always tends to produce a form of shakeout. Sometimes it is call a bear-trap, a shakeout, a liquidity-hunt or stop-loss hunt event, a failed signal, etc.
Here Ether (ETHUSDT) closed below MA200 one week just to recover the next. In this case, we will call it a failed breakdown but we know this is a way to liquidate over leveraged long-traders, also a way to catch unsuspecting bears ready to short. The conclusion is simple, Ether recovered the next week above MA200 and the following week above EMA55/89 which worked as resistance for six weeks. With these levels behind us, the market is full green.
Notice the last two candles, big huge green candle. That is because resistance is no more.
With no resistance to stop prices from rising, Ethereum started to grow and we are now in full blown bullish mode.
The last major high sits at $4,107. This is an easy target, the minimum. Once support is tested the action moves toward resistance and this is where we are headed.
Some people will wonder if resistance will break or hold. Some unsuspecting bears, again, will even short at resistance thinking this is the logical move, they will lose all.
The truth is that this resistance and major high will break easily, we know this based on marketwide action and Bitcoin, Bitcoin is hitting new all-time highs every other day. In this way, we know that Ethereum will soon catch up and do the same.
Many altcoins are moving forward and growing, and some already conquered their December 2024 high price. This is another indication that shows Ether will not stay behind.
Whatever you do when Ethereum goes up, do not short. You can short if you are going to close the short after just a few hours or a few days, but instead of shorting a bullish trend, go LONG and enjoy maximum profits on the way up.
» Ethereum will break $6,000 and move toward $8,500 and beyond in the long-run.
You read it here first.
Thanks a lot for your continued support.
Resistance will break and the altcoins market will continue to grow. Not only for a few months but for a very long time.
When correction time comes, it will last a few months, we will get higher lows and then additional growth. Think of the pattern that came up on Bitcoin but with the altcoins; long-term growth.
Namaste.
ETHEREUM WILL KEEP GROWING|LONG|
✅ETHEREUM is trading in a
Strong uptrend and the coin
Broke the important horizontal level
Of 3000$ which is now a support
And we are very bullish biased
And we think that ETH will
Reach at least the previous ATH
Of just short of 5000$ but the
First target is to reach and break
A resistance level of 4100$
LONG🚀
✅Like and subscribe to never miss a new idea!✅
Disclosure: I am part of Trade Nation's Influencer program and receive a monthly fee for using their TradingView charts in my analysis.

ETH — Trade Closed! Massive Profit SecuredI’m officially closing my Ethereum position — this trade is now a success story!
I posted right here that ETH was a buy at $2400, then doubled down at $1800. I even echoed the call on Reddit for good measure.
Today, I’m liquidating the entire position with a huge gain. No regrets, just clean execution. 🧠💸
To all the mad lads still holding — good luck and may your conviction be rewarded.
See you next year for the next big swing.
Take your profits, you lunatics! 😄🔥

Major Breakout– Ethereum Broke Free from 'Clashing Resistances'🚀💥 Major Breakout – Ethereum Broke Free from the Clashing Resistances 🔓🟣
ETH has finally done it.
After months of battling overlapping resistances — the Clashing Stones, as we called them — Ethereum has broken out, and $2,912 is now acting as support, not resistance.
This breakout isn't just technical, it’s structural.
The previous 1-2-3 rejection setup has now been invalidated.
🔎 Chart Summary:
✅ $2,912 = confirmed breakout zone
🎯 Destination 1: $4,881 (if Vitalik’s asleep 😴)
🚀 Destination 2: $6,443 (if he wakes up 💡)
🔭 Scroll up for Destination 3
This is the real ETH breakout we’ve waited for — not hopium, not chop. This is clear structure.
If BTC stabilizes near 114,921+, ETH could enter outperformance mode and gain serious traction on the ETH/BTC chart.
📢 Keep your eyes on narrative catalysts:
ETH ETF, L2 growth, and Vitalik waking up...
We are officially off the resistance — and heading to where few have charted before.
One Love,
The FXPROFESSOR 💙
📌 Long — as long as $2,912 holds. If it fails, you already know what to do.
Disclosure: I am happy to be part of the Trade Nation's Influencer program and receive a monthly fee for using their TradingView charts in my analysis. Awesome broker, where the trader really comes first! 🌟🤝📈

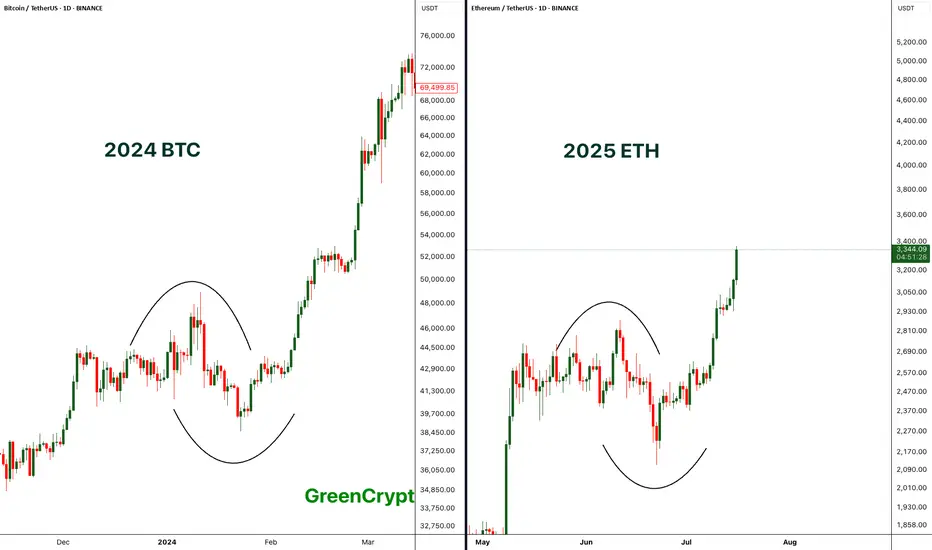
Comparing BTC 2024 with ETH 2025 - Perfect Match- If compare the chart pattern of BTC from 2024 with the current 2025 ETH pattern, wee see exactly similar chart patterns being formed here.
- Price started consolidating then it had fake breakout towards both the sides and finally the real breakout.
- BTC breakout push the price towards the new all time high above 69K, if we ETH follows similar trend then we can expect new all time high on ETH.
Let's see how it plays out.
Stay tuned for more updates.
Cheers
GreenCrypto
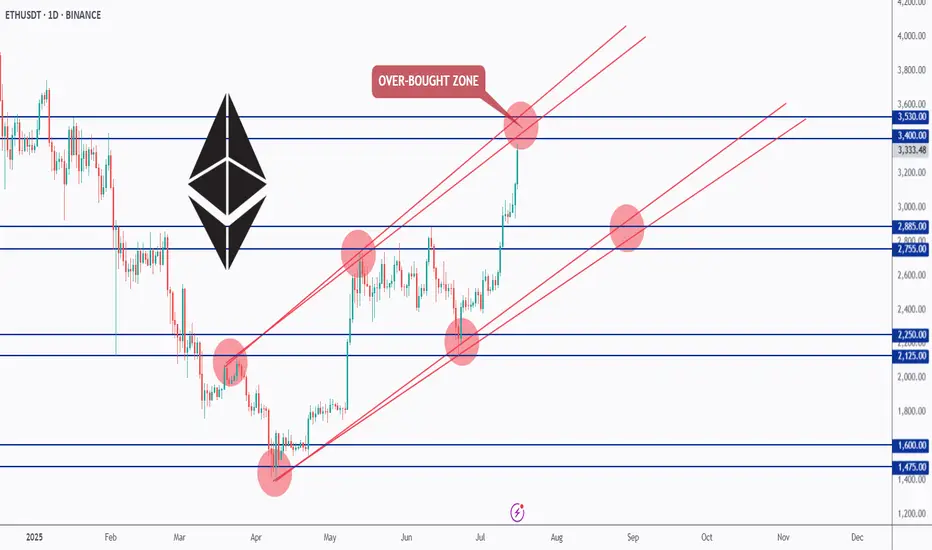
ETH Testing Overbought Zone — What’s Next?📊ETH has been overall bullish, trading inside this rising red channel for months.
After breaking above the $2,885 resistance, bulls took full control, and price is now approaching the upper red trendline — an overbought zone where we’ve seen rejections before.
As long as ETH holds above the $2,885 zone, the bulls remain in control. But since we’re near a strong resistance and the top of the channel, we’ll be waiting for a potential correction or at least a slowdown in momentum before looking for fresh entries.
📌 Key levels to watch:
Resistance: $3,400 – $3,530
Support: $2,885 – $2,755
Let’s stay patient and follow the market’s lead. 🧠
Let me know your thoughts in the comments 👇
📚 Always follow your trading plan regarding entry, risk management, and trade management.
Good luck!
All Strategies Are Good; If Managed Properly!
~Richard Nasr
BITCOIN- MONSTER ORDERS IN THE BOOK -> You Know What This Means COINBASE:BTCUSD “Monster orders” are exceptionally large buy-limit orders clustered roughly 7 % beneath the current market price.
Large buy-limit walls can act like a price magnet—deep liquidity attracts algos and traders hunting fills, often pulling price straight toward the level.
Once the wall absorbs the selling pressure, the magnet flips: liquidity dries up, supply thins, and price can rip away from that zone with force.
They create a visible demand wall in the order book, signalling that whales / institutions are ready to absorb a dip and accumulate at that level.
Price will often wick into this zone to fill the wall, then rebound sharply—treat the 7 % band as potential support or entry.
Such walls can act as liquidity traps : market makers may push price down to trigger retail stop-losses before snapping it back up.
Confirm that the wall persists as price approaches and that spot + derivatives volume rises; if the wall disappears, it may have been spoofing.
Always combine order-book context with trend, momentum and higher-time-frame support for higher-probability trades, Just like the extremely powerful indicators on the chart.
🚀 Marty Boots | 17-Year Trader — smash that 👍, hit LIKE & SUBSCRIBE, and share your views in the comments below so we can make better trades & grow together!

Ethereum Breakout and Liquidations – A Lesson in Bear Traps and 📚💥 Ethereum Breakout and Liquidations – A Lesson in Bear Traps and Risk Management 🧠📈
Today, July 16th, Ethereum gave us a real-time masterclass in market psychology and risk management.
Let’s start with the facts:
📊 Liquidation Data
🔻 $36.34M in long liquidations
🔺 $86.02M in short liquidations
💣 Total ETH liquidations: $122.36M (data mentioned on video might differ, i made a small mistake)
🌐 Across crypto: $351M liquidated (more shorts than longs)
This imbalance tells us one thing: a bear trap played out, and it played out hard.
🧠 Educational Takeaways
1. Bear Traps Are Real — and Expensive
A bear trap occurs when the market appears bearish, drawing in short sellers — only to violently reverse upward. Today’s Ethereum move was a textbook example. If you’ve been following my analysis, we discussed the regression lines, divergences, and structure that all warned against going short at support.
2. Open Interest and Sentiment Signals
Open interest has been declining — which means fewer speculative positions. That often creates space for a real, organic move, not one fueled by overleveraged noise.
3. Spot vs. Leverage – Risk Control First
Leverage isn’t the enemy — unmanaged leverage is. I personally use a dedicated high-risk account to trade fast setups. This keeps my core capital untouched and my psychology stable.
✅ Risk is defined before the trade.
✅ Entries are structured like bullets — small, multiple attempts.
4. The Mental Game is the Real Game
Trading isn’t just technical. It’s deeply psychological. Whether you’re trading Ethereum, Bitcoin, or altcoins like AVAX and XRP, emotions must be managed before capital is deployed.
5. Like-Minded Community = Sharper Edge
My best trades and insights often come from conversations with trusted, sharp minds in this space. Surrounding yourself with serious traders can be the difference between evolving — and evaporating. To my brother Vlatko (met on Tradingview, been hanging around online ever since, met in person once, now a true friend that we frequently disagree but always agree to respect and empower each other = The power of our community here on TV!)
Final Word:
When markets move fast, lessons appear even faster.
Study the traps. Respect the levels. Structure your risk.
And above all: trade with a plan that allows joy.
One Love,
The FXPROFESSOR 💙
Disclosure: I am happy to be part of the Trade Nation's Influencer program and receive a monthly fee for using their TradingView charts in my analysis. Awesome broker, where the trader really comes first! 🌟🤝📈

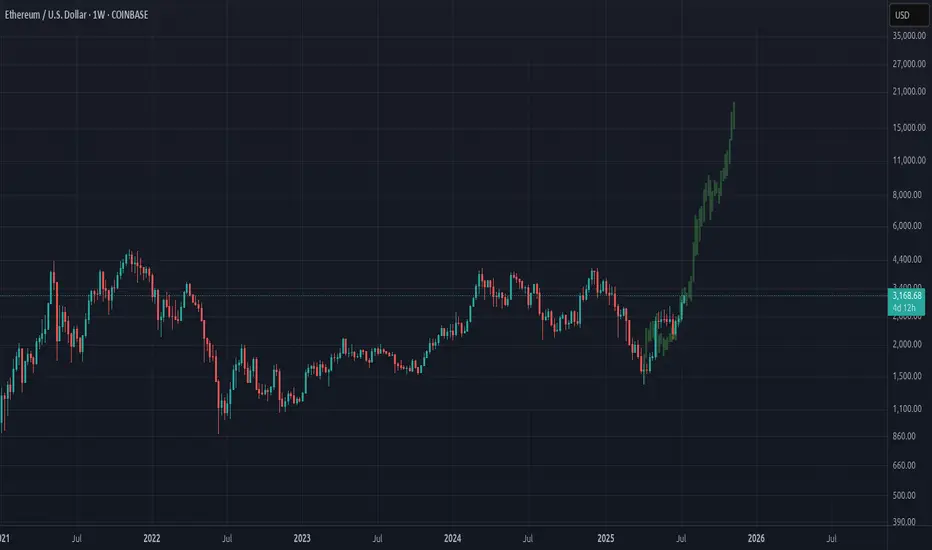
Ethereum LFGFractal from beginning of last cycles bull market. Estimated target $20K by November/December 2025. Significant pull-back around physiological level of $10K in autumn.
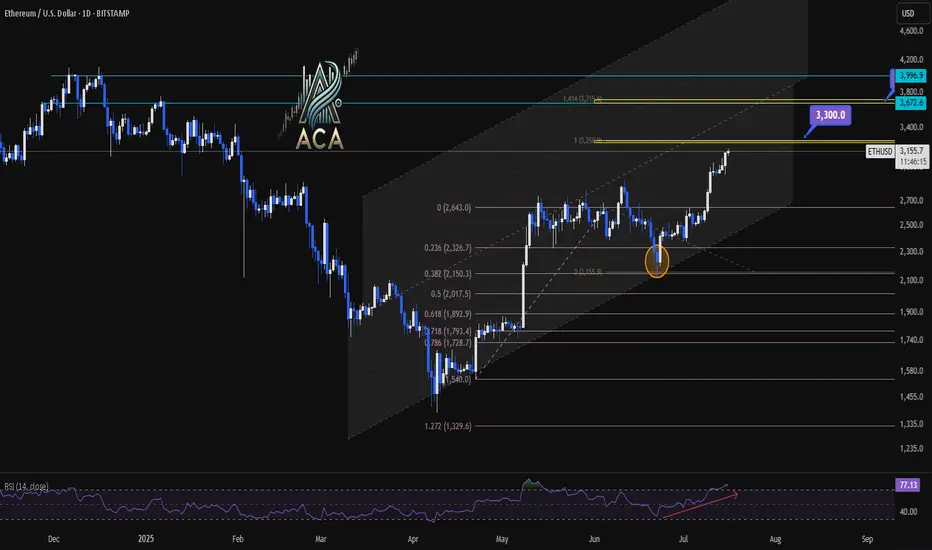
ETHUSDT 1D Chart Analysis | RSI Strength & Fibonacci TargetsETHUSDT 4H Chart Analysis | RSI Strength & Fibonacci Targets in Play
🔍 Let’s break down the latest ETH/USDT setup — bullish momentum is building with confluences pointing toward key upside targets.
⏳ 4-Hour Overview
Ether continues climbing within a well-defined ascending channel, with recent candles holding above mid-level support. Price is pressing higher from a clean bounce at the 0.5 and 0.618 Fibonacci retracement zone ($2,017–$1,899), signaling the correction has likely ended.
📉 Fibonacci Levels & RSI Confirmation
- The strong recovery aligns with rising volume and a bullish structure.
- RSI is pushing into overbought territory (above 73), often a sign of strength during trends—not exhaustion.
- ETH is now positioned for a breakout continuation move if momentum holds.
🎯 Bullish Targets Ahead
- Immediate resistance: $3,300 (1.414 Fib extension + historical supply)
- Next major target: $3,700 (1.618 extension + upper channel confluence)
- Pullback zones: $2,950 (mid-channel) and $2,017 (Fib support base)
📊 Key Highlights:
- Price is respecting the rising channel structure — higher lows, higher highs in play.
- Volume supports the breakout narrative, rising on green candles.
- RSI breakout supports trend continuation, not exhaustion.
- Targets at $3,300 and $3,700 remain actionable on a confirmed breakout.
🚨 Conclusion:
ETH is showing a multi-variable bullish setup with clear continuation potential. A strong move above $3,300 could quickly send price toward $3,700. Pullbacks to $2,950–$2,017 could offer high-risk/reward re-entry zones. Momentum favors bulls — stay alert.