ETH Daily: Lower High, Lower Low. That Was My Signal
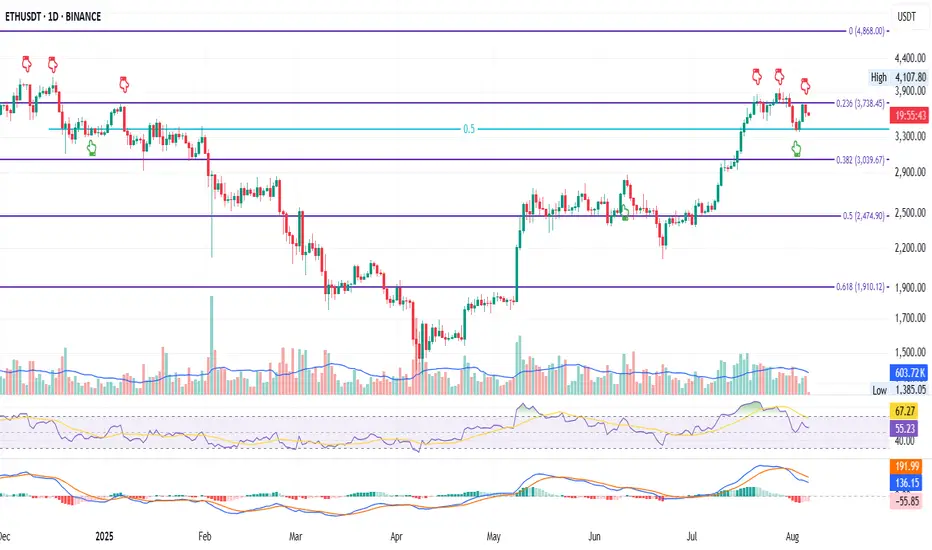
This is ETH on the Daily
Price action today looks very similar to December 2024.
Back then, ETH attempted twice to flip the 0.236 Fib level at $3378.45 — first on Dec 6, then on Dec 12. Both failed. Price found support at the 0.5 (midpoint between the 0.236 and 0.382), bounced, got rejected again at the 0.236, then went lower.
Now, we’re seeing a near-identical pattern:
– First attempt to reclaim the 0.236 Fib on July 21
– Second attempt on July 27
– Both failed
– Price found support again at the 0.5 middle level
– Bounced back to the 0.236
– Got rejected again
What will happen this time?
For me, the answer already came: we’ve now seen a lower low followed by a lower high — a temporary break of bullish structure. That’s my cue to scale out of my long and reduce exposure so I’m not caught off guard overnight.
Now that I’ve done that, I can observe the chart objectively without emotional bias or panic-selling.
Technically, ETH is in a short-term downtrend.
Fundamentally, however, I believe we’re in the early stages of a larger uptrend, driven by strong bullish news around crypto (happy to list them if you're curious).
But until those bullish narratives start kicking in and price moves up again, I have to be extremely careful not to get wiped out — so I’ll stay closely aligned with price action.
Like I said: short-term downtrend, long-term opportunity.
Always take profits and manage risk.
Interaction is welcome.
Ethereum (Cryptocurrency)
Ethereum Returns to Key Resistance Zone After 401(k) NewsAfter last week’s panic selloff triggered by major payrolls revisions, Ethereum is now back at a key resistance level. The rebound has been fueled in part by President Trump signing an executive order allowing cryptocurrencies in 401(k) plans. With more than $12 trillion in assets, the 401(k) market could have a significant impact on crypto prices, even if only a small fraction flows into the sector. Bitcoin and Ethereum are likely to capture the lion’s share of these inflows, especially with ETF access already established.
Adding to the optimism, Axie Infinity’s co-founder recently stated that the project is considering a return to the Ethereum network, which could provide an additional boost.
However, it all comes down to the key daily resistance zone, which includes the 4110 horizontal resistance and the daily downtrend line at 3960. For Ethereum to fully kick off its next bull run, it will need to break and hold above the 3960–4110 zone.

Ethereum is consolidating ┆ HolderStatBYBIT:ETHUSDT is trading within a consolidation zone just under $4000 after rallying from sub-$3000 levels. The trend remains strong with prior triangle and consolidation patterns fueling upward moves. A continuation breakout may test the $4000 barrier soon.

ETH to 19k by Dec 17. BTC Aug 2017- identical $/time to ETH nowOn this day, August 2017 BTC was trading at approximately $3400-$3600.
By Christmas, it hit 19.8k. I expect a similar outcome with in ETH 2025.
Leverage causing liquidations on both sides and volatility the whole way up.
Be right and sit tight. These opportunities happen very infrequently. Don't fumble the bag.

Ethereum - DAILYHi
Ethereum Daily on Sell position...
Be careful and take advantage of the opportunity.

Ethereum Profit-Taking in Progress, Longterm Bullish Case StandsEther was unable to break above the trendline following its strong rally. In the medium term, our base case remains bullish, with expectations of over 100% return within a year. However, in the short term, some downward pressure and profit-taking are currently in play.
Two days ago, the Ethereum ETF experienced its largest single-day net outflow. If this turns into a trend, a broader selloff may begin. Should ETH approach the 3000 level, it could present a strong opportunity to re-enter from the bullish side.
There is also a chance of a trendline breakout occurring before a significant downward reaction. If that happens, it would suggest that demand for ETH is stronger than previously realized, and our base case may actually be too conservative.

ETH | Ethereum Game Plan - Swing Long IdeaETH | Ethereum Game Plan - Swing Long Idea
📊 Market Sentiment
Market sentiment remains bullish, supported by expectations of a 0.25% rate cut at the upcoming FOMC meeting. The weakening USD and rising risk appetite across global markets are favoring crypto assets in particular.
📈 Technical Analysis
Price swept the range low (Weekly Fair Value Gap), resulting in a deviation.
It then aggressively reclaimed higher levels and closed above key resistance.
A 12H demand zone was formed during this move.
We’re now seeing a retracement towards that 12H demand zone.
📌 Game Plan
I’m looking for price to hit the 12H demand zone at $3,530 and show a strong reaction.
This level is also below the 0.5 Fibonacci retracement, placing it in the discount area — an ideal entry zone for me.
🎯 Setup Trigger
After price taps the demand zone, I want to see a 1H–4H bullish break of structure to confirm the reversal before entering.
📋 Trade Management
Stoploss: Below 1H–4H swing low
Targets:
• TP1: $3,872
• TP2: $4,090
I’ll trail my stop to lock in profits aggressively as price moves in my favor.
💬 Like, follow, and comment if this breakdown supports your trading!
More setups and market insights coming soon — stay connected!

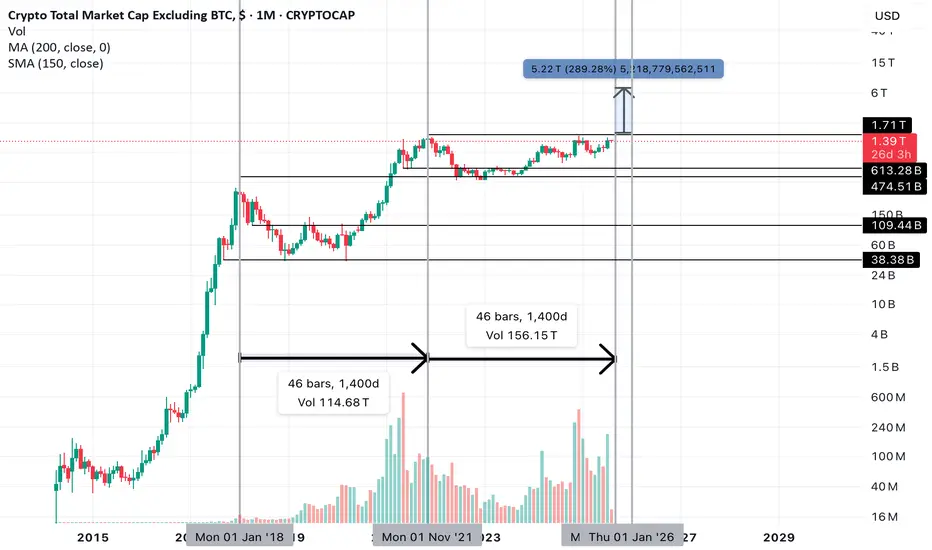
Alt Season? Buy dips, then run it turbo. 1400 days...? Then up. It took exactly 1400 days from the previous all time high (ATH) set in alts (excluding BTC) in early Jan 2018 to break that level again in 2021 to form our current all time high resistance.
Alts have tapped the ATH set in 2021 3-4 times. And it will be 1400 days since the last all time high on September 1st.
Why do you think this time will be different?
I don't control the tape, but I trade it.
August maybe soft, but you'll remember this September and we'll be in funky town james brown price discovery before you know it. Just dont blow it. Buy liquidations and what's going up. By early Jan you'll be the man.
ETH 1H – Trendline + Demand Zone Converge, Will Bulls Step In?Ethereum is approaching a high-confluence zone on the 1H chart — where rising trendline support intersects with a prior demand zone that triggered the last major rally.
This area around $3,500–$3,430 represents a key test of short-term momentum and trend structure.
🔹 Technical Confluence
Strong ascending trendline from mid-July has held through 3 clean touches — and is now under pressure again.
The blue demand zone was the launchpad for ETH’s move toward $3,800, showing clear price memory.
Price is now approaching both zones while momentum is fully reset on the Stoch RSI.
🔹 Momentum & Setup
The Stoch RSI is hovering in oversold territory — just as ETH returns to structure.
A higher low in this zone would confirm buyer interest and setup a potential breakout toward $3,900+.
🔹 Scenario to Watch
A clean bounce + reclaim of local structure would confirm a bullish continuation setup.
Failure to hold this level could trigger a trendline break and deeper retracement — invalidating short-term bullish structure.
Will ETH defend this zone and continue the trend — or is a breakdown brewing?
Let me know your thoughts in the comments 👇

Ethereum (ETH/USDT) – Midline Break Retest and Channel Top in Si🔍 Technical Overview
Ethereum has recently broken above the midline of its descending channel, indicating a potential bullish shift within the short-term corrective structure. The price action suggests that we are currently witnessing a retest of the broken midline, which is now acting as dynamic support.
This behavior is consistent with smart money principles — where a previously broken internal structure gets tested before continuation.
⸻
🧠 NEoWave Context
Structurally, ETH appears to be developing a Contracting Corrective pattern, with the current leg likely evolving as Wave D. This wave typically exhibits strength and complexity, often stretching toward the channel top while still respecting broader consolidation boundaries.
⸻
💡 Smart Money Insights
• ✅ BOS already confirmed on LTF (1H, 4H) with higher lows
• 🔄 Price has reclaimed the internal broken structure (midline) and is retesting it
• 🔋 Bullish OB around $3,480–$3,510 acted as a launch zone for current leg
• 📍 Next resistance is the channel top near $3,740
⸻
📊 Trade Scenarios
🟩 Bullish Scenario (Preferred):
If the retest of the midline holds, ETH is likely to continue its move toward the upper boundary of the descending channel (~$3,730–$3,750). This aligns with Wave D expectations in complex corrections.
🟥 Bearish Invalidations:
A breakdown back below $3,520 and loss of the internal bullish structure would negate this short-term bullish scenario and reopen downside potential toward $3,350.
⸻
⚠️ Trader Tip:
Retests of internal structures like midlines or internal trendlines often provide low-risk continuation setups — if confirmed by bullish internal BOS.
⸻
✅ Conclusion
Ethereum remains technically corrective but with bullish momentum building within the channel. As long as the midline holds, we expect continuation toward the channel top, completing Wave D structure before potential reversal.
💬 Drop your alt counts or thoughts in the comments.
Where could Bitcoin and the rest of the market be headed?Just a brief overview of my thoughts on bitcoin and the rest of the market. We are currently sitting around the area that I had suspected may be our weekly low. Where we go from here is still unclear but I wanted to take time for a good overview and share my plans and how to trade it so that I could still be profitable even if we just chop for a while. Also, the potential for a true alt season may really be right around the corner. This is the type of term that has been thrown around so much lately but it has been years since we have had one. Alts have been lagging so I have some suspicion of what may happen next and share the things to look for to confirm this, and how I plan to trade accordingly.

Ethereum is approaching the key level ┆ HolderStatKUCOIN:ETHUSDT is consolidating between $3,368 and $3,866 following a strong impulse move. Sideways range formation and trendline support hint at bullish continuation. Breakout above $3,866 may resume the upward trend toward new highs.

THE CHART DOESN'T LIE: A NEW DAWN FOR ETHEREUM
🔍 TECHNICAL ANALYSIS
1. The long-term downtrend , which lasted approximately 3.5 years, has been **broken on the monthly chart**, signaling a confirmed breakout (BO).
2. The horizontal resistance level at 4045 USDT is a critical zone. This is expected to act as the next stop following the breakout. A clear breach of this level could potentially lead to **more aggressive upward movements**.
Note: We do not consider the all-time high at 4631 USDT to be a major resistance, as it previously acted not as a strong sell zone but rather as a **momentum acceleration point**. With the entry of new investors and resulting FOMO (Fear of Missing Out), we anticipate minimal resistance around this level.
3. Since its launch in 2016, the **MACD indicator** has issued three **buy signals** on the monthly timeframe:
* Two resulted in strong bull runs .
* One led to a ** 60% rally **.
* Currently, a new bullish crossover is forming.
4. The RSI indicator has historically provided clear insight into when rallies may begin to slow. In particular, the 88 level and above has marked overbought territory, which could be a suitable area for gradual profit-taking .
5. Important Fibonacci-based accumulation zones are located between 3262 and 2697 USDT.
🧠 FUNDAMENTAL ANALYSIS
1. Smart Contracts
Ethereum is a programmable blockchain that enables the execution of smart contracts—automated agreements without intermediaries.
🧠 Example: “If Team A wins, send payment automatically.”
2. Decentralized Application Platform (dApps)
Ethereum empowers developers to build dApps whose data is stored across the network, not on centralized servers—making it resistant to censorship.
3. Foundation of DeFi and NFT Ecosystems
* Most DeFi platforms (lending, staking, earning interest) are built on Ethereum.
* Roughly 80% of NFTs originated on Ethereum (OpenSea, Bored Ape, CryptoPunks, etc.).
4. Approval of Spot Ethereum ETFs (U.S.)
* Following Bitcoin ETFs, some Ethereum spot ETFs have been approved.
* This has **opened the door to institutional investment**, creating **upward price pressure**.
5. ETH 2.0 Upgrade & Staking
* Ethereum transitioned from Proof of Work to Proof of Stake, making the network more sustainable and scalable.
* Users can now stake ETH to earn passive income.
6. Enterprise Adoption
* Corporations such as Visa and JPMorgan are testing Ethereum’s infrastructure.
* Use cases: payments, data storage, contract management.
7. Favorable Regulatory Shifts Support Altcoins
* U.S. laws like GENIUS and CLARITY have laid a framework for stablecoins.
* This has increased institutional interest in **infrastructure coins** like Ethereum and Solana.
8. Capital Rotation into Altcoins
* While Bitcoin consolidates between \$115K–\$118K, capital is flowing into altcoins.
* Tokens like XRP, DOGE, BONK, PEPE, HYPE have surged.
* XRP is particularly favored due to its enterprise use case, with price targets of \$4–\$6 being speculated.
9. Growth in Futures and Institutional Trading
* CME Group data shows growing open interest in Solana and XRP futures.
* ETH farms also reflect strong institutional interest, as companies begin to hold crypto assets under treasury models.
10. Risks to Monitor
* Potential downward pressure may come from **Fed rate decisions**, **ETF inflows/outflows**, *miner selling, or regulatory actions (e.g., MiCA).
* Altcoins remain volatile and sensitive to regulation.
💹 IN SUMMARY – Key Accumulation Zone:
3262 – 2697 USDT
We haven't provided detailed Ethereum analysis in a while, as both technical and fundamental structures often require time to form. In short: not all assets are worth analyzing until they are.
"Wealth does not come from the number of trades, but from the patience to wait for the right trade." – Bull Investment
⚠️ DISCLAIMER:
Maintain proper capital and risk management to protect your psychology during market corrections.
This analysis is for educational purposes only and does not constitute financial advice. Making decisions based on this commentary may lead to losses.
Avoid following unverified tips and rumors.

ETHUSD bullish consolidation supported at 3,485The ETHUSD remains in a bullish trend, with recent price action showing signs of a corrective pullback within the broader uptrend.
Support Zone: 3,485 – a key level from previous consolidation. Price is currently testing or approaching this level.
A bullish rebound from 3,485 would confirm ongoing upside momentum, with potential targets at:
3,800 – initial resistance
3,855 – psychological and structural level
3,930 – extended resistance on the longer-term chart
Bearish Scenario:
A confirmed break and daily close below 3,485 would weaken the bullish outlook and suggest deeper downside risk toward:
3,372 – minor support
3,240 – stronger support and potential demand zone
Outlook:
Bullish bias remains intact while the ETHUSD holds above 3,485. A sustained break below this level could shift momentum to the downside in the short term.
This communication is for informational purposes only and should not be viewed as any form of recommendation as to a particular course of action or as investment advice. It is not intended as an offer or solicitation for the purchase or sale of any financial instrument or as an official confirmation of any transaction. Opinions, estimates and assumptions expressed herein are made as of the date of this communication and are subject to change without notice. This communication has been prepared based upon information, including market prices, data and other information, believed to be reliable; however, Trade Nation does not warrant its completeness or accuracy. All market prices and market data contained in or attached to this communication are indicative and subject to change without notice.

ETH/USDT | ETH Under Pressure – Watch $3500 Support!By analyzing the Ethereum chart on the weekly timeframe, we can see that after reaching the $3940 zone, ETH faced selling pressure and is now trading around $3540. If the price fails to hold the key $3500 support, a deeper decline is likely, with potential targets at $3040 first and possibly $2680 as the second bearish target.
Please support me with your likes and comments to motivate me to share more analysis with you and share your opinion about the possible trend of this chart with me !
Best Regards , Arman Shaban

TON/USDT |Toncoin Pullback – Watching for Bounce Toward $4.20+By analyzing the Toncoin chart on the 3-day timeframe, we can see that after reaching $3.73, the price has entered a correction phase and is currently trading around $3.30. We should soon watch for a potential bullish reaction from the $3.03–$3.30 zone. If the next upward move begins, the bullish targets will be $3.74, $4.20, and $4.68.
Please support me with your likes and comments to motivate me to share more analysis with you and share your opinion about the possible trend of this chart with me !
Best Regards , Arman Shaban

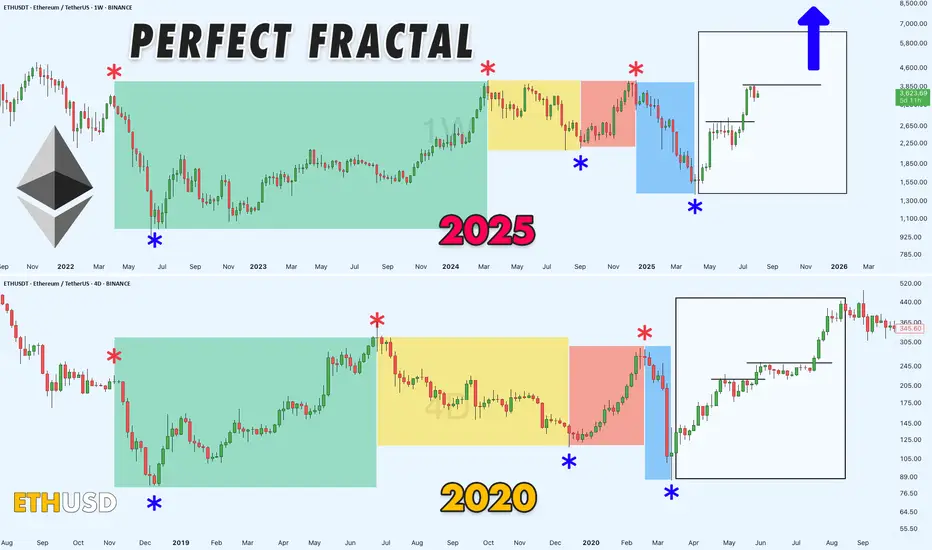
Haven't Posted in a Bit, Here's a Solid Chart for You All!Alright, been a while, but here's the deal: still no altseason in sight.
Meanwhile, ETHUSDT dropping some serious hints of a wild bull run on this fractal chart. It s got that 2020 vibe, though the timing s a tad off especially when you factor in Bitcoin s cycles.
Gonna be a blast watching this play out!
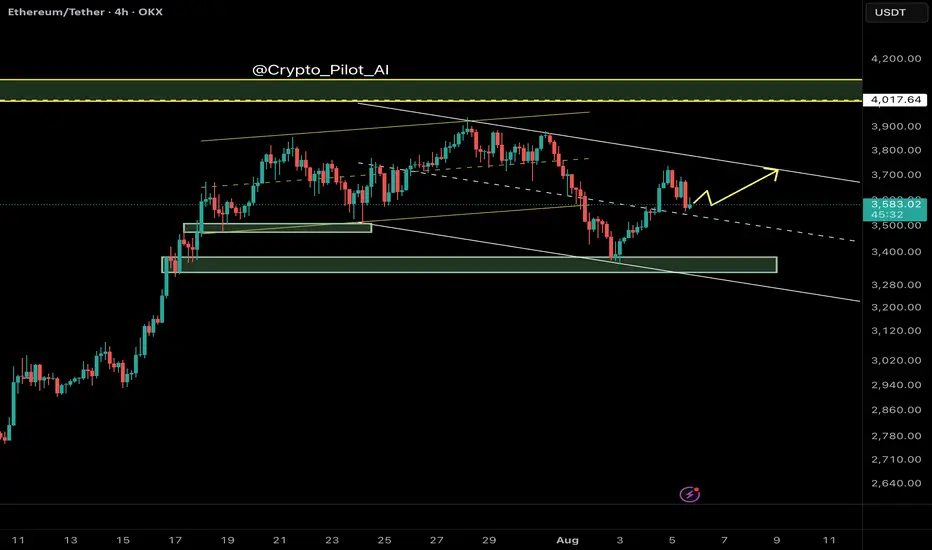
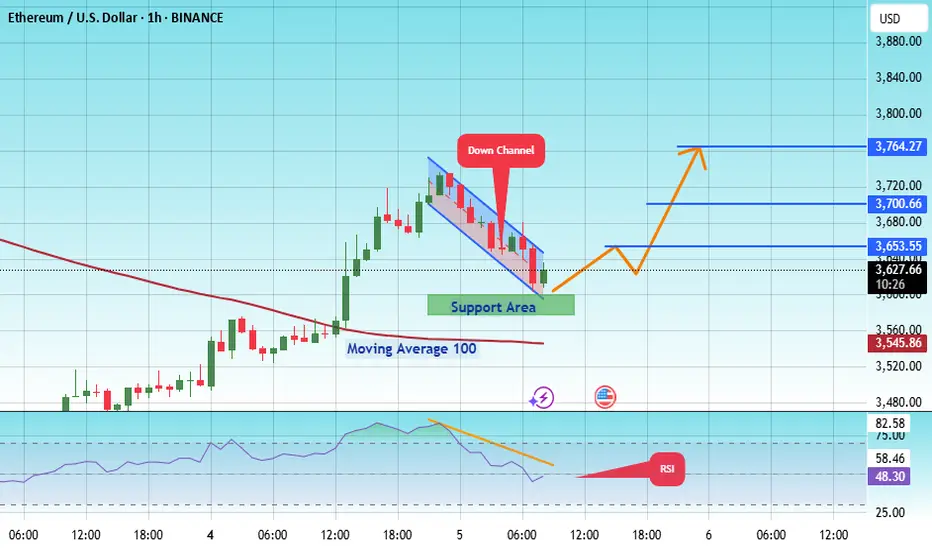
#ETH/USDT : Price is going as expected in previous ideas on eth#ETH
The price is moving within an ascending channel on the 1-hour frame, adhering well to it, and is on track to break it strongly upwards and retest it.
We have support from the lower boundary of the ascending channel, at 3593.
We have a downtrend on the RSI indicator that is about to break and retest, supporting the upside.
There is a major support area in green at 3582, which represents a strong basis for the upside.
Don't forget a simple thing: ease and capital.
When you reach the first target, save some money and then change your stop-loss order to an entry order.
For inquiries, please leave a comment.
We have a trend to hold above the 100 Moving Average.
Entry price: 3626.
First target: 3653.
Second target: 3700.
Third target: 3764.
Don't forget a simple thing: ease and capital.
When you reach your first target, save some money and then change your stop-loss order to an entry order.
For inquiries, please leave a comment.
Thank you.
Ethereum PumpingA breakthrough is coming for Ethereum after testing $3800 for the fourth time, with $8000 as the target.

Ethereum pumpingA breakthrough is coming for Ethereum after testing $3800 for the fourth time, with $8000 as the target.

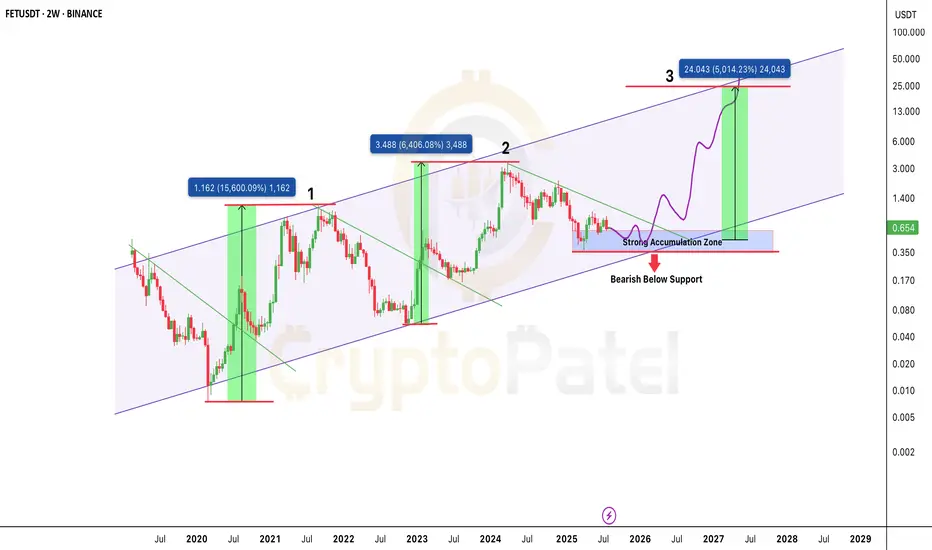
$FET is back in the zone that sparked 15,000%+ rallies?NYSE:FET is back in the zone that sparked 15,000%+ rallies. Same setup. 50x incoming?
FET continues to respect its multi-year ascending channel structure, active since 2020.
Price Action History:
🔹 Wave 1 (2020–2021): +15,600% rally from channel support to resistance
🔹 Wave 2 (2022–2024): +6,400% move following a similar breakout pattern.
🔹 Current Cycle (2025): Price is consolidating in the same accumulation range of $0.35–$0.65.
Key Demand Zone: $0.35–$0.65
Upside Target: ~$24.00 (5,000%+ potential)
🔻 Breakdown Level: Below $0.35 = Structure invalidation
Structure Insight:
Each macro move begins with:
🔹 Accumulation at channel support
🔹 Break of falling trendline
🔹 Aggressive expansion toward the upper boundary
The projected Wave 3 follows this same path if demand zone holds. The structure remains bullish as long as price stays above $0.35.
FET is trading at a high probability accumulation level within a valid macro trend. If history repeats, this could be the next major leg up.
✅ Favor long accumulation strategies
❌ Exit plan needed below $0.35
NFa & DYOR
Bearish revrsal?The Ethereum (ETH/USD) is rising towards the pivot and could reverse to the 1st support.
Pivot: 3,760.94
1st Suport: 3,372.83
1st Resistance: 3,936.31
Risk Warning:
Trading Forex and CFDs carries a high level of risk to your capital and you should only trade with money you can afford to lose. Trading Forex and CFDs may not be suitable for all investors, so please ensure that you fully understand the risks involved and seek independent advice if necessary.
Disclaimer:
The above opinions given constitute general market commentary, and do not constitute the opinion or advice of IC Markets or any form of personal or investment advice.
Any opinions, news, research, analyses, prices, other information, or links to third-party sites contained on this website are provided on an "as-is" basis, are intended only to be informative, is not an advice nor a recommendation, nor research, or a record of our trading prices, or an offer of, or solicitation for a transaction in any financial instrument and thus should not be treated as such. The information provided does not involve any specific investment objectives, financial situation and needs of any specific person who may receive it. Please be aware, that past performance is not a reliable indicator of future performance and/or results. Past Performance or Forward-looking scenarios based upon the reasonable beliefs of the third-party provider are not a guarantee of future performance. Actual results may differ materially from those anticipated in forward-looking or past performance statements. IC Markets makes no representation or warranty and assumes no liability as to the accuracy or completeness of the information provided, nor any loss arising from any investment based on a recommendation, forecast or any information supplied by any third-party.

ETH-----Sell around 3670, target 3600 areaAugust 5th ETH Contract Technical Analysis:
Today, the daily chart closed with a small bullish candlestick pattern, with consecutive bullish candlesticks and prices consolidating at high levels. The accompanying indicator formed a death cross. The price did not break through the previous high on the pullback, so the overall downtrend is still favorable. However, it should be noted that yesterday's pullback interrupted the ongoing downward trend, so this is important to note. The hourly chart showed continued gains during the European and American sessions, while prices came under downward pressure during the Asian morning session. The current candlestick pattern is a series of bearish candlesticks, with the accompanying indicator forming a downward death cross. This suggests a continued upward trend within the next few days, but the strength and impact of the European session remain important to monitor.
Today's ETH Short-Term Contract Trading Strategy:
Sell on pullbacks to the 3670 area, with a stop loss at 3700 and a target at 3600.
