ETHEREUM ahead of the most critical break-out of the Cycle.Ethereum (ETHUSD) is on the cusp of a major bullish break-out as this week it is already trading above its 1W MA50 (blue trend-line). If it manages to close the 1W candle above it, it will be the first time since January 06 2025 to do so.
This whole price action remains inside a massive Megaphone pattern and resembles the same structure ETH had during June 24 2019 - July 20 2020. Both patterns had a final decline of around -67% with the 2020 structure eventually starting a (green) Channel Up that broke above the Megaphone and made a first Top on the 1.382 Fibonacci extension.
As a result, if the break-out does happen this time around also, we expect the emerging Channel Up to target at least $6300 (Fib 1.382 ext).
-------------------------------------------------------------------------------
** Please LIKE 👍, FOLLOW ✅, SHARE 🙌 and COMMENT ✍ if you enjoy this idea! Also share your ideas and charts in the comments section below! This is best way to keep it relevant, support us, keep the content here free and allow the idea to reach as many people as possible. **
-------------------------------------------------------------------------------
💸💸💸💸💸💸
👇 👇 👇 👇 👇 👇
Ethereum (Cryptocurrency)

ETH Not Taking Profits Yet – System Still Long
ETH on the 4H is pausing right at the 3D 200MA, picture perfect, actually.
Now we wait to see if this resistance flips into support.
If that happens, price could go for the 0.382 Fib level around $3,040.
Of course, that’s the ideal scenario, but the market could easily contradict me, so keep that in mind.
Personally, it’s not time to take profits yet.
Both my 4H and 1D systems are still in long positions.
For extra safety, you could set a partial take-profit just under the second-to-last PSAR dot.
Always take profits and manage risk.
Interaction is welcome.

Ethereum & monthly 20MAEthereum is gaining strength and will likely break above the monthly 20 MA. Will it maintain this momentum by month's end and remain bullish in the coming months?
Good luck HODLRS ✌️🤞

ETH Decision Zone: Breakout or Bull Trap?Ethereum (ETHUSD) just broke out of a tight symmetrical triangle on the 1H chart — but price is now stalling near the previous high, signaling a critical decision point.
📊 Key Technical Notes:
🔹 Triangle Breakout: Clean push above downtrend resistance, but no candle close above key high.
🔹 Previous High Acting as Resistance: Bulls need continuation to validate this move.
🔹 Two Scenarios in Play:
1️⃣ Bullish Continuation:
→ ETH breaks and holds above ~$2,865
→ Next resistance levels sit at $3,000+
2️⃣ Bearish Rejection / Fakeout:
→ Rejection from highs
→ Retest of triangle → Failure = drop toward previous low near $2,150
🎯 Risk-Reward Defined — both long and short setups are clearly outlined.

ETH POTENTIAL BULLISH GARTLEY Seeing a potential bullish gartley forming on ETH if it is unable to break above the .886 of the AB wave. Targets would be $2004 to $1786 for the .786 or 1.618 of the BC leg

ETHUSD h4 next move downThe resistance at 1.36554 may be weak due to:
Multiple taps already
Reduced seller interest
A breakout above this zone could trigger short covering → sharp rally
✅ 2. Higher Low Structure
Recent low at 1.35475 held strong
Current consolidation appears like a bullish flag or accumulation range
Could indicate continuation, not rejection
✅ 3. Fakeout Reversal Setup
If price dips into the support at 1.35475 again, it might:
Trap breakout traders
Reverse and form a new impulse leg upward
Target = 1.3700–1.3750 zone

ETH Pullback Before Next Rally? Hello guys!
Ethereum is currently testing a strong resistance zone around the $2,678 level, which has previously acted as a key barrier. Price action has been climbing steadily within an ascending channel, indicating a clear bullish trend in play.
However, since ETH is right at the resistance, we could see a short-term correction or pullback toward the $2,560–$2,580 support range (highlighted zone), which also aligns with the midline of the channel and previous consolidation structure.
If this support holds, a healthy bounce from this area would likely push ETH toward the next bullish target around the $2,760–$2,800 zone, which sits near the upper boundary of the current channel.

HolderStat┆ETHUSD retest of the resistance lineBINANCE:ETHUSDT has exited a falling wedge and is forming a bullish continuation pattern. With price action building above $2,500, a breakout toward $2,800 is in play, targeting the supply zone around $3,000. Structure favors bulls.

ETHEREUM BREAKOUT CONFIRMED!Hey Traders!
If you’re finding value in this analysis, smash that 👍 and hit Follow for high-accuracy trade setups that actually deliver!
After months of consolidation inside this massive symmetrical triangle, ETH finally breaks out on the daily chart—and this could be the spark for the next major rally! 🔥
📈 Structure: Symmetrical Triangle
✅ Breakout Confirmed
📍 CMP: ~$2,760
🎯 Next Major Target: $5,000+
This is the breakout bulls have been waiting for! If momentum sustains, ETH could enter price discovery territory soon. Buckle up—the real move might just be beginning. 🚀
Let’s see how far it runs from here!
Drop your targets in the comments 👇

Why Ethereum’s Will 10×🚀 Ethereum’s Next 10×: Why bank-grade adoption + the stable-coin avalanche make a moonshot look conservative
Big banks are building on-chain right now. JPMorgan & Bank of America began 2025 pilots for dollar-backed tokens that settle on Ethereum, while Societe Generale just unveiled its USD CoinVertible stable-coin on main-net.
Stable-coins already move more money than Visa + Mastercard combined. $27.6 trillion flowed through stable-coins in 2024—most of it routed over Ethereum block-space.
Ethereum clears four-fifths of that stable-coin volume. More than 80 % of all stable-coin transactions occur on ETH or its L2s, locking in network effects that rivals can’t match.
ETF wall-of-money is already hitting the gate. 2025 Ethereum ETFs posted a record $743 million month of inflows—the strongest vote of institutional confidence to date.
ETH supply keeps shrinking while demand spikes. Post-Merge burn has removed roughly 332 k ETH, flipping issuance negative; base-line inflation is now < –1.3 %/yr.
30 million ETH is locked in staking, slicing liquid float by 25 %. The yield engine tightens supply just as banks and ETFs need inventory.
Real-world assets are going token-native. Tokenized bond issuance jumped 260 % in 2024 to €3 billion, and virtually every pilot settles on ERC-standards.
Layer-2 roll-ups slashed average gas fees to <$4. Cheaper block-space makes day-to-day payments viable, driving still more stable-coin throughput (and fee burn).
User base is exploding toward mass scale. Active ETH wallets hit 127 million—up 22 % YoY—showing that retail, devs, and institutions are onboarding together.
Energy-efficient PoS removes the last ESG roadblock. With > 99 % less energy use than PoW chains, Ethereum checks the sustainability box that banks and asset managers need for wide-open deployment.
Bottom line: when TradFi giants plug directly into Ethereum rails and stable-coins dwarf legacy payment rails, every transfer torches a little more supply. Add the ETF flywheel and a vanishing float, and a 10× move shifts from “moon-boy” to math.
OTHER EXAMPLES
TSLA
www.tradingview.com
Total 2
www.tradingview.com
MartyBoots here—trading for 17 years, and I would like to hear YOUR take!
👉 Can Ethereum really 10× from here? Drop your best argument below, hit the 👍 if you learned something, and smash that Follow to stay in the loop on every crypto deep-dive I post.

ETHUSDTThis is very easy...
best support level 2300 to 2500 for jump price. but was needed for jump price for get enrgy for movement to high levels by fake breakout.
First level of resistance 2800 to 3000.
⚠️Control Money Management in your capital.

$ETH clear for an impulsive move to $3600?CRYPTOCAP:ETH has slowly but surely cleared resistance, with just the swing high to tackle which will activate another trade signal in my Trade Signals Substack.
Major support High Volume Node, daily pivot and daily 200 EMA proved tough support and demand continues to come in.
ETFs had an astonishing amount of inflows yesterday at $200M+
Analysis is invalidated below $2100
Safe trading

Ethereum Analysis – Vitalik’s Gas Cap Proposal Adds PressureToday, I want to show you the possible moves for Ethereum ( BINANCE:ETHUSDT ) this week.
Please stay with me .
Let’s first take a look at the important news that has come for Ethereum in the last 24 hours :
Ethereum’s Gas Cap Proposal Sparks Concerns
Ethereum co-founder Vitalik Buterin recently proposed EIP-7983 , introducing a gas limit cap to prevent potential DoS (Denial of Service) attacks on the network.
Bearish Takeaways:
This proposal reveals a current vulnerability in Ethereum’s infrastructure. If gas limits grow unchecked, nodes may fail to sync, leading to possible network instability.
Imposing a gas cap could temporarily reduce transaction throughput, affecting DeFi protocols and NFT platforms that rely on Ethereum’s scalability.
The market tends to react cautiously to core protocol changes, and this uncertainty could trigger short-term selling pressure.
Bullish Counterpoints:
The cap aims to strengthen the network’s long-term stability against spam and DoS attacks.
It’s still in the proposal stage, with no immediate impact on users or network performance.
Conclusion:
While the long-term impact may be positive, the short-term uncertainty and exposed risks provide a bearish narrative for Ethereum, especially amid growing competition from alternative chains.
--------------------------------------
Now let's take a look at the Ethereum chart on the 4-hour time frame .
Ethereum is currently trading near the Heavy Resistance zone($2,929-$2,652) and Resistance lines , and is also trying to break the Support line .
In terms of the Elliott Wave theory , it seems that Ethereum has completed the Zigzag Correction(ABC/5-3-5) , so we can expect the next bearish wave .
I expect Ethereum to fall to at least $2,433 AFTER breaking the Support line, and if the Support zone($2,491-$2,323) is broken, we should expect further declines.
Second Target: $2,374
Note: Stop Loss (SL) = $2,689= Worst Stop Loss(SL)
Please respect each other's ideas and express them politely if you agree or disagree.
Ethereum Analyze (ETHUSDT), 4-hour time frame.
Be sure to follow the updated ideas.
Do not forget to put a Stop loss for your positions (For every position you want to open).
Please follow your strategy and updates; this is just my Idea, and I will gladly see your ideas in this post.
Please do not forget the ✅' like '✅ button 🙏😊 & Share it with your friends; thanks, and Trade safe.

#ETH Update #2 – July 10, 2025🟢 #ETH Update #2 – July 10, 2025
Ethereum has formed a new high above its previous impulsive leg. Although this peak is lower than the one a month ago, the current structure looks healthy. During this move, ETH left an imbalance around the 2373 level, which aligns closely with a potential retracement zone. Volume appears to be decreasing or reaching exhaustion, suggesting the rally may be losing strength. A correction towards 2685 could be on the table. For now, the setup does not favor either a long or short position.

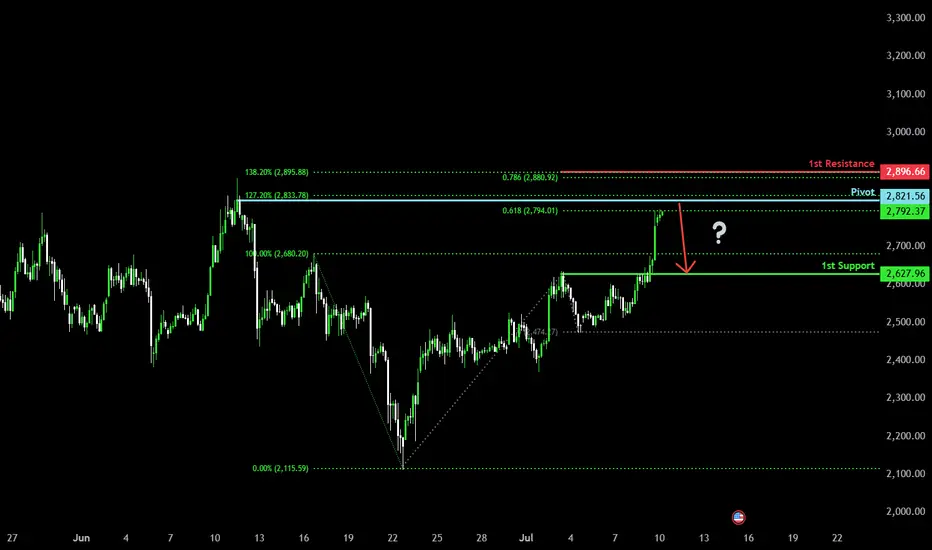
Heading into pullback resistance?Ethereum (ETH/USD) is rising towards the pivot, which has been identified as a pullback resistance and could reverse to the 1st support which acts as a pullback support.
Pivot: 2,821.56
1st Support: 2,627.96
1st Resistance: 2,896.66
Risk Warning:
Trading Forex and CFDs carries a high level of risk to your capital and you should only trade with money you can afford to lose. Trading Forex and CFDs may not be suitable for all investors, so please ensure that you fully understand the risks involved and seek independent advice if necessary.
Disclaimer:
The above opinions given constitute general market commentary, and do not constitute the opinion or advice of IC Markets or any form of personal or investment advice.
Any opinions, news, research, analyses, prices, other information, or links to third-party sites contained on this website are provided on an "as-is" basis, are intended only to be informative, is not an advice nor a recommendation, nor research, or a record of our trading prices, or an offer of, or solicitation for a transaction in any financial instrument and thus should not be treated as such. The information provided does not involve any specific investment objectives, financial situation and needs of any specific person who may receive it. Please be aware, that past performance is not a reliable indicator of future performance and/or results. Past Performance or Forward-looking scenarios based upon the reasonable beliefs of the third-party provider are not a guarantee of future performance. Actual results may differ materially from those anticipated in forward-looking or past performance statements. IC Markets makes no representation or warranty and assumes no liability as to the accuracy or completeness of the information provided, nor any loss arising from any investment based on a recommendation, forecast or any information supplied by any third-party.
DeGRAM | ETHUSD rebound from the support line📊 Technical Analysis
● Bounce off the purple up-trend and 2 320 support printed a bullish engulfing, maintaining the sequence of higher-lows that has guided price since April.
● Price is squeezing into an ascending triangle under 2 700-2 730, where the former wedge cap meets horizontal supply; a break projects to the 3 040 macro fib / channel roof.
💡 Fundamental Analysis
● Net-staking deposits keep rising while, per FXStreet (25 Jun), whales add ETH ahead of the SEC’s spot-ETF S-1 verdict, underpinning demand.
✨ Summary
Long >2 320; triangle breakout above 2 730 targets 3 040. Thesis void on a 16 h close below 2 200.
-------------------
Share your opinion in the comments and support the idea with like. Thanks for your support!

Ethereum Breakout Brewing: Higher Lows Point to $4,100Ethereum is showing signs of a major breakout setup on the 8H chart. The historical price action reveals a well-defined horizontal range, with ETH respecting the $2,200–$2,950 demand zone multiple times.
Key highlights:
🔹 Strong Reclaim: Price reclaimed the key range low around $2,300 with momentum.
🔹 Higher Lows Forming: Each bounce from support has built more bullish structure.
🔹 Targeting Range High Breakout: ETH has launched toward ~$4,100 after each reclaim.
🔹 Current Resistance: $2,950 remains the final barrier before blue sky.
If ETH can break and hold above that zone, historical structure suggests a move toward $4,100+ is well within reach.

ETH | Bullish Pattern - Cup and Handle +15%A Bullish pattern is appearing on the Ethereum chart.
From a Cup and Handle pattern, we can easily expect atleast a 15% increase. This is true for the near term. A +15% would put us here:
Just under $3K we may see heavy resistance. This is also the neckline resistance, as it was the previous support for the breakout that ultimately led to a new ETH ATH.
_______________________________
BYBIT:ETHUSDT

Ethereum Faces the 'Symplegades'– Will Pectra Propel It Through?Ethereum Faces the 'Symplegades' – Will Pectra Propel It Through?
⚔️🪨 Ethereum Faces the 'Symplegades' – Will Pectra Propel It Through? 🪨⚔️
In ancient Greek myth, the Symplegades — Clashing Rocks — tested Jason and the Argonauts with a narrow, deadly passage. Today, Ethereum faces its own mythic trial as price action presses into a critical zone.
📍 The $2,805–$2,848 resistance zone is acting like the Clashing Rocks — volatile, dangerous, and decisive. Beneath it, support rests near $2,616 and $2,565 . A breakout from this trap can open the way to $3,200+ , but rejection may mean another violent plunge. ⚠️
🔧 Enter: PECTRA – Ethereum’s Game-Changing Upgrade
Ethereum’s most ambitious upgrade since The Merge is nearly here. PECTRA isn’t just a backend update — it redefines how the network feels and functions:
🧠 Smarter Wallets
– Batch transactions
– Skip approval popups
– Pay gas in any token
⚡ Frictionless UX
– Fewer clicks
– No more endless “approve + confirm” loops
📉 Cheaper Transactions
– More blobs = better L2 scaling
– Lower fees, even during congestion
🌱 Staking Overhaul
– Validator cap raised to 2048 ETH
– Smart contract withdrawals
– Faster deposit recognition
🔓 Unlocking $490B in trapped value
– Assets become more accessible and usable
“The Merge changed how Ethereum works.
Pectra changes how it feels. ” – @ethereum
⛵ Will ETH Break Through the Clashing Rocks?
This is not just another consolidation box.
It’s a moment of mythic symmetry — where price action, fundamentals, and network transformation converge.
Sail through the Symplegades... or get crushed between them?
Stay sharp. Watch the breakout. The next move will be defining.
One Love,
The FXPROFESSOR 💙

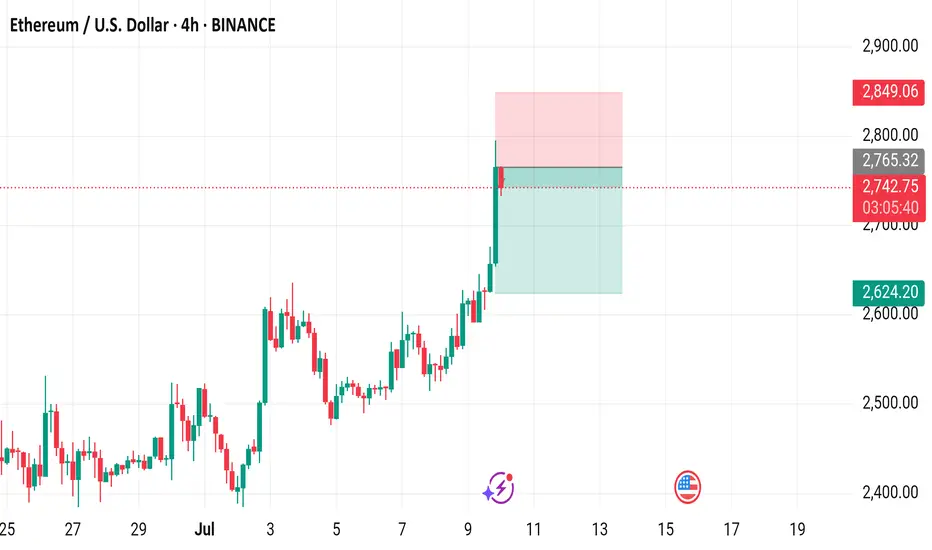
Ethereum / U.S. Dollar 4-Hour Chart (BINANCE)4-hour candlestick chart displays the price movement of Ethereum (ETH) against the U.S. Dollar (USD) on the BINANCE exchange. The current price is $2,740.99, reflecting a +$124.74 increase (+4.77%) in the last period. The chart includes a buy/sell indicator with no current activity (0.00), a resistance zone highlighted in pink, and a support zone in light green. The price has recently surged, breaking through the $2,740.99 level, with additional price points ranging from $2,400.00 to $2,949.06 shown on the right axis. The time frame spans from late June to July 10, 2025.
Altseason, just a thought ! Basically, right now we’re chilling in a major confluence zone — a whole bunch of important levels are stacked right here.
We’ve got:
The 0.78 Fib retracement holding it down
Volume profile support giving us a comfy cushion
That good old accumulation support from 2019–2021 saying “welcome back”
…just to name a few.
IMO, we’re in that sneaky “deviation/manipulation” phase before the real markup begins — a.k.a. altseason is warming up in the locker room.
If we actually hit the bull flag target… well, let’s just say the numbers start looking spicy. But hey, let’s not get ahead of ourselves — things can (and probably will) move faster than you think.
Alright, that’s the vibe. Let’s see how it plays out. Good night! 😴🚀

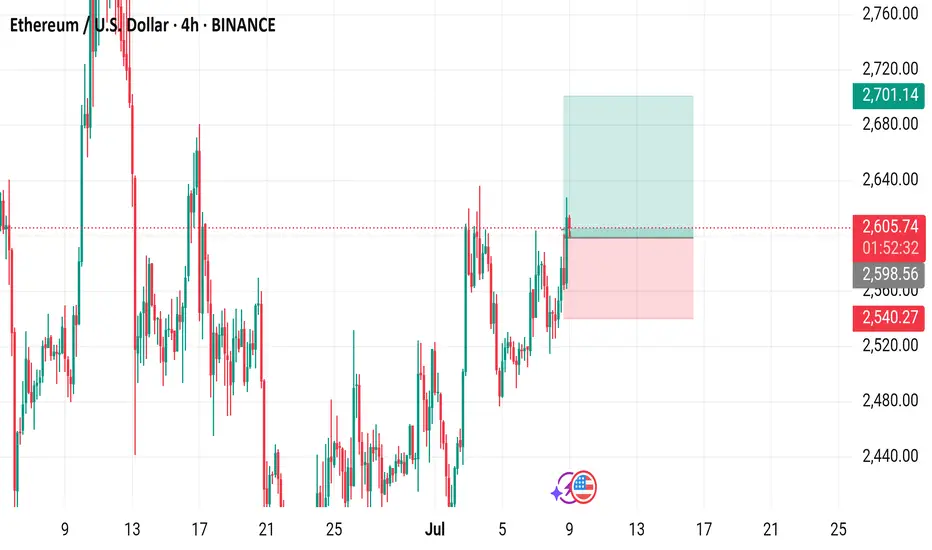
Ethereum (ETH) to U.S. Dollar (USD) 4-Hour Chart - Binance4-hour candlestick chart from Binance displays the price movement of Ethereum (ETH) against the U.S. Dollar (USD) from late June to early July 2025. The current price is $2,608.76, reflecting a +$65.53 (+2.58%) change. The chart includes buy and sell indicators at $2,608.76, with a highlighted resistance zone around $2,700-$2,760 and a support zone around $2,540-$2,600. The chart also shows a recent upward trend with fluctuating volatility.
ETHBTC Opportunity Buy: Major 2025 AltcoinSeason & Bull MarketThis is the big one and the good one. ETHBTC was bearish since December 2021 but this cycle finally came to an end in April this year. After the initial bullish breakout and higher low we can clearly see some bullish action developing; three consecutive weeks green. The bullish bias is now confirmed. It is still early.
We are looking at 200% potential. The "back to baseline" target. This is a price range where ETHBTC traded sideways as part of a distribution phase for more than two years. This is a must-to-be-tested resistance zone and thus opens up a sure 200% profits potential for this newly developing bullish wave.
Ethereum's ETFs are coming, Bitcoin already has its ETFs. This can mean Ethereum outperforming Bitcoin, and many altcoins, in so many ways. This also opens up the potential for a new all-time high on this pair.
The same sequence of 'low-higher low' happened in the last bull market. ETHBTC hit bottom in September 2019 then produced a higher low and this signaled the start of a major, long-term 447% rise. The conditions are similar now but the rise will be faster.
We have two main targets for the all-time high in late 2025 or early 2026.
1) 0.13207. With 442% profits potential from current price.
2) 0.20278. With 733% profits potential.
The entire bullish cycle for this pair can unravel within 4-6 months. If it becomes extended, it can last one year or longer. Both scenarios are possible.
It is 100% certain that ETHBTC will go on a major bullish cycle together with the rest of the altcoins market. Bitcoin will also grow.
Thanks a lot for your continued support.
If you are bullish on Crypto, comment below.
Namaste.
