"ETH Bullish Heist: MA Breakout Confirmed! Next Stop 3600?"🔷🔹 "THE ETH HEIST: MASTERPLAN TO LOOT 3600!" 🚨💰 (Breakout + Pullback Strategy)
🌟 Yo, Fellow Market Robbers! 🌟 (Hola! Bonjour! Salaam!)
Listen up, Money Makers & Thieves! 🏴☠️💸
Based on the 🔥Thief Trading Style🔥, we’re about to pull off the ultimate ETH/USDT heist—Ethereum vs Tether is our target!
🔪 THE TRADE SETUP (LONG HEIST)
🎯 Entry Signal:
"The heist begins at MA Breakout (2900)! Wait for confirmation, then strike like a pro thief!"
Option 1: Buy Stop above MA (2900) for breakout momentum.
Option 2: Buy Limit on pullbacks (15-30min TF) for sneaky low-risk entries.
📌 ALERT! Set a breakout alarm—don’t miss the robbery!
🛑 Stop Loss (Thief’s Escape Route):
"Yo! If you’re entering on breakout, DO NOT set SL before it triggers! Place it at the nearest swing low (12H TF)—or risk getting caught by the bears! 🐻🔪"
🎯 Profit Target: 3600 (OR Escape Early!)
Scalpers: Only long scalps allowed! Use trailing SL to lock profits.
Swing Thieves: Ride the wave but exit before the cops (bears) arrive!
⚡ WHY THIS HEIST WILL WORK:
Bullish momentum + MA Breakout = Easy Loot!
Overbought? Trap? Reversal? Nah—we escape before the danger zone! (Yellow ATR = High Risk)
📢 THIEF’S WARNING:
🚨 News Alerts = Market Chaos!
Avoid new trades during high-impact news.
Trailing SL = Your Best Friend.
💥 BOOST THIS HEIST!
👉 Hit 👍 LIKE & 🔔 FOLLOW to strengthen our robbery squad! More heists = More profits! 🚀💰
Stay tuned, thieves… Next heist coming soon! 🏴☠️🔥
Ethereum (Cryptocurrency)

ETHUSD: Strong Bearish Sentiment! Short!
My dear friends,
Today we will analyse ETHUSD together☺️
The market is at an inflection zone and price has now reached an area around 2,437.2 where previous reversals or breakouts have occurred.And a price reaction that we are seeing on multiple timeframes here could signal the next move down so we can enter on confirmation, and target the next key level of 2,426.5..Stop-loss is recommended beyond the inflection zone.
❤️Sending you lots of Love and Hugs❤️

Ultimate Ethereum Heist Plan : Catch the ETH/USD Bull Run!🌍 Hello, Global Money Makers! 🌟 Salaam, Ciao, Hola! 🌟
Dear Traders and Market Raiders, 🤑💸
Get ready to execute the *Thief Trading Strategy*—a slick blend of technical and fundamental analysis designed to conquer the ETH/USD crypto market! 📈💥 Follow the plan outlined in the chart for a *long entry* and aim to cash out near the high-risk *Yellow ATR Zone*. This is where the market gets wild—overbought conditions, consolidation, or even a trend reversal could trap the bears! 🐻💪 Take your profits and treat yourself—you’ve earned it! 🎉
**Entry 📈:** The heist begins! Wait for the *Moving Average breakout* at 2750 to strike. Bullish gains are calling! 💰
- Set *buy stop orders* above the MA for a clean breakout.
- Alternatively, place *buy limit orders* on a pullback within a 15 or 30-minute timeframe, targeting the most recent swing low/high.
📢 *Pro Tip:* Set an alert on your chart to catch the breakout moment! 🚨
**Stop Loss 🛑:** Listen up, crew! 🗣️ For *buy stop orders*, hold off on setting your stop loss until *after* the breakout. Place it at the nearest swing low on the 4H timeframe (around 2360) for day/swing trades.
- Adjust your stop loss based on your risk tolerance, lot size, and number of orders.
⚠️ Take control of your risk—it’s your heist, not mine! 😎🔥
**Target 🎯:** Aim for 3200 or exit early if the market signals a reversal.
**Scalpers, Eyes Here 👀:** Stick to *long-side scalping*. Got deep pockets? Jump in now! Smaller accounts? Join the swing traders and follow the plan. Use a *trailing stop loss* to lock in your loot. 💰
**Market Outlook 🐂:** The ETH/USD market is charging with bullish momentum, fueled by key fundamentals. ☝️ Check the linkks for *COT Report*, macroeconomics, sentiment, and intermarket analysis for a full picture. 👉🏻🔗
**⚠️ Trading Alert: News & Risk Management 📰**
News releases can shake up prices and volatility. Protect your positions:
- Avoid new trades during major news events.
- Use *trailing stop-loss orders* to secure profits.
💥 *Boost This Plan!* 💥 Support our *Thief Trading Crew* by hitting the Boost button. Let’s make money effortlessly every day with this strategy! 🚀🤝 Stay tuned for the next heist plan, and let’s keep raiding the markets! 🤑🐱👤🎉

Ethereum Breakdown Ahead? Classic Head & Shoulders Pattern Hello Guys!
Ethereum looks like it’s setting up for a potential drop after forming a textbook Head & Shoulders pattern on the 4H chart.
This pattern (marked clearly with a left shoulder, head, and right shoulder) is often seen before a price reversal. Right now, ETH has already broken below the neckline (around $2,480), confirming the bearish pattern, and is currently retesting that level from below.
📉 What’s Next?
If the pattern plays out, we could see ETH drop toward the projected target zone around $2,200–$2,250, which is highlighted in blue on the chart. This zone also lines up with a previous area of interest and sits near a broken trendline, adding confluence to the setup.
✅ What I see:
Resistance: ~$2,500 (neckline retest)
Target: ~$2,200 support zone
Broken trendline adds downside pressure
Unless bulls reclaim the neckline quickly and push above the right shoulder (~$2,650), this looks like a bearish continuation setup.

Ethereum monthly cup and handleSoooo, this is my first post, and I'm not really too sure if I'm seeing this correctly, can somebody please explain to me why I'm wrong or if I'm right. Cuzzzzz this seems extremely bullish to me.
This is on the monthly timeframe, so this projection is for closer to November - February, IMO...
AM I SEEING THIS CORRECTLY, or is this my bullish personality shining through.

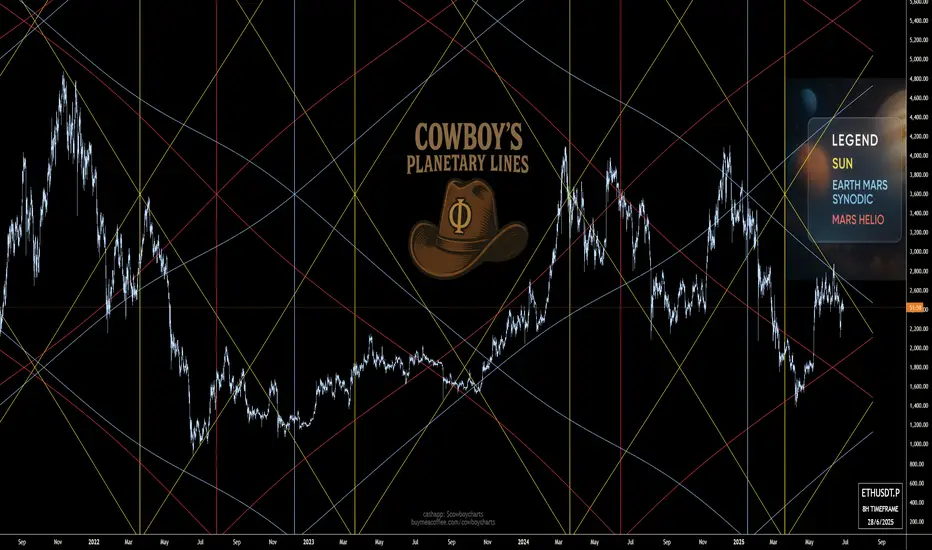
ETH - Intergalactic, Planetary, Intergalactic, PlanetarySun Lines (Gold Fences): These vertical yellow posts mark the high-noon moments when Solar power kicks off major stampedes. Note how the late-2021 Sun line lit the fuse for ETH’s first big buck, and the spring 2024 fence set the stage for that gallop up to nearly $4,800.
Earth-Mars Synodic Ropes (Blue Lassos): These sweeping blue arcs show us when Earth and Mars line up in the sky—and in price rhythm. Each blue lasso tends to corral momentum, either roping in a rally or reining in a sell-off. Early 2023’s synodic rope kept bears at bay, while the latest loop around June 2025 hints at a pick-me-up near $2,400.
Mars Heliocentric Rails (Red Corral Bars): The red lines are Mars’s own heliocentric fences—tough support and resistance levels that often drive price back toward the barn. When ETH bucked above a Mars line in mid-2022, it stalled for months; when it fell through a red rail in early 2025, it trailed off toward $1,500.
Trail Ahead: We’ve just passed another Sun post and are nearing a Mars corral bar around $2,200–2,300. If the blue synodic rope holds, expect a gentle trot back up toward $2,800; if ol’ Mars drags us off-trail, we might be bucked back toward $1,600. Keep your eyes on those planetary fences—the next cosmic roundup’s comin’ soon!
BYBIT:ETHUSDT.P
ETH.... You can do it. Get back into structure. ETH is struggling below resistance; however, an exchange of hands on lower timeframes can give the bulls a bit more wind. A break back into structure would be bullish. Don't mind me, I've been smoking that hopium.
Full TA: Link in the BIO

HolderStat┆ETHUSD trying to break through the resistanceBINANCE:ETHUSDT has confirmed a triangle breakout above the 2,312.67 level and is forming a bullish staircase structure. The chart shows a history of breakout rallies from similar formations, and this current setup targets 2,700+. Maintaining higher lows is essential for follow-through.

Inverse Head and Shoulders on Ethereum: Short Opportunity ETH?I'm currently watching Ethereum , and things are starting to look interesting.
We’re seeing early signs of a potential break in structure to the downside, and I’m closely monitoring a bearish inverse head and shoulders pattern. On the 30-minute timeframe, I’m waiting for a clear break of market structure within the current range before considering a short entry.
Stop loss would be placed above the range, with the target outlined in the video.
This is not financial advice—please trade responsibly and always manage your risk.

ETH 4H – Testing the 200W MA
ETH is trying to reclaim the 200-week MA on the 4H chart.
The last 4H candle closed right on top of it.
The first 4H bar from June 26 closed above the 0.5 Fib, but that level was eventually lost.
If the 200W MA holds as support, price may attempt to flip the 0.5 Fib into support again.
Always take profits and manage risk.
Interaction is welcome.

Ethereum H4 | Resistance at 78.6% Fibonacci retracementEthereum (ETH/USD) is rising towards a pullback resistance and could potentially reverse off this level to drop lower.
Sell entry is at 2,551.80 which is a pullback resistance that aligns closely with the 78.6% Fibonacci retracement.
Stop loss is at 2,700.00 which is a level that sits above the 127.2% Fibonacci extension and an overlap resistance.
Take profit is at 2,364.35 which is a pullback support.
High Risk Investment Warning
Trading Forex/CFDs on margin carries a high level of risk and may not be suitable for all investors. Leverage can work against you.
Stratos Markets Limited (tradu.com ):
CFDs are complex instruments and come with a high risk of losing money rapidly due to leverage. 63% of retail investor accounts lose money when trading CFDs with this provider. You should consider whether you understand how CFDs work and whether you can afford to take the high risk of losing your money.
Stratos Europe Ltd (tradu.com ):
CFDs are complex instruments and come with a high risk of losing money rapidly due to leverage. 63% of retail investor accounts lose money when trading CFDs with this provider. You should consider whether you understand how CFDs work and whether you can afford to take the high risk of losing your money.
Stratos Global LLC (tradu.com ):
Losses can exceed deposits.
Please be advised that the information presented on TradingView is provided to Tradu (‘Company’, ‘we’) by a third-party provider (‘TFA Global Pte Ltd’). Please be reminded that you are solely responsible for the trading decisions on your account. There is a very high degree of risk involved in trading. Any information and/or content is intended entirely for research, educational and informational purposes only and does not constitute investment or consultation advice or investment strategy. The information is not tailored to the investment needs of any specific person and therefore does not involve a consideration of any of the investment objectives, financial situation or needs of any viewer that may receive it. Kindly also note that past performance is not a reliable indicator of future results. Actual results may differ materially from those anticipated in forward-looking or past performance statements. We assume no liability as to the accuracy or completeness of any of the information and/or content provided herein and the Company cannot be held responsible for any omission, mistake nor for any loss or damage including without limitation to any loss of profit which may arise from reliance on any information supplied by TFA Global Pte Ltd.
The speaker(s) is neither an employee, agent nor representative of Tradu and is therefore acting independently. The opinions given are their own, constitute general market commentary, and do not constitute the opinion or advice of Tradu or any form of personal or investment advice. Tradu neither endorses nor guarantees offerings of third-party speakers, nor is Tradu responsible for the content, veracity or opinions of third-party speakers, presenters or participants.

$ETHUSDT 1H Trade Setup CRYPTOCAP:ETH – 1H Trade Setup
- Entry: CMP
- SL: $2,410
- Target: $2,506
ETH broke above the falling trendline and retested it. Clean breakout setup, bullish continuation likely above $2,445.
DYRO, NFA

#ETH Rebounds on Ceasefire News – Eyes Set on $3100 and Beyond!By analyzing the #Ethereum chart on the weekly (logarithmic) timeframe, we can see that after dropping to $2100, ETH started recovering strongly following the ceasefire announcement, and is currently trading around $2430. If Ethereum manages to close above $2700 by the end of the week, we could expect further upside.
The next potential bullish targets are $2890, $3100, and $4100.
Please support me with your likes and comments to motivate me to share more analysis with you and share your opinion about the possible trend of this chart with me !
Best Regards , Arman Shaban

Cardano Correction or Opportunity? (READ THE CAPTION)By analyzing the #Cardano chart on the 3-day timeframe, we can see that after reaching 73 cents and amid rising war tensions, the price started a correction along with the broader crypto market. This correction has now brought ADA to attractive zones for potential laddered buying and long-term investment. Cardano is currently trading around 54 cents, and if the conflict continues, it may drop further, possibly below 45 cents.
Key demand zones are at $0.36, $0.45, and $0.52.
Short-term targets are $0.61 and $0.76, while long-term bullish targets are $0.93, $1.05, and $1.33.
Please support me with your likes and comments to motivate me to share more analysis with you and share your opinion about the possible trend of this chart with me !
Best Regards , Arman Shaban

bearish reversal off pullback resistance?The Ethereum (ETH/USD) has rejected off the pivot and could drop to the 1st support that aligns with the 61.8% Fibonacci retracement.
Pivot: 2,483.49
1st Support: 2,289.88
1st Resistance: 2,587.09
Risk Warning:
Trading Forex and CFDs carries a high level of risk to your capital and you should only trade with money you can afford to lose. Trading Forex and CFDs may not be suitable for all investors, so please ensure that you fully understand the risks involved and seek independent advice if necessary.
Disclaimer:
The above opinions given constitute general market commentary, and do not constitute the opinion or advice of IC Markets or any form of personal or investment advice.
Any opinions, news, research, analyses, prices, other information, or links to third-party sites contained on this website are provided on an "as-is" basis, are intended only to be informative, is not an advice nor a recommendation, nor research, or a record of our trading prices, or an offer of, or solicitation for a transaction in any financial instrument and thus should not be treated as such. The information provided does not involve any specific investment objectives, financial situation and needs of any specific person who may receive it. Please be aware, that past performance is not a reliable indicator of future performance and/or results. Past Performance or Forward-looking scenarios based upon the reasonable beliefs of the third-party provider are not a guarantee of future performance. Actual results may differ materially from those anticipated in forward-looking or past performance statements. IC Markets makes no representation or warranty and assumes no liability as to the accuracy or completeness of the information provided, nor any loss arising from any investment based on a recommendation, forecast or any information supplied by any third-party.

ETHBTC: Ethereum to outperform massively Bitcoin.ETHBTC turned neutral again on its 1D technical outlook (RSI = 41.566, MACD = -0.00033, ADX = 21.423) as in the past 4 weeks it failed to extend the rebound of the April 14th bottom. Ahead of a MACD Bullish Cross, a little further correction to make a Double Bottom (DB) would make the pattern more bullish, much like the December 9th 2019 DB. That was the start of Ethereum's bull season. Similarly, we expect it to start outperforming Bitcoin massively and approach the R1 level (TP = 0.0800).
## If you like our free content follow our profile to get more daily ideas. ##
## Comments and likes are greatly appreciated. ##

Ethereum ETH price analysis💰 The price of CRYPTOCAP:ETH tested the strength of the bottom support and failed to consolidate above it.
This means that there will be another correction wave
🔥 Considering that #ETHETF is steadily "bying" every day, it would be a good idea for us/you to buy OKX:ETHUSDT in the range of $1850-1975 for investment portfolio before further growth.
👌 And you can also place a “bucket” with a pending order to buy #Ethereum at $1700, and maybe they will even "draw fall" the price at the moment to break all stops.
_____________________
Did you like our analysis? Leave a comment, like, and follow to get more

HolderStat┆ETHUSD formed the rising bottomBINANCE:ETHUSDT on the 16h chart is pressing upward inside a steep channel after reclaiming $2,300. Momentum is driving the price toward $2,800 and possibly $3,400. Previous breakouts from consolidation zones support the bullish bias.

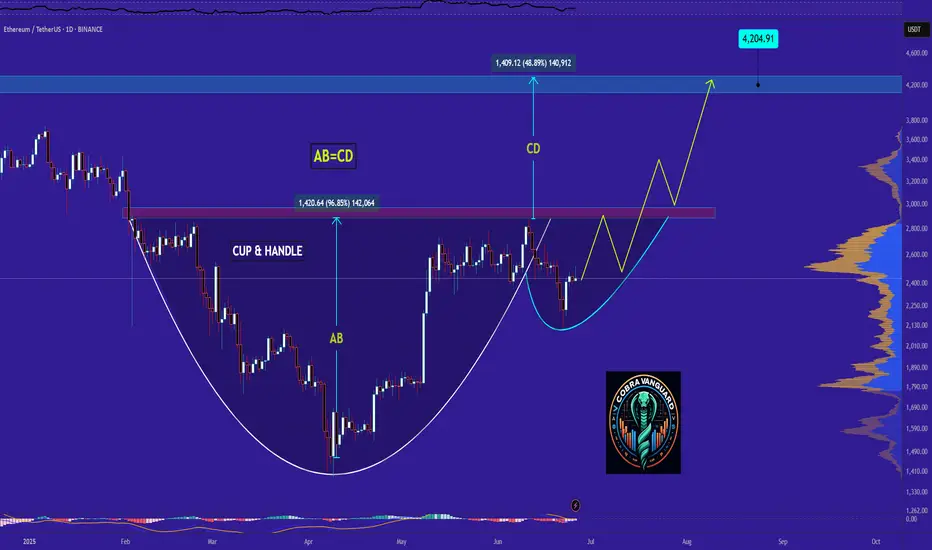
ETH It will grow soon...It can be said that the price has formed a cup and handle pattern, which it is completing soon. If the price follows this pattern, it can be expected that Ethereum will reach its peak again.
Best regards CobraVanguard.💚
15 R:R setup for EthereumWe assume that this marks the beginning of a new uptrend for BTC. This setup offers an easy 15:1 risk-to-reward ratio.
Entry: 2534
Stop Loss: 2373.33
Target: 5000
This is for educational purposes only.

Ethereum big chance for BIG drop#ETH Price is at key resitance. POC of the entire range.
In a case of big sell volume price can continue dropping toward $2000 area
I wait for confirmation to take a trade

ETH on resistance.Ethereum 2 possible probabilities. 1 shows back demand level around 2100$ the other is a break of 2500$ and retest.

Ethereum is still bullish!#ETH
The price is moving within a descending channel on the 30-minute frame and is expected to break and continue upward.
We have a trend to stabilize above the 100 moving average once again.
We have a downtrend on the RSI indicator that supports the upward move with a breakout.
We have a support area at the lower boundary of the channel at 2450, acting as strong support from which the price can rebound.
We have a major support area in green that pushed the price upward at 2400.
Entry price: 2460.
First target: 2485.
Second target: 2510.
Third target: 2543.
To manage risk, don't forget stop loss and capital management.
When you reach the first target, save some profits and then change your stop order to an entry order.
For inquiries, please comment.
Thank you.
