ETHEREUM Risky Long! Buy!
Hello,Traders!
ETHEREUM is consolidating
Above the horizontal support
Area around 2360$ and we
Are already seeing a local
Rebound from the level
So as we are bullish biased
A further price growth
Is to be expected
Buy!
Comment and subscribe to help us grow!
Check out other forecasts below too!
Disclosure: I am part of Trade Nation's Influencer program and receive a monthly fee for using their TradingView charts in my analysis.
Ethereum (Cryptocurrency)

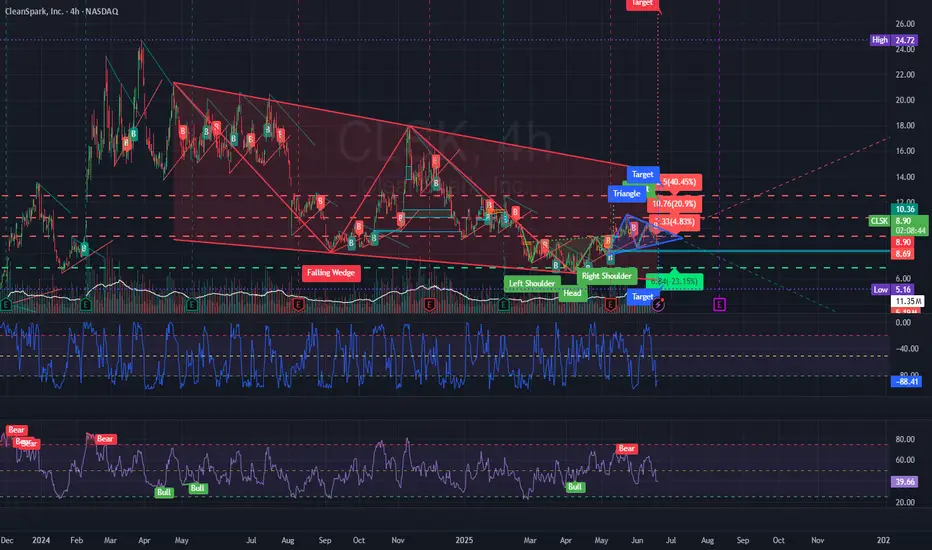
Ethereum, Bullish Breakout Expected Any Moment Now!Look at this, the first peak for Ethereum happened 13-May after the start of the recovery and the end of the downtrend. The lowest point happened five days later on 18-May and there has been no new lows since. Ethereum has been in a bullish consolidation pattern, a classic bullish flag.
This kind of dynamic clearly reveals a bullish bias and certainly, Ethereum is already trading pretty low compared to its last high.
A new and most interesting signal comes from the stock COIN, for Coinbase. This stock went ahead and produced a very strong bullish breakout yesterday with a green candle reaching +16%. COIN's chart and ETH are almost identical, exactly the same. Since these two move together, we can expect Ethereum to follow suit and do the same. We can expect a bullish breakout to happen any day now. Consolidation has been going long enough. It is time for the market to grow.
Some of the smaller altcoins continue to move forward, this is a signal that should not be ignored.
Namaste.

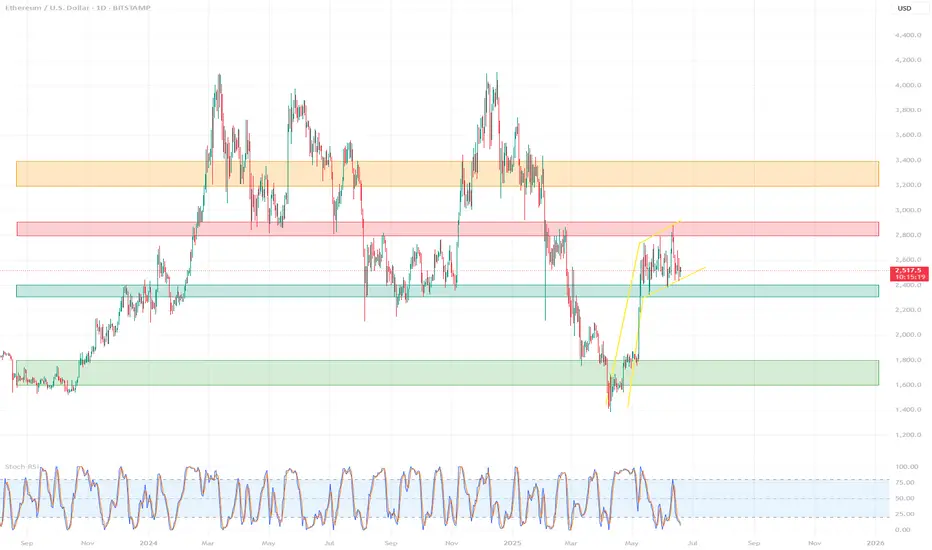
Detailed technical analysis of the ETH/USD chart🧭 General Context (1D, Long-Term):
The chart covers the period from approximately September 2023 to June 2025.
ETH/USD has gone through a complete cycle: growth → decline → correction → potential consolidation/accumulation.
🔹 Market Structure (Price Action)
🔸 Trends:
November 2023 – March 2024: strong uptrend, ETH reaches highs around $4,000+
March 2024 – February 2025: clear downtrend ending with a local low around $1,600
February 2025 – May 2025: dynamic rebound – probable trend change (new higher low + higher high)
May – June 2025: currently consolidating between ~$2,400–2,800
📉 Key Support and Resistance Levels
Type Level Notes
🔴 Resistance ~2,800 – 2,900 Local high, many candles with shadows rejected from above
🟡 Resistance ~3,200 – 3,400 Beginning of strong declines from 2024
🟢 Support ~2,300 – 2,400 Local lows in June 2025
🟢 Strong support ~1,600 – 1,800 Final market low of March 2025 (possible accumulation phase)
📊 Technical indicators
✅ Stochastic RSI (at the bottom of the chart):
Currently in the oversold zone (~0–20) → may signal a potential bottom / buying opportunity
Red-blue lines are starting to wrap upwards → possible rebound
Recent crossovers of the indicator corresponded to local price movements
🔍 Technical formations
⚠️ Possible formations:
Double Bottom: February–March 2025 → classic trend reversal formation
Rising Channel: from March 2025 to present – prices are moving in a slightly rising channel
Current consolidation may be a bull flag (continuation after the increase)
📌 Summary – scenarios
🟢 Bullish scenario:
Breakout of resistance ~2,800 → possible test of levels 3,200 – 3,400 USD
Confirmation of a higher low → continuation of the uptrend
Stochastic RSI in the oversold zone → potential for an uptrend
🔴 Bearish scenario:
Drop below 2,300 USD → possible return to the area of 1,800–1,600 USD
Breakout of the structure of higher lows
Confirmation that the increase was only a correction
🧠 Final conclusions
Currently, ETH/USD is in a key decision zone: after a strong rebound, the market is resting.
Stochastic RSI suggests a potential upside impulse, but requires confirmation by a breakout of resistance.
For traders: 2,800 (resistance) and 2,300 (support) are worth watching.
For investors: 1,600–1,800 could be considered a long-term accumulation zone.
Potential Long Setup for EthereumEther stabilized in a slightly positive trend after breaking the previous uptrend. Since mid-May, this flattish trend channel has continued, offering some trading opportunities within it.
When Ethereum approaches the lower line and the 50 EMA crosses above the 50 SMA, an ETHUSDT surge has followed each time since the channel formed. Traders could expect a similar move again. However, the key risk is potential negative pressure on stock markets due to geopolitical concerns and the correlation effect on the crypto market and a break of the channel.

HolderStat┆ETHUSD accumulationBYBIT:ETHUSDT is compressing in an ascending triangle, pivoting around 2 500. A decisive break above 2 520 tees up 2 800–2 900 continuation, while closing back under 2 430 would negate the immediate setup but leave macro structure bullish.

ETHEREUM Battling to hold its 1D MA50.Ethereum (ETHUSD) has been trading within a 5-week Channel Up pattern and in the past 2 days almost tested its 1D MA50 (blue trend-line). So far this is holding, showcasing the strong presence of buyers in that price region, which also happens to be the bottom of that Channel Up.
Ahead of a 1D Golden Cross that may potentially be formed in a week or so, this is the strongest buy signal we get since the April 09 bottom. Given also that the price is trading close to the 0.5 Fibonacci retracement level from the December 16 2024 High, the upside potential is significant. The obvious medium-term Target is that High at 4100.
-------------------------------------------------------------------------------
** Please LIKE 👍, FOLLOW ✅, SHARE 🙌 and COMMENT ✍ if you enjoy this idea! Also share your ideas and charts in the comments section below! This is best way to keep it relevant, support us, keep the content here free and allow the idea to reach as many people as possible. **
-------------------------------------------------------------------------------
💸💸💸💸💸💸
👇 👇 👇 👇 👇 👇

ETHEREUM LOCAL LONG|
✅ETHEREUM is going down now
But a strong support level is ahead at 2,375$
Thus I am expecting a rebound
And a move up towards the target of 2,600$
LONG🚀
✅Like and subscribe to never miss a new idea!✅
Disclosure: I am part of Trade Nation's Influencer program and receive a monthly fee for using their TradingView charts in my analysis.

ETH – Rounded Distribution Before the Punch Higher?What we’re seeing here is a potential fakeout setup within a value zone.
Notice the rounded top formation — looks bearish — but price refuses to break the low. This often sets the stage for a sharp reversal.
Structure Breakdown:
Volume profile shows acceptance in current range
Rounded top shape implies weakness — but no breakdown = trap potential
Price holds a higher low inside the range = absorption
Green box marks ideal long entry area — well-defined invalidation below
Bullish case:
We’re watching for that reclaim of the mid-level → quick push into the upper range
Target zone = 2,618 (clean inefficiency fill + local top)
Bearish trap scenario invalidated if price closes below red box (stop hunt level)
Strategy bias:
This is a compression-reversal trap — fake weakness to trap shorts, then launch.
Patience pays here — if it reclaims and consolidates at the mid, it’s time to ride.
📊 More setups like this, early in structure, are shared inside the account description. Tap in for the breakdowns.

ETH | BULLISH Pattern | $3K NEXT ??Ethereum has established a clear bullish pattern in the daily as we're seeing an inverse H&S:
The war issues across the globe must also be considered. So far, it's been bullish for crypto but this can also change overnight since it's a very volatile situation - and crypto being a very volatile asset.
For the near term, I believe ETH is due for another increase - at least beyond the current shoulder. This is IF we hold the current support zone:
It seems to be a bit of a slow burn with ETH for this season's ATH. In the ideal world, we'd either:
📢 consolidate under resistance (bullish)
📢make a flag (bullish)
📢OR smash right through the resistance.
But there's likely going to be heavy selling pressure around that zone.
__________________________
BINANCE:ETHUSDT

ETH at critical levelsCRYPTOCAP:ETH is at the bottom of the structure, great risk-to-reward ratio. However, the bearish thesis needs to consider a dip to 2kish level. To make the DCA strategy work best, buying on dips is vital.
Full TA: Link in the bio

CLSK Going to $27There is always a downside, but I believe Risk vs Reward is here. It's not if, it's when. If we breakout to the downside of the triangle then we will test the support and the bottom of the wedge. If we break to the top of the triangle then we go for the breakout of the wedge and on the way to $27. I am adding at these levels and of course if it goes down, I am adding more.
ETHUSD Is Very Bullish! Buy!
Take a look at our analysis for ETHUSD.
Time Frame: 10h
Current Trend: Bullish
Sentiment: Oversold (based on 7-period RSI)
Forecast: Bullish
The market is on a crucial zone of demand 2,508.60.
The oversold market condition in a combination with key structure gives us a relatively strong bullish signal with goal 2,717.66 level.
P.S
Please, note that an oversold/overbought condition can last for a long time, and therefore being oversold/overbought doesn't mean a price rally will come soon, or at all.
Disclosure: I am part of Trade Nation's Influencer program and receive a monthly fee for using their TradingView charts in my analysis.
Like and subscribe and comment my ideas if you enjoy them!

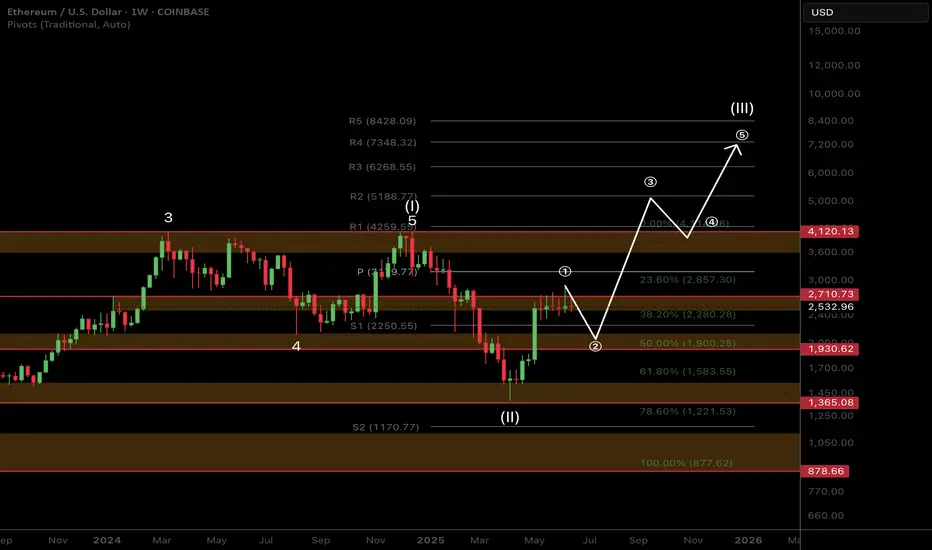
ETH Macro Analysis☕ 𝙂𝙈. CRYPTOCAP:ETH Macro analysis update...
📈 𝙇𝙤𝙣𝙜 𝙩𝙚𝙧𝙢 outlook remains unchanged and recent price action printing a doji. Target is still $7k for this cycle.
📉 𝙎𝙝𝙤𝙧𝙩 𝙩𝙚𝙧𝙢 outlook has investors looking lower towards the $1900 target but this isn't guaranteed to be reached and price action may front tat $2200.
War escalation's and retail selling are keeping price suppressed. ETF inflows and staking continue to grow!
The time for patience continues. Money is made in the sitting, weathering volatility, not flipping in and out of trades on every bit of news and price movement
𝙏𝙚𝙘𝙝𝙣𝙞𝙘𝙖𝙡 𝘼𝙣𝙖𝙡𝙮𝙨𝙞𝙨
Price is consolidating at its recent highs. Consolidation under resistance has high probability of breaking out, the longer it remains the higher the probability.
Elliot Wave (EW) analysis suggests a motif wave ended at the $2700 resistance, with a wave 2 retracement underway, likely a shallow one.
Safe trading
$banana PARALLEL CHANNEL ON BANANA GUN$banana parallel channel on banana gun.
Have we bottomed?
Do we now go to the top of the parallel channel?
I think we go there in june.
Q3 aka july, aug, sep going to be consolidation
Q4 we begin the bull run.

Ethereum H1 | Potential bearish reversalEthereum (ETH/USD) is rising towards a pullback resistance and could potentially reverse off this level to drop lower.
Sell entry is at 2,543.15 which is a pullback resistance that aligns with the 38.2% Fibonacci retracement.
Stop loss is at 2,625.00 which is a level that sits above the 61.8% Fibonacci retracement and a swing-high resistance.
Take profit is at 2,451.35 which is a multi-swing-low support.
High Risk Investment Warning
Trading Forex/CFDs on margin carries a high level of risk and may not be suitable for all investors. Leverage can work against you.
Stratos Markets Limited (tradu.com ):
CFDs are complex instruments and come with a high risk of losing money rapidly due to leverage. 63% of retail investor accounts lose money when trading CFDs with this provider. You should consider whether you understand how CFDs work and whether you can afford to take the high risk of losing your money.
Stratos Europe Ltd (tradu.com ):
CFDs are complex instruments and come with a high risk of losing money rapidly due to leverage. 63% of retail investor accounts lose money when trading CFDs with this provider. You should consider whether you understand how CFDs work and whether you can afford to take the high risk of losing your money.
Stratos Global LLC (tradu.com ):
Losses can exceed deposits.
Please be advised that the information presented on TradingView is provided to Tradu (‘Company’, ‘we’) by a third-party provider (‘TFA Global Pte Ltd’). Please be reminded that you are solely responsible for the trading decisions on your account. There is a very high degree of risk involved in trading. Any information and/or content is intended entirely for research, educational and informational purposes only and does not constitute investment or consultation advice or investment strategy. The information is not tailored to the investment needs of any specific person and therefore does not involve a consideration of any of the investment objectives, financial situation or needs of any viewer that may receive it. Kindly also note that past performance is not a reliable indicator of future results. Actual results may differ materially from those anticipated in forward-looking or past performance statements. We assume no liability as to the accuracy or completeness of any of the information and/or content provided herein and the Company cannot be held responsible for any omission, mistake nor for any loss or damage including without limitation to any loss of profit which may arise from reliance on any information supplied by TFA Global Pte Ltd.
The speaker(s) is neither an employee, agent nor representative of Tradu and is therefore acting independently. The opinions given are their own, constitute general market commentary, and do not constitute the opinion or advice of Tradu or any form of personal or investment advice. Tradu neither endorses nor guarantees offerings of third-party speakers, nor is Tradu responsible for the content, veracity or opinions of third-party speakers, presenters or participants.

Breakout point: 2706.15
Hello, traders.
If you "follow", you can always get the latest information quickly.
Have a nice day today.
-------------------------------------
(ETHUSDT 1D chart)
The key is whether the price can rise above the important support and resistance area of 2419.83-2706.15 and maintain it.
Therefore, when the 2706.15 point is broken upward, it can be said that a breakout trade is possible.
The conditions for a breakout trade are:
- OBV must rise above the High Line and be maintained,
- OBV oscillator must show an upward trend,
- StochRSI indicator must show an upward trend.
However, it is better if StochRSI indicator has not entered the overbought zone.
When the rise begins, the resistance zone is expected to be around 3265.0-3321.30.
-
Although funds are continuously flowing into the coin market, it may feel like the trading volume has decreased.
The reason for this is thought to be that BTC dominance is generally showing an upward trend.
The meaning of BTC dominance rising means that funds in the coin market are concentrated toward BTC.
Therefore, I think that the overall trading volume has decreased because more funds are needed for the price to rise.
When the altcoin bull market begins, more transactions will occur, which will make you think that liquidity has increased in the coin market.
Therefore, for the altcoin bull market to begin, the BTC dominance must fall below 55.01 and remain there or continue to fall.
If the USDT dominance remains below 4.97 or continues to fall, the coin market is likely to rise.
At this time, depending on the BTC dominance mentioned earlier, you can distinguish whether the rise is focused on BTC or whether the altcoin is also rising.
If the BTC dominance continues to rise, most altcoins are likely to gradually move sideways or fall.
Therefore, if you are trading altcoins in this situation, I think it would be useful to increase the number of coins (tokens) corresponding to profit while responding quickly and briefly.
In other words, it means selling the purchase amount (+including transaction fees) when the price rises by purchase price, leaving the number of coins (tokens) corresponding to profit.
The coins (tokens) increased in this way are coins (tokens) with an average purchase price of 0, which will reduce the psychological burden when the altcoin bull market begins, allowing you to obtain a good average purchase price.
-
Thank you for reading to the end.
I hope you have a successful transaction.
--------------------------------------------------
- This is an explanation of the big picture.
(3-year bull market, 1-year bear market pattern)
I will explain more details when the bear market starts.
------------------------------------------------------

Ethereum Holds the Line – Is $2,300 the Key to the Next Rally?By examining the #Ethereum chart on the weekly (logarithmic) timeframe, we can see that after rising to $2,880, the price faced selling pressure and corrected down to $2,500. This upward move created a large Fair Value Gap (FVG) between $1,870 and $2,300, which is likely to be filled in the medium term if the price drops further.
However, as long as Ethereum continues trading above the $2,300 level and does not close below it, we can still expect further bullish movement.

HolderStat┆ETHUSD continues to accumulateOKX:ETHUSDT is catching bids at the 2.50 k rail after triangle retest, converting shakeout into upside continuation. Staying above 2.40 k keeps bias north; clearing 2.75 k releases the 3 k target rocket 🚀

BTC Dips After ATH – $100K Support in Focus Amid TensionsBy analyzing the #Bitcoin chart on the weekly timeframe, we can see that after rallying to $111,980 and printing a new all-time high, price faced a correction down to $100,000.
Currently, Bitcoin is trading around $105,700, and with geopolitical tensions escalating, particularly the risk of war, we could see further downside — potentially taking price as low as $90,000.
However, if BTC manages to hold above the $100,000 level, there’s a strong chance we’ll see a short-term rally toward $120,000.
This analysis will be updated as the situation evolves. Stay tuned!
Please support me with your likes and comments to motivate me to share more analysis with you and share your opinion about the possible trend of this chart with me !
Best Regards , Arman Shaban

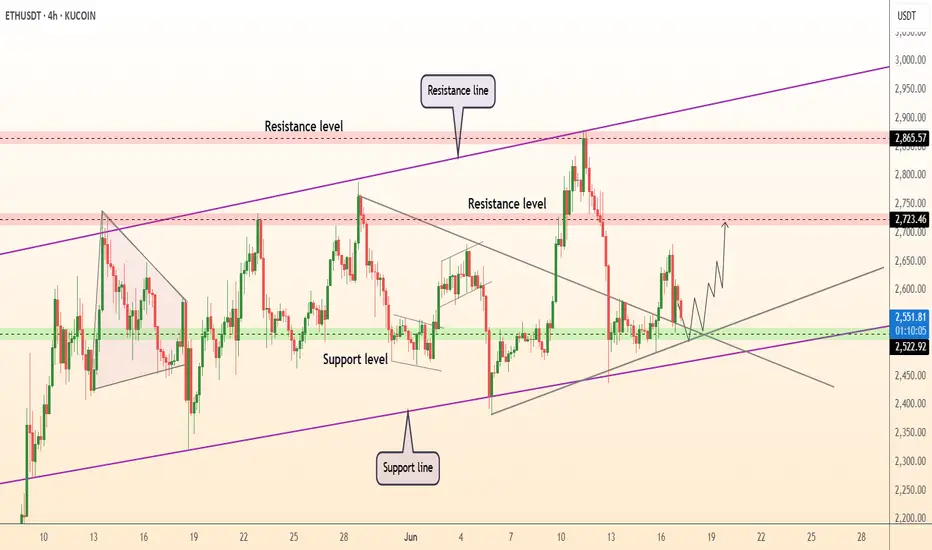
DeGRAM | ETHUSD held the trend line📊 Technical Analysis
● Price just printed a long-tailed rebound on the 4-month purple up-trend and the 2 520-2 560 demand strip, also reclaiming a broken pennant base—confirming a fake breakdown and locking the zone as fresh support.
● A higher-low sequence is compressing against the descending 2 650 trend cap; a 4 h close above it activates the 2 723 horizontal target and projects the channel-median swing toward 2 865.
💡 Fundamental Analysis
● Net staking deposits keep outpacing withdrawals while CME ether futures open-interest hit a six-week high, signalling renewed institutional hedging ahead of the spot-ETF ruling and supporting upside bias.
✨ Summary
Buy 2 540-2 580; clearance of 2 650 aims 2 723, stretch 2 865. Invalidate below 2 450.
-------------------
Share your opinion in the comments and support the idea with like. Thanks for your support!
Safello Group AB - Bullish Outlook - Small Cap Crypto Firm Safello is starting to show signs of a breakout from its weekly triangle. If Bitcoin or altcoins start to show life, I believe this stock could outperform most crypto stocks. The company is constantly innovating its offerings and is regulated under Swedish law.
I have been DCA’ing into this stock for quite a while now and will continue to do so until the consolidation is over.
Current market cap is about 10 Million USD.
Nothing here should be considered financial advice. Always do your own research and make your own decisions.
OMXSTO:SFL
CRYPTOCAP:OTHERS
CRYPTOCAP:TOTAL
COINBASE:BTCUSD
NASDAQ:COIN
COINBASE:ETHUSD

Bitcoin Or Gold? Real Safe Haven In Middle East tension When the world shakes, where does money go— Bitcoin or gold ?
You may think crypto is the ultimate safe haven… but data tells a different story.
This breakdown compares digital dreams vs. physical trust —with charts, tools, and the psychology behind every move.
Hello✌
Spend 3 minutes ⏰ reading this educational material.
🎯 Analytical Insight on Bitcoin:
Contrary to common expectations, Bitcoin has shown relative resilience amid recent geopolitical tensions, refraining from a sharp sell-off.
This price behavior signals a potential shift in market psychology—something I’ll explore further in an upcoming educational post.
Based on my previous analyses, I continue to anticipate an upward breakout above the $110K resistance zone in the current structure.
Now , let's dive into the educational section,
📌 Gold: The Legacy of Trust
For thousands of years, gold has been the go-to safe asset. In wars, inflation, sanctions, and crashes—it remains the mental anchor of value. Tangible, historic, and out of government control.
🪙 Bitcoin: Revolutionary but Unstable
Bitcoin promises freedom, decentralization, and anti-inflation. But during actual crises, trust wavers. High volatility, regulatory risk, and lack of a long history make investors hesitate when fear hits hard.
🛠️ TradingView Tools That Reveal Where Smart Money Flows
One reason TradingView stands out is its wide set of tools that help you track market psychology—not just price action. When it comes to analyzing the Bitcoin-vs-Gold battle during global crises (like the Iran-Israel war), these tools are essential:
Correlation Coefficient: This shows how closely BTC and gold move together. In panic moments, it helps reveal where the real trust is flowing.
On-Balance Volume (OBV): Key for spotting where big money is headed. If OBV on gold rises while BTC’s falls, smart money isn’t betting on crypto just yet.
Fear & Greed Index Logic (DIY): While not a native TradingView tool, you can mimic it by combining volatility and volume indicators to reflect market emotion.
Overlay XAUUSD and BTCUSD: Place both on a single chart with “percentage scale” enabled. You’ll see exactly which one holds up better during chaos.
Marking Geo-Political Events: Tag key events (like missile strikes or sanctions) on your charts. Track how Bitcoin and gold react immediately after.
📊 How Investors React in Crisis
During events like an Iran-Israel war, data shows money often flows into gold—not BTC. When panic peaks, people run toward the “known,” not the “new.”
🧠 The Illusion of Crypto as Safe Haven
We want to believe BTC is the new gold. But the human mind—under threat—defaults to ancient instincts. Fear doesn’t innovate. It runs to what it knows: shiny, physical, historical gold.
💡 When Will Bitcoin Truly Compete?
When the next generation fully embraces digital assets. When institutions store BTC alongside gold. When BTC no longer crashes on scary headlines—that’s when the shift becomes real.
⚠️ Lessons from War
Wars reveal that markets don’t behave rationally in fear. Even if Bitcoin makes sense on paper, emotion drives flows. Right now, that flow still favors gold.
🔍 What to Watch Next
If, during a future conflict, Bitcoin drops less—or even rises while gold does—you may be witnessing a turning point. Until then, keep tracking both with your TradingView setups.
🧭 Final Takeaway
Gold still owns the trust game in a crisis. Bitcoin is on its way but hasn’t crossed that psychological line. If you’re a smart trader, know how to read both—and move before the herd does.
✨ Need a little love!
We put so much love and time into bringing you useful content & your support truly keeps us going. don’t be shy—drop a comment below. We’d love to hear from you! 💛
Big thanks,
Mad Whale 🐋
📜Please remember to do your own research before making any investment decisions. Also, don’t forget to check the disclaimer at the bottom of each post for more details.

ETH didn’t rally — it cleared inefficiency and pausedThis isn’t the move. This is the setup for the move.
ETH tagged 2658.22 — premium — and stalled right where Smart Money pauses before redistributing or rotating.
Here’s how this lines up:
Price swept into the 0 fib (2658.22), then hesitated — that’s not weakness, that’s precision
Just below sits a clean FVG at 2594–2575, right between the 0.382–0.5 fibs
Below that: OB near 2527–2492 — last line of defense before momentum flips
Right now, ETH is offering a reactive pullback opportunity. If bulls hold 2594–2575 with a bounce, we rotate higher again. But if they don’t — 2527 becomes the decision zone.
Execution lens:
Ideal re-entry zone: 2594–2575
Invalidation: sustained close below 2555 = expect OB tap
If FVG holds, expect revisit of 2658 → extension toward 2680s
This setup isn’t done. It’s developing. Wait for price to speak — not hope.
For more plays built like this — mapped in advance, not after the fact — check the profile description
