BTCETH parabolic run pointing towards 100:1Historically, during bull markets, Ethereum frequently surpassed Bitcoin at various moments.
However, this time around, that trend has not materialised, leading to a decline in investor confidence.
With capital exiting the ETH market, sentiment has soured, and critical indicators are revealing significant losses.
Unless a robust bullish turnaround occurs, Ethereum's struggle may persist, as the market currently favors Bitcoin as the more secure option.
However once this parabola breaks, we could see a strong snap back reaction in favour of the more riskier #ALTS, #DEFI and #MEMES as #ETH is still the home for stablecoin issuance and still the most trusted secure smart contract blockchain available.
Ethereum (Cryptocurrency)

BTC/USD: More Bullish MOVE Ahead? (READ THE CAPTION)By analyzing the #Bitcoin chart on the weekly timeframe, we can see that the price has finally reached our expected level of $111,880, setting a new all-time high.
Currently, Bitcoin is trading around $110,800, and if it manages to hold above this key level, we could expect further bullish movement.
The next potential targets are $130,000 and $163,000, respectively.
Please support me with your likes and comments to motivate me to share more analysis with you and share your opinion about the possible trend of this chart with me !
Best Regards , Arman Shaban

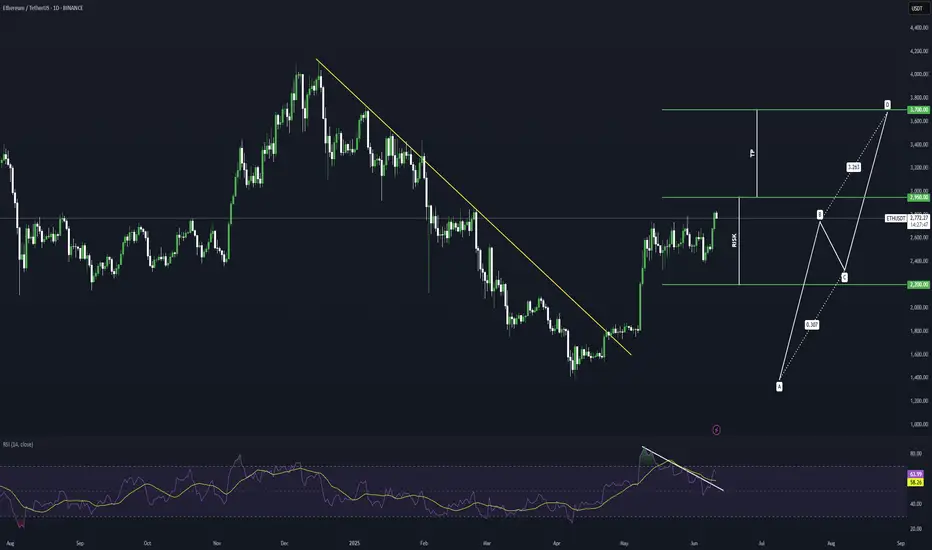
Where is Ethereum's target? (1D)This analysis is an update of the analysis you see in the "Related publications" section
The previous analysis has expired, and the price moved up without any correction. This type of movement is usually intended to attract liquidity, and once liquidity is absorbed, the price often goes through a correction.
From the point where we placed the green arrow, Ethereum has entered a bullish phase.
It now appears that we are in wave B of this bullish phase. The price may get rejected from the red zone.
Price can be rejected from the red box.
Do not enter any positions without confirmation, as the price may even continue moving up to the top of the red box.
For risk management, please don't forget stop loss and capital management
When we reach the first target, save some profit and then change the stop to entry
Comment if you have any questions
Thank You

ETHUSDT.P H1 : Short-Term CorrectionBy analyzing the 1-hour timeframe, we can see that the price may drop from the 2780–2820 zone down to 2600

The Charts Never Lie [Well, almost never]So many reasons to be Bullish on Alts right now.
Historically, BTC will peak first, and then ALTS will have their turn. It looks like they are prime for a run at least to the middle of the range, although why stop there?

Ethereum Looks Identical to Early-Day AmazonToday I look at Ethereum versus early-day Amazon and the similarities between the internet bubble and the 2021 crypto bubble. Everyone talks about how the internet bubble popped, but few people talk about what came afterward. There was a strong recovery in the markets, and the internet was mass adopted by the public—along with the technology of home computers.
I believe we are heading into a mass adoption phase for crypto. We've had a bubble-and-pop scenario, and now that major institutions are investing in crypto, we are set up for mass adoption—very similar to what happened with home computing and the internet as a technology. I see Ethereum as being the "Amazon" of this new wave, and Bitcoin as being the "Apple." Big things are coming in these markets.
As always, stay profitable.
– Dalin Anderson

ETHBTC Daily Looks Constructive
ETHBTC on the daily is about to close above the previous top (pink line).
The next major resistance is the 200MA, which is not far above.
Both the SMA and MLR are above the BB center—a constructive sign.
Watching ETH/BTC closely can help shape expectations for ETH/USDT.
Always take profits and manage risk.
Interaction is welcome.

ETH Bullish Setup: Pullback to 200_SMA(D) May Launch Next Rally Ethereum ( BINANCE:ETHUSDT ) seems to have finally managed to break the Resistance lines and the 200_SMA(Daily) in the fifth attack . However, the number of Resistance lines inside the Heavy Resistance zone($2,929_$2,652) is high, and Ethereum will find it difficult to break through them.
In terms of Elliott Wave theory , it seems that Ethereum is completing microwave 4 , and we should wait for this wave to complete. Microwave 4 could act as a pullback to the resistance lines and 200_SMA(Daily) .
I expect Ethereum to start rising from the Support zone($2,745_$2,650) again and rise to at least the Potential Reversal Zone(PRZ) .
Note: If Ethereum touches $2,537 , we can expect further declines.
Please respect each other's ideas and express them politely if you agree or disagree.
Ethereum Analyze (ETHUSDT), 1-hour time frame.
Be sure to follow the updated ideas.
Do not forget to put a Stop loss for your positions (For every position you want to open).
Please follow your strategy and updates; this is just my Idea, and I will gladly see your ideas in this post.
Please do not forget the ✅' like '✅ button 🙏😊 & Share it with your friends; thanks, and Trade safe.

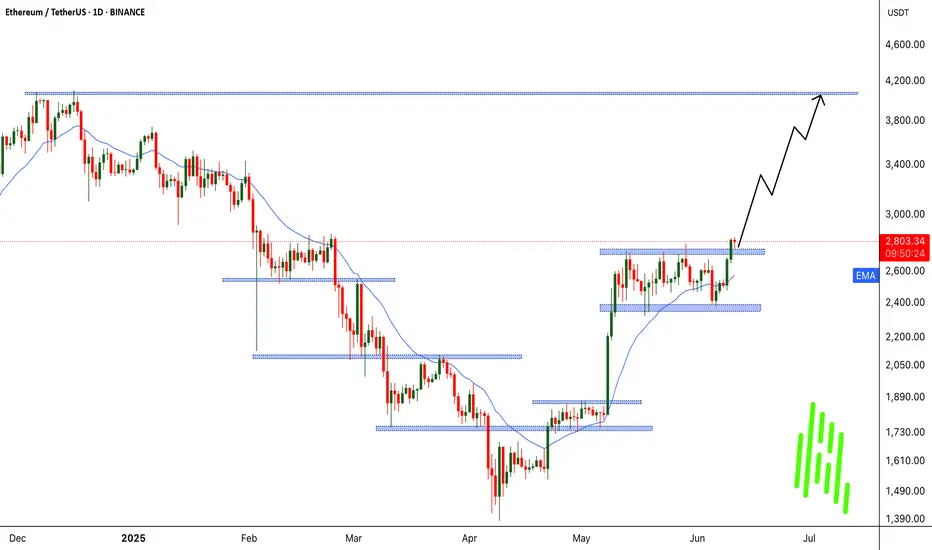
Bad Time Over for ETH? Second Wave Toward $4,000 Incoming!!🟢 Bad Time Over for ETH? Second Wave Toward $4,000 Incoming
MARKETSCOM:ETHEREUM ( CRYPTOCAP:ETH ) appears to be leaving its consolidation phase behind, and all signs point to a fresh bullish wave. After outperforming Bitcoin in recent days, CRYPTOCAP:ETH has now broken out of a key structure — signaling the potential start of a major uptrend.
We’re also witnessing rising CRYPTOCAP:ETH inflows, suggesting growing investor confidence. This kind of accumulation behavior has historically led to significant rallies. Previously, ETH consolidated between $1700–$1800 before a strong move up. More recently, it ranged between $2400–$2700, and now that it’s broken out, we’re anticipating another powerful leg — possibly the second wave of this trend.
If the current momentum continues, a move toward $4000 looks likely, and with enough strength, even a new all-time high isn’t off the table.
BINANCE:ETHUSDT Currently trading at $2795
Buy level : Above $2750
Stop loss : Below $2305
Target : $4000
Max leverage 3x
Always keep stop loss
Follow Our Tradingview Account for More Technical Analysis Updates, | Like, Share and Comment Your thoughts
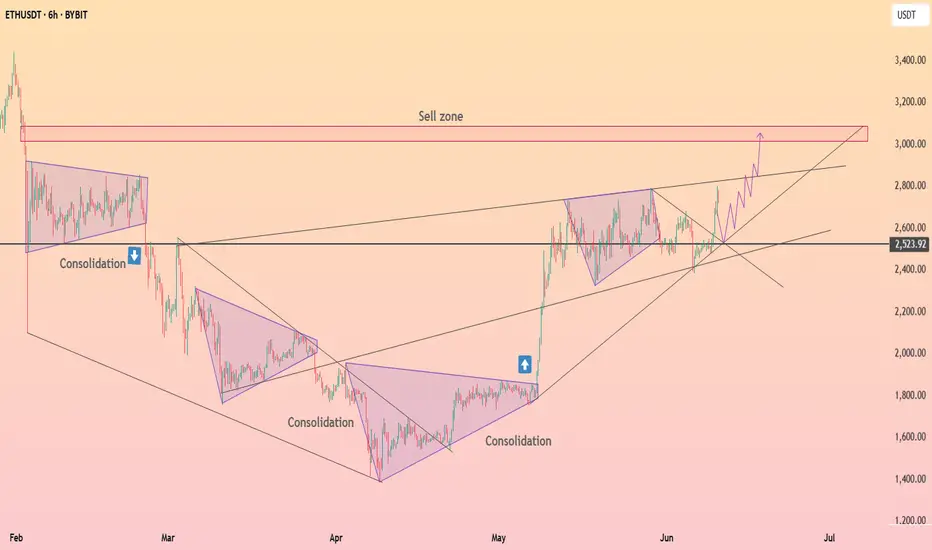
Ethereum bulls are enjoying the momentAfter violating the upper side of the range, MARKETSCOM:ETHEREUM is now aiming for the 3000 zone. Will the buyers have enough steam to drag it there? Let's have a look.
CRYPTO:ETHUSD
Let us know what you think in the comments below.
Thank you.
77.3% of retail investor accounts lose money when trading CFDs with this provider. You should consider whether you understand how CFDs work and whether you can afford to take the high risk of losing your money. Past performance is not necessarily indicative of future results. The value of investments may fall as well as rise and the investor may not get back the amount initially invested. This content is not intended for nor applicable to residents of the UK. Cryptocurrency CFDs and spread bets are restricted in the UK for all retail clients.

HolderStat┆ETHUSD move in accumulation zoneHolding CRYPTOCAP:ETH in the range of 2,520 - 2,750 formed an accumulation zone. Breakout of this range gives an opportunity for growth of 3,000+
GT Protocol ($GTAI) | Breakout Loading? +500% Potential! (READ)By analyzing the #GTProtocol chart on the daily (logarithmic) timeframe, we can see that the price was forming a solid base between $0.12 and $0.15. Currently trading around $0.17, the chart structure remains bullish and primed for a potential breakout. Momentum is gradually building, and I expect the price to soon test the $0.185 level, followed by short-term targets at $0.20, $0.24, and $0.266.
In the long run, my bullish bias remains firm with targets at $0.37, $0.45, and a psychological milestone of $1.00, representing a potential upside of over 500% from current levels!
Fundamental Drivers Supporting the Move
• Tokenomics: Recent unlocks have distributed supply more evenly, easing early-seller pressure and improving liquidity dynamics.
• Utility & Adoption: As a Web3 AI-execution layer, GT Protocol is expanding its real-world use cases with new partnerships and integrations.
• Narrative Strength: Positioned as a leading AI narrative for 2024, $GTAI is gaining traction amid rising AI sector demand.
Sentiment & On-chain Signals
• Community Hype: Activity on X (Twitter) and Telegram is surging, with bullish sentiment dominating conversations since the recent breakout attempt.
• Social Volume: A spike in daily mentions suggests increasing retail attention—often a precursor to strong moves.
• Whale Accumulation: Smart money has been seen accumulating below current levels—an early sign of confidence in the next leg up.
With both the technical setup and fundamentals aligning, $GTAI looks ready for an explosive run. Keep it on your radar!
Please support me with your likes and comments to motivate me to share more analysis with you and share your opinion about the possible trend of this chart with me !
Best Regards , Arman Shaban

Ethereum's Monthly High Rejection: Is a Bearish Wave Coming?FenzoFx—Ethereum tested and swept the monthly highs at $2,813 but failed to sustain its bullish momentum. The 1-hour chart formed a bearish fair value gap, signaling increasing selling pressure.
Currently, Ethereum trades slightly below the monthly high at approximately $2,806, with immediate resistance at $2,813. If this level holds, ETH/USD could target the 50.0% retracement zone near $2,640.

ETHBTC - Showing ActivityETHBTC has jumped up and has formed a short term bullflag
Has ETHBTC bottomed?
ETH ^^
Daily chart

ETHEREUM BULLFLAGA nice bullflag structure has presented itself on this daily timeframe
I think this bullflag will allow ETH to catch up to BTC in term of alts vs BTC
I expect a very strong bullish move to be coming in the next month or next month breaking out of this bullflag
Green horizontal has been seen previously as a point of support.

ETHEREUM Potential Bullish BreakoutEthereum price seems to exhibit signs of overall potential Bullish momentum if the price action forms a prominent Higher High with multiple confluences through key Fibonacci and Support levels which presents us with a potential long opportunity.
Trade Plan:
Entry : 2950
Stop Loss : 2200
TP 1 : 3700
ETHEREUM This Megaphone emerged on all previous Cycles.Ethereum (ETHUSD) is showing incredible strength at the moment as it broke above its 1W MA50 (blue trend-line) and its goal now will be to close the week above it.
This resembles May 2020 and January 2017 when again the price was struggling to break above its 1W MA50, all within a similar Megaphone pattern, and eventually succeeding. The similarities among those 3 patterns so far are striking despite being formed on different Cycles.
As you can see, we are currently on the 0.618 Fibonacci level of the Megaphone, which is exactly where ETH was during the other 2 Cycles when it tested the 1W MA50 and broke out. Once the 1W MA50 turned into Support, the market never looked back and initiated the parabolic rallies of 2020/ 2021 and 2017.
Based on that, we expect ETH to test the 1.5 Fibonacci extension, around $7000.
-------------------------------------------------------------------------------
** Please LIKE 👍, FOLLOW ✅, SHARE 🙌 and COMMENT ✍ if you enjoy this idea! Also share your ideas and charts in the comments section below! This is best way to keep it relevant, support us, keep the content here free and allow the idea to reach as many people as possible. **
-------------------------------------------------------------------------------
💸💸💸💸💸💸
👇 👇 👇 👇 👇 👇

ETH Just Broke Out — Here’s Why $3,445 and $3,995 Are TPsEthereum is showing a strong bullish structure on the daily chart, having recently broken out of a month-long consolidation channel. After spending over 35 days trading in a narrow sideways range between approximately $2,345 and $2,780, ETH has now pushed through the upper boundary of that zone, signaling a shift in momentum.
This breakout from the accumulation zone is significant. The highlighted box on the chart indicates a period of low volatility and tight price compression—often a precursor to a sharp directional move. The breakout candle was decisive and supported by rising volume, as confirmed by the PVT (Price Volume Trend) indicator, which shows a clear uptick in accumulation. This suggests that institutional and smart money may be positioning for further upside.
The reclaimed level around $2,503, previously acting as major support, is now serving as a strong base. If ETH continues to close daily candles above this threshold, the bullish momentum is likely to continue. The immediate resistance lies around $3,445, marking the first target zone (TP1), followed by a more ambitious extension toward $3,995, which aligns with Resistance Level 2 (TP2). These targets represent gains of approximately 21% and 41% from current levels, respectively.
A measured trade setup from the current zone offers a solid risk-reward ratio of 2.4. The stop loss is reasonably placed just below the breakout structure at $2,344. If ETH falls back below this level and closes inside the previous channel, the breakout would be invalidated, and bulls would need to reassess.
This setup aligns with a classic trend continuation pattern—breakout from consolidation, volume confirmation, and a potential retest of the breakout level. As long as price remains above $2,503, bulls remain in control, and the medium-term outlook remains favorable.
In conclusion, Ethereum appears poised for a bullish continuation on the daily timeframe. The channel breakout, rising accumulation pressure, and clean technical structure support the idea that ETH may soon challenge higher resistance zones. However, price must hold above key support to maintain this bias. Traders and investors may view current levels as a favorable risk-entry opportunity with eyes on $3,445 and $3,995 as major profit zones.

Ethereum Set for a Massive Pump!ETHUSDT Technical analysis update
ETH price has been trading within a channel pattern for the past 30 days, with the 100 and 200 EMA acting as strong support on the 4H chart. Therefore, the likelihood of the price dropping below the 100 and 200 EMA on the 4H chart is very low. Once the price breaks above the channel resistance, we can expect a strong bullish move in CRYPTOCAP:ETH
BITSTAMP:ETHUSD

Bullish continuation?Ethereum (ETH/USD) is falling towards the pivot and could bounce to the 1st resistance.
Pivot: 2,732.37
1st Support: 2,548.35
1st Resistance: 2,898.51
Risk Warning:
Trading Forex and CFDs carries a high level of risk to your capital and you should only trade with money you can afford to lose. Trading Forex and CFDs may not be suitable for all investors, so please ensure that you fully understand the risks involved and seek independent advice if necessary.
Disclaimer:
The above opinions given constitute general market commentary, and do not constitute the opinion or advice of IC Markets or any form of personal or investment advice.
Any opinions, news, research, analyses, prices, other information, or links to third-party sites contained on this website are provided on an "as-is" basis, are intended only to be informative, is not an advice nor a recommendation, nor research, or a record of our trading prices, or an offer of, or solicitation for a transaction in any financial instrument and thus should not be treated as such. The information provided does not involve any specific investment objectives, financial situation and needs of any specific person who may receive it. Please be aware, that past performance is not a reliable indicator of future performance and/or results. Past Performance or Forward-looking scenarios based upon the reasonable beliefs of the third-party provider are not a guarantee of future performance. Actual results may differ materially from those anticipated in forward-looking or past performance statements. IC Markets makes no representation or warranty and assumes no liability as to the accuracy or completeness of the information provided, nor any loss arising from any investment based on a recommendation, forecast or any information supplied by any third-party.

ETH BULLISH SETUPEthereum has recently broken out bullishly on higher timeframes, signaling a potential move toward the key resistance zone around $3,460. This level holds significant technical importance. The breakout above the hourly flag pattern confirms bullish momentum. As long as price holds above $2,300, the setup remains valid. A drop below this level would invalidate the current bullish outlook.

ETH Daily Close Signals Entry
On the daily, ETH is closing above both the 200MA and the previous tops. PSAR on the original system has flipped, though the free-to-use version hasn’t yet.
This is a trading idea. If you choose to allocate real capital, be prepared for the possibility of loss. But if you trust the system enough to allocate capital, trust that the PSAR has flipped and today’s close marks the entry.
It’s exactly how the system defines a valid setup:
Daily close above the 200MA, with MLR > SMA > BB center.
The 12H timeframe acts as confirmation from the lower TF, and the 4H is already green and ripping.
So buckle up—this could be a ride worth taking.
Always take profits and manage risk.
Interaction is welcome.

ETH – System Trigger Hit
ETH on the 12H has just reclaimed the green line: resistance from the previous tops.
This level sits roughly midway between the 0.5 and 0.382 Fib levels, with \$3000 now looking closer than \$2500.
PSAR has just flipped above the last tops, and price is now above MLR > SMA > BB center > 200MA.
All system conditions are met for a long entry on this timeframe.
This also comes as confirmation of the daily signal entry at today closing
Always take profits and manage risk.
Interaction is welcome.
