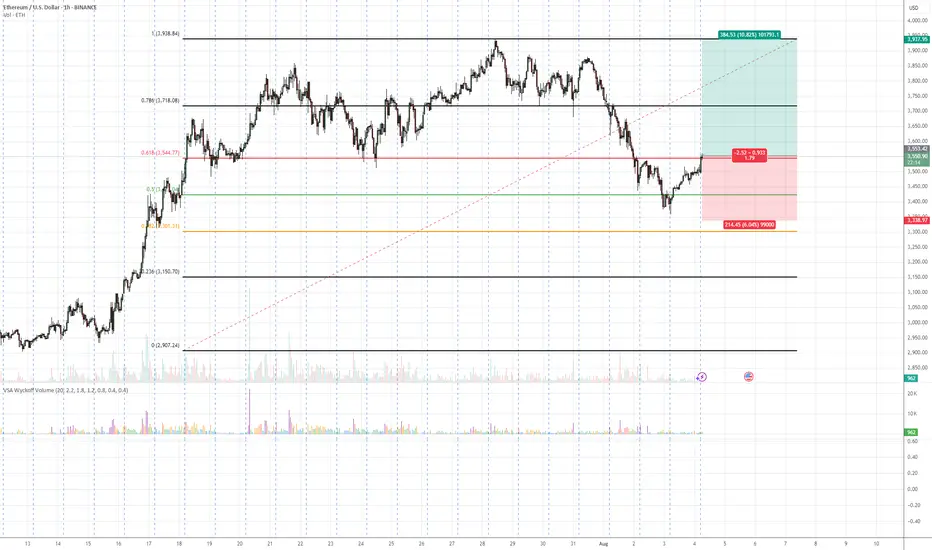
ETH/USDT – Bullish Reversal Potential from Fibonacci Confluence 💡 Idea:
Ethereum is showing signs of demand absorption at a critical Fibonacci support cluster (0.5 – 0.618 retracement). VSA patterns confirm that selling pressure is being absorbed, hinting at a possible markup toward previous swing highs.
📍 Trade Setup:
Entry: Current levels near 3,551
Target: 3,937 (+10.82%)
Stop Loss: 3,338 (below last absorption zone)
R:R Ratio: ~1.79:1
📊 Technical Reasoning (VSA)
1. Stopping Volume at Fibonacci Support
ETH tested the 0.5–0.618 retracement zone from its prior bullish impulse.
Wide spread down-bars on high volume failed to produce significant downside progress, signaling professional buying.
2. No Supply Confirmation
Following the stopping volume, the market printed narrow range candles on decreasing volume, indicating supply exhaustion.
3. Demand Emergence
The recent push above short-term resistance came with increasing volume and wider up-bar spreads, suggesting the start of an accumulation-to-markup transition.
4. Structure & Fibonacci Confluence
Current rally aligns with the Fibonacci golden zone and past structural support.
📌 Trading Plan:
Enter on confirmed breakout above minor resistance with volume expansion.
Scale out partial profits near 3,800 and let remainder ride toward 3,937.
Keep stop below 3,338 to avoid being shaken out by false breakouts.
Ethereum (Cryptocurrency)
Important Trend Determination Area: 3708.87-3762.33
Hello, traders!
Follow us to get the latest information quickly.
Have a great day!
-------------------------------------
(ETHUSDT 1D Chart)
The price began to rise after breaking above the important 2419.83-2706.15 area.
This can be interpreted as the beginning of a step-up trend, with an upward breakout of the HA-High ~ DOM(60) range.
The HA-High ~ DOM(60) range corresponds to the 2581.59-2681.60 range.
This suggests that the price is currently testing whether a second step-up trend will continue or whether it will simply end as the first step-up trend.
The HA-High ~ DOM(60) range is currently 3708.87-3762.33.
Therefore, if the price rises above 3708.87-3762.33 and maintains this level through the upcoming volatility period, a second step-up trend is expected.
The conditions for this are as follows:
- The K value of the StochRSI indicator must rise from the oversold zone and show an upward trend with K > D. - The OBV indicator must rise above the High Line and maintain an upward trend.
- The TC (Trend Check) indicator must continue its upward trend. (If possible, it's best to stay above 0.)
The next volatility period for ETH is expected to last from around August 6th to 10th.
However, it's worth keeping an eye on the movements during the BTC volatility period.
-
Thank you for reading to the end.
I wish you successful trading.
--------------------------------------------------
- This is an explanation of the big picture.
(3-year bull market, 1-year bear market pattern)
I will explain in more detail when the bear market begins.
------------------------------------------------------

ETHEREUM SEASON LOADING!Ethereum appears to be literally following bitcoin's pattern ahead of its 2021 bull run

Ethereum - Finally new all time highs!🔬Ethereum ( CRYPTO:ETHUSD ) will break out now:
🔎Analysis summary:
For more than four years, Ethereum has overall been moving sideways. However now Ethereum is once again retesting previous all time highs and preparing a bullish breakout. Multiple retests are generally considered bullish so the breakout is very likely to happen any time soon.
📝Levels to watch:
$4.000
🙏🏻#LONGTERMVISION
SwingTraderPhil

EthusdHonestly probably marks up very heavily soon...
We are entering etf bid war phase of the cycle.
Can't even really draw how vertical this chart could go as certain macro economic conditions seem to be brewing...
15k is the predicted target of certain large tradfi firms that are accumulating, bitmine for example.
They are basing their targets from the success of the circle internet groups public listing as well as fundamental factors such as JPMorgan and other institutions launching their own stable coins on ethereum...
Multiple companies rushing to accumulate 5% of the supply while predictions of a 75bps rate cut from the fed are starting to brew...
Supply shock combined with inflationary event aswell as eths successful merge earlier this year are incredibly bullish catalysts and we aren't even at the ath valuations seen last cycle.

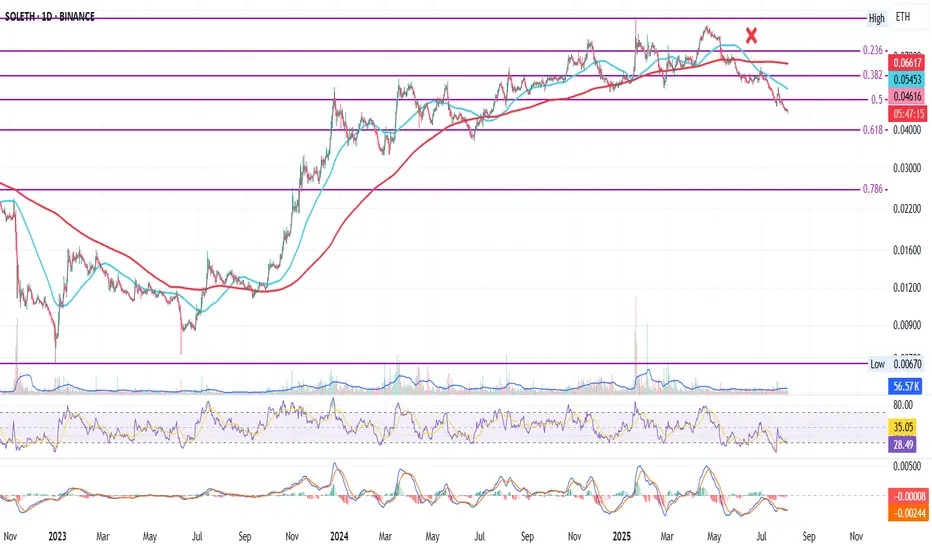
SOL vs ETH: Bleeding Until Catalyst?
SOL/ETH on the Daily
On June 17, 2025, a death cross formed — and since then, SOL has been steadily losing ground to ETH.
Attempts to pause or reverse the trend at the 0.382 and 0.5 Fib levels have failed. Momentum is strong to the downside.
The next potential support is the 0.618 Fib, around 0.04000.
In my view, this is closely tied to Ethereum’s dominance narrative: ETF inflows, real-world assets, stablecoins, Trump support, protocol upgrades — the spotlight is firmly on ETH.
Unless SOL gets its own ETF (which, to my knowledge, it currently doesn't), it’s likely to keep bleeding against ETH — just like other altcoins in similar positions.
Bias: bearish until proven otherwise.
Always take profits and manage risk.
Interaction is welcome.
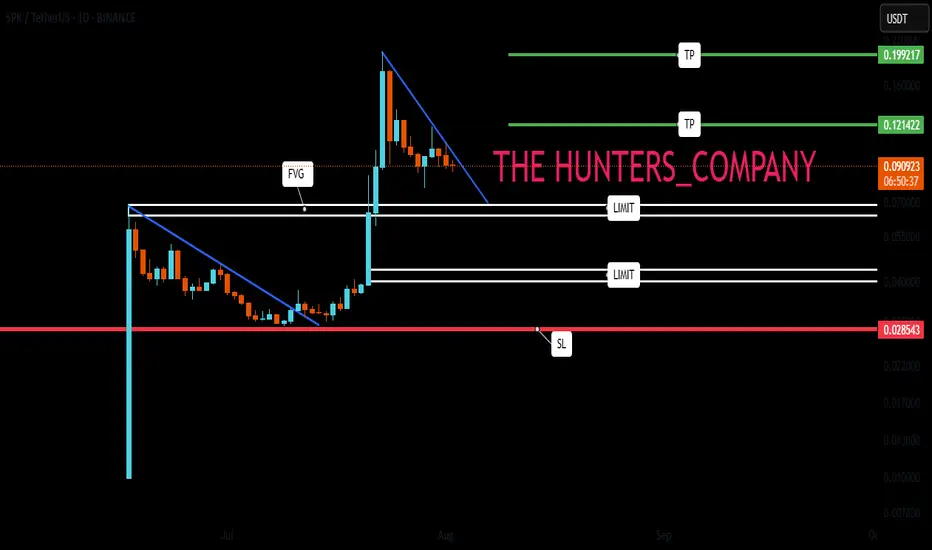
SPK : Does history repeat itself?Hello friends🙌
✅You see that once a pattern was formed and after the resistance was broken, we had a good growth.
✅Now the same pattern has formed again and the price is in the accumulation phase.
✅We have to see if history repeats itself and if the buyers support the price again or not.
✅We have obtained important support areas for you, so that if it falls, you can buy in steps and if the pattern breaks, you can buy in steps right here, of course with capital and risk management.
🔥Follow us for more signals🔥
*Trade safely with us*
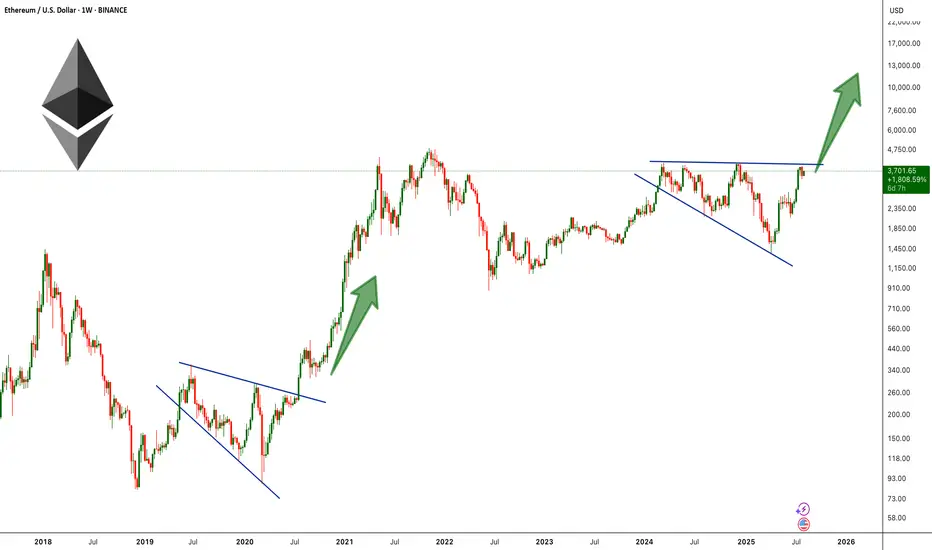
ETH Broadening Wedge Formation !BINANCE:ETHUSDT is forming a broadening wedge pattern on the weekly chart, a structure that often signals high volatility and strong momentum once the price breaks out. This setup is reminiscent of ETH’s 2019–2020 pattern, which also formed as a broadening wedge before breaking to the upside and triggering a historic rally to new all-time highs.
Currently, ETH is pressing against the upper resistance line of the wedge near the $3,900–$4100 zone, a level that has acted as major resistance multiple times in recent months. A decisive breakout above this barrier could ignite strong bullish momentum, opening the path toward the $6,000–$10,000 range.
Cheers
Hexa
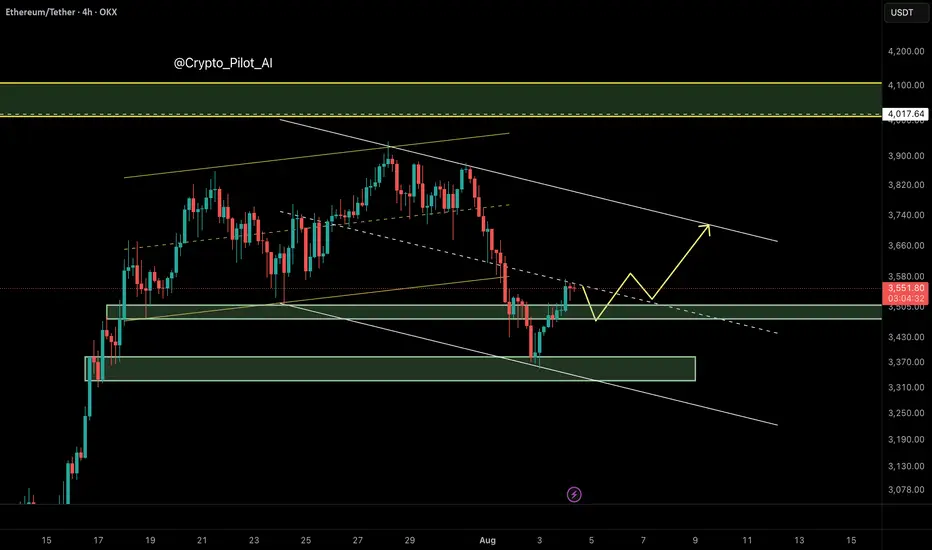
ETH 4H – Demand Ladder Holding Strong, Bullish Set Up?Ethereum has been climbing a ladder of demand zones on the 4H chart — with each major impulse followed by consolidation and a successful retest of prior support. This current pullback has once again tapped into a reclaimed demand area near $3,400–$3,500.
So far, every past structure has acted as a springboard for the next leg up — a pattern that’s held since April.
📊 Key insights:
– Multiple confirmed demand zones stacking higher
– Prior demand flips to support after each breakout
– Most recent pullback held structure with Stoch RSI bouncing from oversold
– Structure and momentum suggest potential continuation if $3,400 holds
A breakdown of this final zone could invalidate the staircase, but until then, structure favors the bulls.
Is ETH gearing up for $4,000+ or finally losing steam?
Drop your thoughts in the comments.

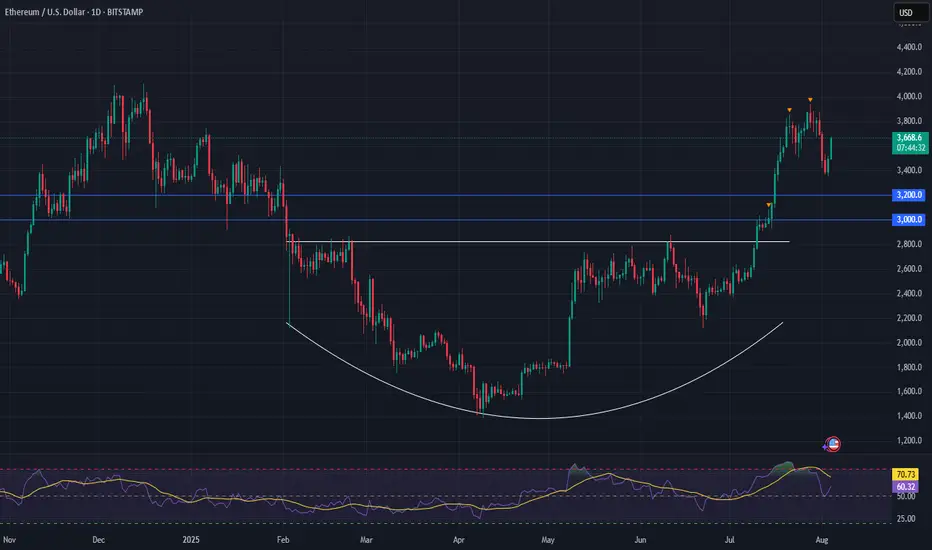
Ethereum (ETH) is setting up for a powerful moveFollowing a strong breakout, ETH has entered a healthy consolidation phase—setting the stage for its next leg higher.
Momentum remains firmly on the bulls’ side, with the breakout from a long-term saucer pattern fueling continued upside pressure.
📈 Technical Highlights:
✅ Short-term target: $4,000+ (breakout continuation)
✅ Long-term potential: $7,000+
🛡️ Key support: $3,000–$3,200 (bullish as long as this holds)
📣 Takeaway:
Ethereum is showing classic bullish structure. With higher-lows forming and strong support below, pullbacks are likely to offer high-probability entries for both traders and long-term holders.
#Ethereum #ETHUSD #Crypto #Trading #TechnicalAnalysis #CryptoTrading #EthereumPrice #Altcoins #Bullish #Breakout
ETH/BTC Golden Cross Ignites
This is ETH/BTC on the daily chart.
The golden cross is now confirmed: 50MA has officially crossed above the 200MA.
Price reacted immediately, jumping straight to the 0.786 Fib level at 0.0347 a key resistance.
This confirms the bullish structure we’ve been tracking:
– Golden cross ✅
– Breakout above 200MA ✅
– Push into major resistance ✅
Now all eyes are on the 0.0347 zone.
If price can flip it into support, momentum could accelerate quickly.
Always take profits and manage risk.
Interaction is welcome.

ETH/BTC: Golden Cross Reloaded?This is ETH/BTC on the daily chart.
A major event is about to unfold: the golden cross, where the 50MA crosses above the 200MA.
The last time this happened was in early 2020, around the same price zone, right after a bounce off the 2019 low double bottom and a rejection from the 0.5 Fib level, which sits halfway between the 2019 low and the 0.786 Fib.
In 2025, we’re seeing a strikingly similar pattern:
– Price bounced off the 2019 low
– Got rejected again from the 0.5 level
– And now appears to be gathering strength to flip that level and the 200MA to confirm the Golden Cross
Always take profits and manage risk.
Interaction is welcome.

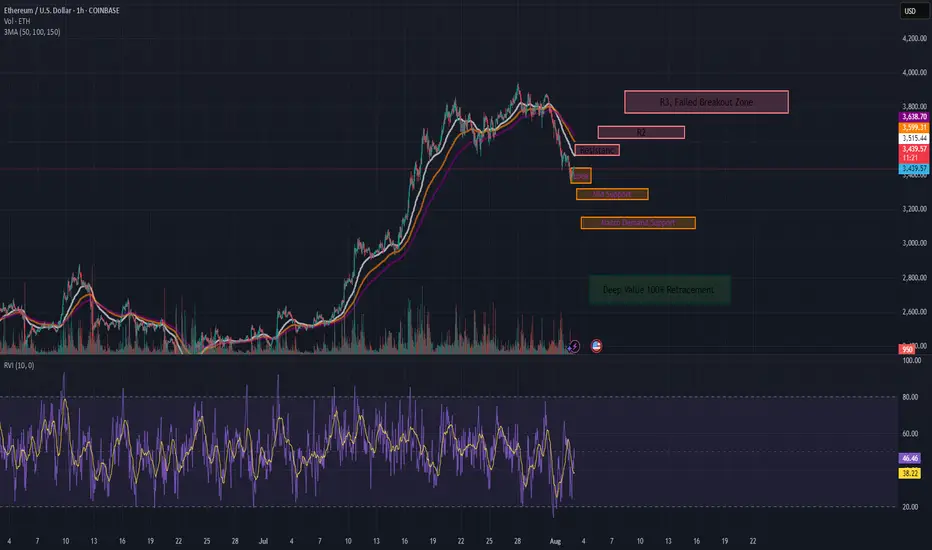
ETH Tactical Long: Laddered Bounce from Absorption ZoneCOINBASE:ETHUSD has been in a steady 1H downtrend, but key support at $3,440 is showing signs of absorption. Volume is thinning on sell-offs, and we're seeing early reversion signals.
This is my over the weekend analysis, not a final recommendation.
Setup Type: Mean Reversion / Absorption Bounce
- Trend: Still bearish on 1H (below 50/100/150 MAs), but slope compression hints at weakening
momentum
- RVI: Below 50, but curling up → early bounce bias
- Volume: Sellers fading into $3,440 = buyer absorption zone
📊 1hr Quant Entry Levels & Laddered Plan
Zone Type Action
$3,440–3,435 Primary Entry Base long entry zone 🔄
$3,420–3,410 Add-on Entry Optional bid stack 🧱
$3,320 Soft Invalidation Trend continuation if lost 🚫
$3,150 Deep Value Wick Low-prob, high-juice trap 💎
🎯 Targets:
T1: $3,515 → EMA cluster rejection zone
T2: $3,600–3,638 → Range midpoint
T3: $3,800 → Trend reversal if reclaimed
⚖️ Risk/Reward: 1:2.5+ (depends on fill ladder)
We are starting entries here, but be cautious if we break through our support levels and you don't have the appetite for the deep value range it may be wiser to wait for a confirming trend or post.
ETH Gears Up Again
ETH on the 4H is confirming the uptrend
MLR > SMA > BB Center — trend structure is bullish
PSAR has flipped bullish
RSI has plenty of room to run
MACD has turned green
Next resistance: 0.236 Fib and the 50MA.
On the macro side:
• Fed chair replacement talks
• Slower job numbers
• CFTC launching “Crypto Sprint”
Momentum is building. We’ll be here to watch it unfold.
Always take profits and manage risk.
Interaction is welcome.

Bitcoin Range for August?Historically August has been a tough month for crypto in the past with mostly flat to negative returns. For that reason, although not a perfect science, I would not be surprised if we see a rangebound environment continuation for BTC.
So what would that look like? Structurally there are three thirds to the range, currently price is looking to break through into the upper third after bouncing off the bottom third bullish orderblock.
Trade setups will naturally present themselves as rotational plays both bullish and bearish at the extremes of each of the thirds but much larger trades from the range top and bottom.
Altcoins are lagging behind BTC structurally so where BTC has been choppy for a few weeks, most large cap alts have hit their highs and are now looking to settle into a range before the next leg up.

Testing $3,500 Support, Rebound Ahead?Instrument: ETHUSD
Timeframe: Daily
Date: August 4, 2025
Analysis:
ETH fell 7.9% to $3,500 from $3,800, testing support after failing to break its high. The hawkish FOMC and rising BTC.D (62%) pressured altcoins. I entered the dip on $3,500, as shared on X and my previous report
Chart Setup:
Support: $3,500
Resistance: $3,600, $3,800

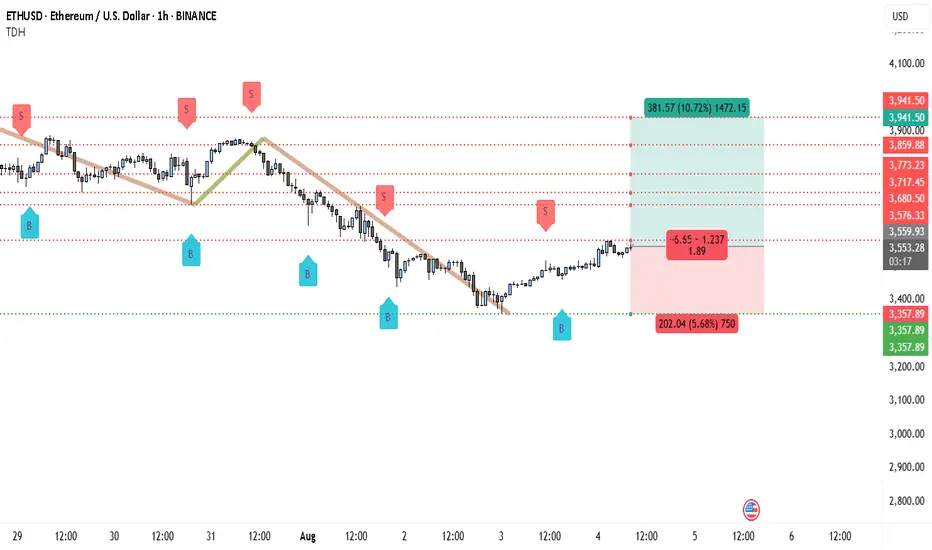
Ethereum’s 1H Chart Screams Breakout — Next Stop $3,941?Ethereum has recently broken above a short-term descending trendline that had been guiding the market lower over the past sessions. This breakout occurred after price formed a strong base around the $3,357 support zone, indicating that sellers were losing momentum. The “B” buy signals printed near these lows further strengthen the bullish outlook.
The immediate resistance lies around $3,559, which is the level price is currently approaching. If buyers can maintain momentum above this area, the next upside targets are $3,576, $3,680, $3,717, and $3,773. The major resistance and projected take-profit area is near $3,941.
From a structural standpoint, the shift from lower lows to higher lows suggests that the short-term trend may be reversing in favor of buyers. This aligns with the increased buying volume observed after the breakout, hinting at potential follow-through in the next London or New York session.
Trading Setup
• Entry: Around $3,553 after breakout confirmation
• Stop-loss: Below $3,357
• Take-profit 1: $3,680
• Take-profit 2: $3,773
• Final Target: $3,941
• Risk-Reward: Approximately 1.89:1
Ethereum (ETH/USDT) – Bearish Channel Structure Developing
⸻
🔍 Technical Overview
Ethereum has broken down from its ascending channel, invalidating the earlier bullish projection toward $4,000. After failing to hold the channel midline around $3,577, price dropped sharply to $3,360, forming a new bearish descending channel.
Currently, ETH is trading near the midline of this bearish channel, which typically acts as a decision point — not a buying zone — in smart money models.
⸻
🧠 NEoWave Interpretation
We may be inside a Complex Corrective Wave, possibly a Running or Contracting Flat evolving after the March top. The current structure resembles a B-wave trap, where price fakes out the upside before shifting momentum sharply downward. The break below the ascending channel midline confirms this bearish shift.
⸻
📊 Smart Money Summary
• 🟥 BOS confirmed on 1H and 4H (lower highs and lower lows)
• 🔻 Midline failure acted as a smart money trap, followed by a liquidity sweep below $3,490
• 📦 Bullish Order Block around $3,490–$3,520 has been tapped, prompting a minor reaction
• 🟡 Current resistance sits near the channel top ~ $3,715
⸻
🎯 Trade Scenarios
📌 Bearish Continuation:
If price fails to reclaim above $3,715, a retest and rejection from the channel top could trigger continuation toward $3,300–$3,250.
📌 Bullish Reversal (less likely for now):
Only a clean break and hold above $3,720 would suggest that bulls are regaining control, opening path toward $3,900–$4,000 — though this scenario is weakened after structural damage.
⸻
⚠️ Trader Tip:
Avoid buying into midline reactions in weak channels. Better long setups form after stop-hunts, ideally near bullish OBs + internal BOS confirmations.
⸻
✅ Conclusion
Ethereum remains under bearish pressure after losing its ascending structure. Unless price reclaims the $3,715 resistance zone with momentum, downside continuation remains likely.
⸻
📌 Save this analysis
💬 Share your thoughts or alt wave counts in the comments.
ETH Looks Bearish (3D)Ethereum approached the weekly trendline and experienced a correction. It seems likely that we may see one more push upward to create a false bullish sentiment on this coin. There is even a possibility of a fake breakout above the descending trendline. However, before any major move, a significant correction toward the green zone appears likely | after which the main bullish move is expected to occur.
On higher timeframes, this is currently our outlook on Ethereum.
A daily candle closing above or below the invalidation levels would negate the current buy or sell bias.
For risk management, please don't forget stop loss and capital management
Comment if you have any questions
Thank You

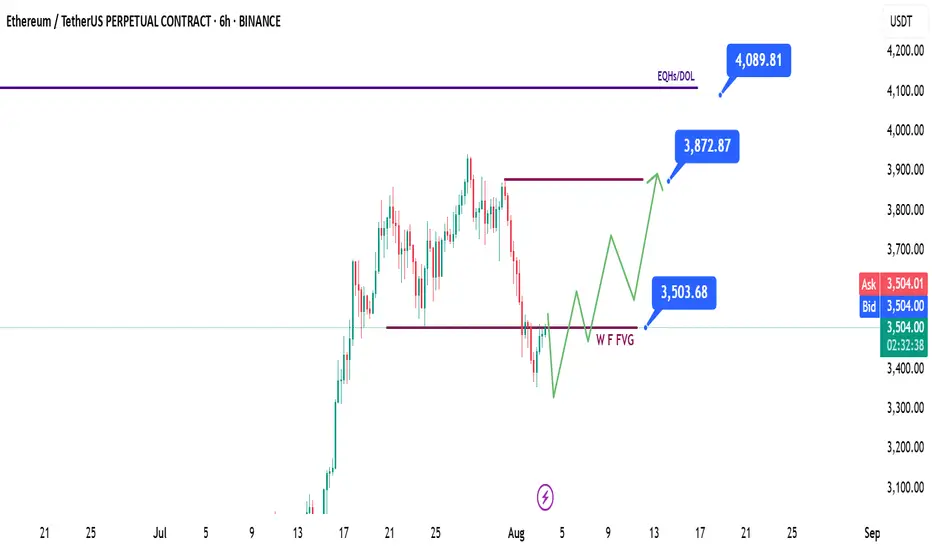
ETH | Ethereum - Weekly Recap & Gameplan - 03/08/25📈 Market Context:
Traders are currently anticipating a potential 0.25% rate cut at the September FOMC meeting, which continues to support the broader bullish outlook.
While the market pulled back following weaker-than-expected Non-Farm Payroll data, overall sentiment remains optimistic.
Greed has cooled off into a more neutral stance. Historically, August often brings some consolidation or pullbacks — but the structural bias for crypto market remains bullish.
🧾 Weekly Recap:
ETH started the retracement movement after building a bullish trend over the past couple of weeks.
It’s mainly being affected by Bitcoin's bearishness, so we’re closely following BTC’s price action.
ETH has tapped into the Weekly Fair Value Gap, which is a key level for me.
We may see a bounce from here.
📌 Technical Outlook & Game Plan:
I expect to see another low on ETH before we go up — as I’m also anticipating one more leg down on Bitcoin.
So I’ll wait for a final bearish expansion and a trap for late sellers before positioning for longs.
After that, I want to see price closing above the purple line at $3500.
🎯 Setup Trigger:
A candle close above the $3500 level will be my signal to look for long setups.
📋 Trade Management:
Stoploss: Below the swing low that breaks above $3500
Take Profit: Targeting $3870, but will trail and lock in aggressively in case of deeper downside expansion.
💬 Like, follow, and comment if this breakdown supports your trading! More setups and market insights coming soon — stay connected!
Bitcoin Dominance & The Fall of AltcoinsBitcoin has sold off sharply in recent session.
Allowing alt coins to capture small percentages of bitcoins liquidity which resulted in epic bullish moves.
Now that Bitcoin is retesting a major moving average (50 MA) we might see BTC recapture some of that crypto dominance.
Other alt coins are well off of their 50 day moving average making them a riskier buy.
When BTC dominance starts to take leadership we often see alt coins and the total market cap sell off.
Bitcoin dominance is hitting a multi year trendline and looks poised to capture some of the alt liquidity.
We still think BTC can sell off and go lower, but on a relative basis it should hold up better than other alt coins & Ethereum.
There are some key nuances that are building and shaping up for a very similar topping formation that occurred in 2021.

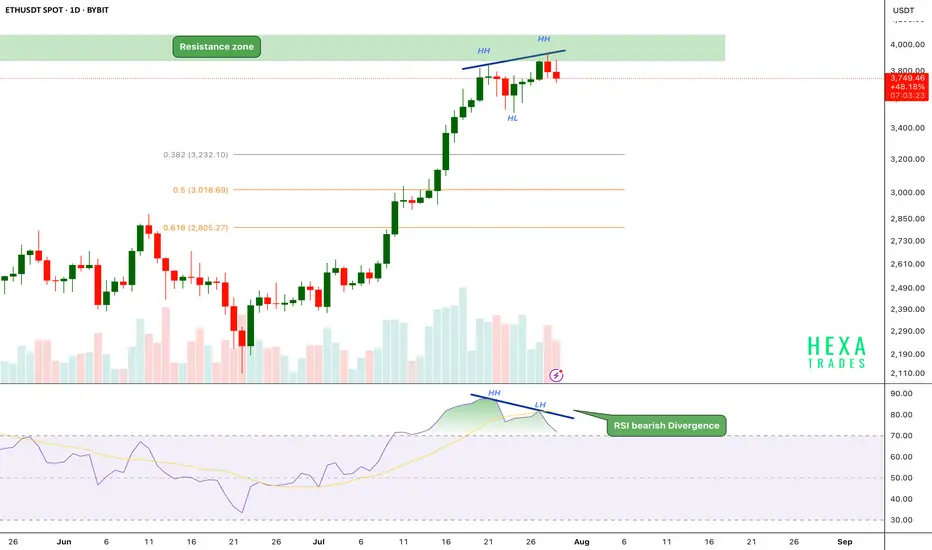
ETH Bearish Divergence!CRYPTOCAP:ETH has been in a strong uptrend, printing consistent higher highs (HH) and higher lows (HL). However, on the daily chart, the price has now reached a critical resistance zone near the $3,800–$4,000 range.
Key Points:
🔸 Bearish RSI Divergence
While price action has formed a new higher high, the RSI has printed a lower high, signaling bearish divergence.
This indicates that upward momentum is weakening even as price attempts to push higher — a common early warning of a possible short-term reversal.
🔸 Fibonacci Retracement Levels
The fib 0.382 at $3240 and 0.5 and 0.618 retracement levels are sitting around $3,000 and $2,800, respectively, potential targets if a correction follows.
🔸 Volume Profile
Volume is gradually declining as price approaches resistance, suggesting buyer exhaustion.
If the price breaks above the $4,000 psychological resistance, we could see a strong bullish move.
ETH is facing strong resistance after a powerful rally, with RSI bearish divergence and weakening momentum hinting at a possible short-term pullback. We should be cautious entering fresh longs here without confirmation.
Support: $3,200, $3,000, and $2,800
Cheers
Hexa
BINANCE:ETHUSDT BITSTAMP:ETHUSD
ETH 4H – MACD Histogram Caught The 54% Increase, Did You?The MACD Liquidity Tracker Strategy doesn’t just catch trends — it shows you how strong they are. On this ETH 4H chart, a textbook move unfolds:
🔹 Histogram flipped positive → Long entry triggered
🔹 Rising bars = building momentum
🔹 Tallest bar = momentum peak (July 21)
🔹 Shrinking bars signaled a weakening trend before price ever reversed
🔹 Histogram turned negative → clean exit at the top
The MACD histogram is a direct visual of momentum:
– Bars rising = acceleration
– Bars shrinking = exhaustion
– Crossing below 0 = confirmation of reversal
⚙️ Strategy Settings:
– MACD: 25 / 60 / 220
– EMA Filter: 50 / 9 / 3
– Entry Mode: Histogram + Crossover Combo
