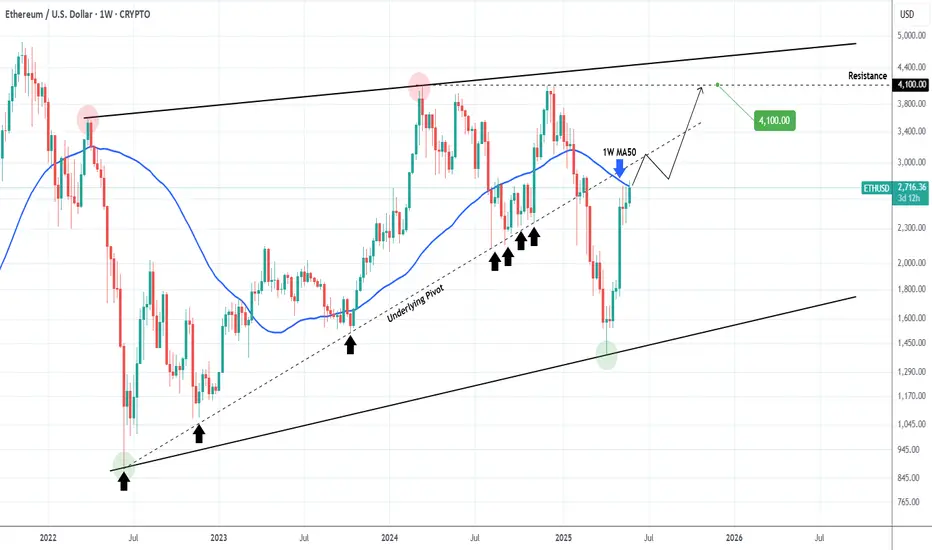
ETHEREUM Break above this level and things get real interesting!Ethereum (ETHUSD) broke above its 1W MA50 (blue trend-line) this week and will attempt to close the week above it to confirm the official restoration of the long-term bullish trend.
Regardless of that, there is another hidden trend-line that may dictate the pace of that potential bullish break-out and is no other than the underlying Pivot trend-line that started on the June 13 2022 market bottom and acted as Higher Lows up until February's Tariff fueled correction.
As a result, this is now posing as a Resistance and a break above it should technically deliver rallies similar to the Bullish Legs of 2023 - 2024.
Our 4100 Target remains intact.
-------------------------------------------------------------------------------
** Please LIKE 👍, FOLLOW ✅, SHARE 🙌 and COMMENT ✍ if you enjoy this idea! Also share your ideas and charts in the comments section below! This is best way to keep it relevant, support us, keep the content here free and allow the idea to reach as many people as possible. **
-------------------------------------------------------------------------------
💸💸💸💸💸💸
👇 👇 👇 👇 👇 👇
Ethereum (Cryptocurrency)
TON/USDT on Fire: Bullish Momentum Builds Toward Major Targets!By examining the #TONCOIN chart on the 3-day timeframe, we can see that after correcting down to $3, the price has started pumping again and is showing strong bullish momentum. So far, it has gained over 15%, and I expect this uptrend to continue! The next targets are $3.64, $4.20, and $4.66. The expected return is around 20% in the short term, 40% to 55% in the medium term, and 110% in the long term. Support this analysis and stay tuned for more updates, my friends!
Please support me with your likes and comments to motivate me to share more analysis with you and share your opinion about the possible trend of this chart with me !
Best Regards , Arman Shaban

Ethereum - Expecting Bullish Continuation In The Short TermH1 - We have a clean bullish trend with the price creating a series of higher highs, higher lows structure.
This strong bullish momentum is followed by a pullback.
No opposite signs.
Until the two Fibonacci support zones hold I expect the price to move higher further.
If you enjoy this idea, don’t forget to LIKE 👍, FOLLOW ✅, SHARE 🙌, and COMMENT ✍! Drop your thoughts and charts below to keep the discussion going. Your support helps keep this content free and reach more people! 🚀
--------------------------------------------------------------------------------------------------------------------
Disclosure: I am part of Trade Nation's Influencer program and receive a monthly fee for using their TradingView charts in my analysis.

ETHBTC AnalysisETHEREUM chart against BITCOIN is still playing inside wave B of this ABC pattern and still needs to cool off before it make the final big move.
We have highlighted two possible scenarios . Let's see how it goes.

Ethereum Tests Triangle Resistance Amid Positive NewsflowEthereum is attempting to break out of an ascending triangle, supported by the recent U.S. tariff court ruling that came just hours ago. The 2740–2756 zone remains key, and despite a brief spike above, resistance is still holding. If a breakout is confirmed, the next major target lies at 3075. To reach that level, a new trend channel may form, potentially running parallel to the triangle’s lower line.
While Ethereum is benefiting from both the court decision and Nvidia’s strong earnings, the bullish momentum from the ruling may not last long. Therefore, Ether bulls should be cautious with leveraged long positions despite the favorable technical setup.

ETHUSDTEither from the current price or from the price of 2653.06, the areas worth buying are at $2852, in either case the price will reach 2852. BINANCE:ETHUSDT

Potential ETH IH&S Continuation (4H)BINANCE:ETHUSDT might be forming an Inverse Head & Shoulders on the 4H chart.
• A right shoulder around ~$2400 would complete the pattern
• Confirmation comes with a breakout above the $2730 neckline
• Measured move target: ~$3130
Keep an eye on ~$2800 – it's a key daily/weekly S/R that could provide strong resistance and possibly stall the breakout.
In a No-Trade Zone until either a bounce from $2400 or a break above $2730.

#ETH/USDT#ETH
The price is moving within a descending channel on the 1-hour frame, adhering well to it, and is heading for a strong breakout and retest.
We are seeing a bounce from the lower boundary of the descending channel, which is support at 2465.
We have a downtrend on the RSI indicator that is about to break and retest, supporting the upward trend.
We are looking for stability above the 100 moving average.
Entry price: 2558
First target: 2640
Second target: 2702
Third target: 2768

ETH NEW UPDATE (12H)This analysis is an update of the analysis you see in the "Related publications" section
This analysis is still valid.
Ethereum has a liquidity pool above the chart, and just behind that pool, there is a fresh order block.
After sweeping the liquidity pool and hitting this order block, the price is expected to drop toward the flip zone.
For risk management, please don't forget stop loss and capital management
When we reach the first target, save some profit and then change the stop to entry
Comment if you have any questions
Thank You

ETH/USDT Trade Setup: Bullish Trend, Entry Zone & More🚀 ETH/USDT Trade Setup 💸📊
Keeping a close eye on Ethereum paired with USDT right now. 🔍📈
ETH has been holding a solid bullish trend, with healthy pullbacks into value zones that have repeatedly offered discounted long entries. 🛒⚡
I’m bullish overall, looking to trade with the trend. Looking for ETH to dip into my preferred entry zone. 🎯
🛡️ Stop-loss to go just beneath the most recent swing low to keep risk tight and controlled.
In this video, I cover:
🔹 How I apply Fibonacci tools to dial in my entry points and targets
🔹 My full ETH game plan, including the zones I'm watching and how I’m managing this setup
⚠️ Not financial advice. Always do your own due diligence and risk management.
💬 Are you trading ETH right now? What are your thoughts? Let me know in the comments below! 👇🔥

Ethereum Ethereum has rebounded significantly and needs a short respite. We are currently trading at a strong resistance level and experiencing strong selling pressure at the 2700 area. The correction will end at 2435/2335.

Ethereum 8X Leveraged Trade OpportunityIf you want to make it big really fast, there is still one last chance to get ETHUSDT with a great entry price and high lev.
The chart setup is good. The market is good and everything is great.
Market conditions are only improving and the Altcoins are starting to heat up.
Right now, you see $1,600 but tomorrow the price can be $1,800 or more, that's how the Altcoins work. One day everything is quiet, the next day everything blows up. By the time the action is in, it is too late to buy, but not now, there is still one final chance to get bottom prices before the 2025 bull market shows up in full force.
Here is Ethereum, ETHUSDT, a great chart setup. Once the breakout happens, it will never trade at this price ever again. This is the last chance. It is yours to take.
Thanks a lot for your continued support.
I am wishing you profits, health, wealth and success.
You are appreciated, always, and you deserve the best.
Namaste.

Ethereum 6X Lev. Full PREMIUM Trade-Numbers —2nd Entry—PP: 1806%This is a second entry for a long-term leveraged chart setup for ETHUSDT (Ether).
This is truly the last chance to get Ethereum at low prices before a major bullish impulse, the biggest one in a long time.
The chart structure is perfect. The low conditions look very similar to June 2022, very similar.
We have long-term higher lows blah blah blah... By now, you already know all these things as I read this chart a million times.
I don't have much to say other than remain calm, whatever happens. Sleep easy because Crypto is going up. It is as simple as that. It will grow, soon.
Full trade-numbers below:
_____
LONG ETHUSDT
Leverage: 6X
Entry levels:
1) $1,900
2) $1,825
3) $1,630
Targets:
1) $2,125
2) $2,405
3) $3,347
4) $4,017
5) $4,871
6) $6,000
7) $7,337
Stop-loss:
Close weekly below $1,600
Potential profits: 1806%
Capital allocation: 3%
_____
I would like to thank you again for reading. Your support is appreciated.
I know it is a lot of content but this is meant for many different people all across the world.
If you like what you see make sure to follow.
If you want to see more, leave a comment and boost to show your support.
This is the big one.
Namaste.

ETHUSD - Consolidation Zone Analysis | Watch $2700 Breakout📊 Ethereum (ETHUSD) is currently trading within a consolidation zone between key support at $2458 and resistance near $2720 on the 1H timeframe.
🔹 Breakout above $2700 could indicate potential bullish momentum continuation.
🔻 Breakdown below $2450 may suggest bearish sentiment gaining control.
The price has been moving sideways, showing indecision and reduced volatility. Traders often monitor such range-bound phases for potential breakout opportunities in either direction.
⚠ This chart is for educational and analytical purposes only. It is not financial advice. Always do your own research and risk management.
---
🔖 Key Levels:
• Resistance: $2720
• Support: $2458
• Bearish zone under: $2500
#ETHUSD #Ethereum #CryptoAnalysis #TechnicalAnalysis #TradingView #PriceAction

Your are not Bullish enough on ETHExperts foresee Ethereum’s future mirroring that of early Amazon and Microsoft, predicting significant growth.
Analysts draw parallels between Ethereum (ETH) and major tech companies such as Amazon and Tesla, indicating that it could be a high-growth asset moving forward.
Even though ETH has experienced a recent decline, several analysts point out the increasing interest from institutional investors, with substantial holders actively accumulating.
The long-term prospects of Ethereum are linked to its innovative capabilities and established reputation, with its security-oriented strategy echoing Amazon’s approach to growth.
The analyst pointed out that this is a pivotal moment to "front-run" Ethereum's potential supremacy in the blockchain arena. He emphasized that Ethereum is set apart by its ongoing innovation; however, instead of focusing on immediate user expansion, the network has prioritized security. This dedication to dependability has established Ethereum as the most reliable settlement layer in the sector.
Please refrain from analyzing ETH as if it were Procter & Gamble. Acquiring ETH is more akin to investing in a high-growth stock like AMZN, MSFT, or TSLA from decades past.
Ethereum's approach to enhancing the dominance of the EVM could be compared to Amazon.
This chart comparing ETH prices to Tesla's stock price indicates a parallel trend of growth and dominance.
Make no mistake, I am quite optimistic about Tesla's prospects through 2030.
But this ongoing head and shoulders pattern implies that as we move into the Crypto Banana zone, ETH will accelerate and potentially surpass Tesla's market cap.

UNI. Movement.You can call it sideways movement or a movement in a global ascending channel - imo, both options will be valid for BME:UNI you can expect 60% up move - to the middle of the channel

ETH/USDT At A Premium — What’s Next? Smart Entry Strategy!I'm currently analyzing ETH/USDT 🧠💹 — Ethereum has been in a strong bullish trend, recently pushing into all-time highs 🚀🔝. While the momentum remains intact, price is now trading at a premium 🏷️, and I’m cautious about entering long at these elevated levels ⚠️.
In the video, we break down the trend, market structure, and price action with precision 📊🧱. I also explore potential entry scenarios that align with low-risk, high-probability setups 🎯🔍 — ideal for those waiting for the right moment to engage without chasing the move.
You'll also get a deep dive into my Trend Continuation Strategy 🔄📈 — a powerful framework for identifying smart entries in trending markets.
🛑 This is not financial advice

ETHBTC Exiting the consolidationETHBTC breaks above the consolidation range. No real Resistance ahead.
Check out ETHUSDt chart also

Ethereum - The bottom is finally in!Ethereum - CRYPTO:ETHUSD - is starting the rally:
(click chart above to see the in depth analysis👆🏻)
Finally, after dropping an expected -65% over the past couple of months, Ethereum is retesting and already rejecting a significant horizontal structure. Together with the strong confluence of support, Ethereum is now creating a long term bottom, initiating the next bullish cycle.
Levels to watch: $2.000, $4.000
Keep your long term vision!
Philip (BasicTrading)

Ethereum Is Nearing an Important SupportHey Traders, in today's trading session we are monitoring ETH/USDT for a buying opportunity around 2,435 zone, Ethereum is trading in an uptrend and currently is in a correction phase in which it is approaching the trend at 2,435 support and resistance area.
Trade safe, Joe.

ETHBTC | Blue Boxes Holding, Market Shift BrewingETHBTC is quietly building strength. The blue boxes below have held well as demand zones, and recent reactions hint that buyers are stepping back in.
CDV is starting to shift, and we’re seeing early signs of accumulation. No breakout yet, but the structure suggests the market may be preparing for one.
A clean push above local range highs with volume would confirm the shift. Until then, patience pays.
📌I keep my charts clean and simple because I believe clarity leads to better decisions.
📌My approach is built on years of experience and a solid track record. I don’t claim to know it all but I’m confident in my ability to spot high-probability setups.
📌If you would like to learn how to use the heatmap, cumulative volume delta and volume footprint techniques that I use below to determine very accurate demand regions, you can send me a private message. I help anyone who wants it completely free of charge.
🔑I have a long list of my proven technique below:
🎯 ZENUSDT.P: Patience & Profitability | %230 Reaction from the Sniper Entry
🐶 DOGEUSDT.P: Next Move
🎨 RENDERUSDT.P: Opportunity of the Month
💎 ETHUSDT.P: Where to Retrace
🟢 BNBUSDT.P: Potential Surge
📊 BTC Dominance: Reaction Zone
🌊 WAVESUSDT.P: Demand Zone Potential
🟣 UNIUSDT.P: Long-Term Trade
🔵 XRPUSDT.P: Entry Zones
🔗 LINKUSDT.P: Follow The River
📈 BTCUSDT.P: Two Key Demand Zones
🟩 POLUSDT: Bullish Momentum
🌟 PENDLEUSDT.P: Where Opportunity Meets Precision
🔥 BTCUSDT.P: Liquidation of Highly Leveraged Longs
🌊 SOLUSDT.P: SOL's Dip - Your Opportunity
🐸 1000PEPEUSDT.P: Prime Bounce Zone Unlocked
🚀 ETHUSDT.P: Set to Explode - Don't Miss This Game Changer
🤖 IQUSDT: Smart Plan
⚡️ PONDUSDT: A Trade Not Taken Is Better Than a Losing One
💼 STMXUSDT: 2 Buying Areas
🐢 TURBOUSDT: Buy Zones and Buyer Presence
🌍 ICPUSDT.P: Massive Upside Potential | Check the Trade Update For Seeing Results
🟠 IDEXUSDT: Spot Buy Area | %26 Profit if You Trade with MSB
📌 USUALUSDT: Buyers Are Active + %70 Profit in Total
🌟 FORTHUSDT: Sniper Entry +%26 Reaction
🐳 QKCUSDT: Sniper Entry +%57 Reaction
📊 BTC.D: Retest of Key Area Highly Likely
📊 XNOUSDT %80 Reaction with a Simple Blue Box!
📊 BELUSDT Amazing %120 Reaction!
📊 Simple Red Box, Extraordinary Results
📊 TIAUSDT | Still No Buyers—Maintaining a Bearish Outlook
📊 OGNUSDT | One of Today’s Highest Volume Gainers – +32.44%
I stopped adding to the list because it's kinda tiring to add 5-10 charts in every move but you can check my profile and see that it goes on..

ETH 2025: $3000 is Key to Escaping Ethereum's Consolidation TrapEthereum (ETH) May Remain Consolidated Throughout 2025 if it Fails to Hit $3000: Here’s Why!
May 27, 2025 – Ethereum (ETH), the world's second-largest cryptocurrency, finds itself at a critical juncture. After a period of significant volatility and notable gains, ETH's price has entered a prolonged consolidation phase. While numerous bullish signals point towards a potential surge, a formidable barrier stands at the $3000 mark. Failure to decisively conquer this level could see Ethereum locked in a sideways trading pattern throughout much of 2025, deferring hopes of a new explosive bull run. This article delves into the intricate factors dictating Ethereum's price trajectory, exploring the tug-of-war between bullish aspirations and the stubborn realities of market resistance.
Section 1: The Current State of Ethereum - A Prolonged Consolidation
As of late May 2025, Ethereum continues to trade within a defined range, struggling to make a sustained break in either direction. The price has been attempting to pierce pivotal resistance zones, with recent attempts this month failing to hold despite decent volume. Some market observers note that Ethereum is currently consolidating between the $2,400 and $2,750 range. This period of consolidation is not unusual in cryptocurrency markets, often representing a "breather" after significant price movements or a period of price discovery as market participants digest new information and sentiment.
Historical chart patterns suggest that Ethereum may have entered a crucial price range, an "accumulation zone," which could prevent a significant breakout for several months. Certain technical indicators, which help identify trends when growth rates fluctuate, show ETH price entering bands that have historically preceded consolidation periods, sometimes lasting nearly a year, before the next major bullish wave. Given that ETH has already consolidated for approximately four months, another similar period could be on the horizon if key resistance levels are not breached.
This consolidation is a focal point for investors and analysts alike. On one hand, it can be seen as a period of building strength before the next upward move. On the other, prolonged consolidation can lead to investor fatigue and a potential drift lower if bullish catalysts fail to materialize. The market is currently in a state of anticipation, closely watching for signals that could indicate the end of this sideways movement. Ethereum's price is currently hovering in the mid-$2,500s, recovering slightly after brief consolidation and respecting key support levels.
Section 2: The $3000 Hurdle - A Critical Inflection Point
The $3000 level for Ethereum is more than just a number; it represents a significant psychological and technical barrier. A decisive break above this level would likely instill strong bullish sentiment, potentially paving the way for further gains towards previous highs and beyond. Conversely, a repeated failure to surmount $3000 could confirm the strength of the resistance, leading to a loss of upward momentum and an extended period of consolidation throughout 2025.
Market sentiment often coalesces around such round numbers. A breakthrough can trigger a fear of missing out, attracting fresh capital. Failure, however, can lead to disappointment and profit-taking, reinforcing the consolidation range. As of May 2025, ETH is expected by some to trade between $2,400 and $2,900, with a monthly close above $2,750 strengthening the case for retesting $3,000 in the coming quarter. Some projections suggest ETH might hover near the $3000 resistance in the summer months, potentially seeing profit-taking before a new range is established. If ETH fails to rise above the ascending trend line it has held since mid-2022, and with technicals like a potential bearish "Death Cross" (where a shorter-term moving average crosses below a longer-term moving average on weekly charts), the price could remain restricted below $2500 for a while, making the $3000 target even more challenging in the near term.
Section 3: Bullish Signals Amidst Consolidation - The Hope for a Breakout
Despite the consolidation, several bullish signals offer hope for an eventual breakout and a more dynamic 2025 for Ethereum.
Altseason Hopes
The term "altseason" refers to a market phase where alternative cryptocurrencies (altcoins) experience significant price surges, often outperforming Bitcoin. Ethereum, as the leading altcoin, plays a crucial role in signaling or even triggering such a season.
Recent technical analysis suggests that Ethereum has reclaimed a key technical level – the mid-line of a significant channel indicator on the two-week chart. This moving average-based band tracks long-term momentum. Historically, closing above this mid-line has preceded sharp price gains for ETH and marked the start of altseasons. For instance, after surpassing this mid-line in 2020-2021, ETH rallied dramatically. A similar pattern in late 2023 saw ETH climb significantly within a year. As of May 2025, the upper band of this channel represents the next significant resistance. A breakout above this could target previous cycle highs.
The impact on the broader altcoin market has also been historically significant. The combined market cap of altcoins (excluding ETH) surged considerably over a year after Ether's close above this channel's midline in past cycles. Some analysts suggest that ETH reaching certain key levels could signal the potential onset of an alt season.
Bitcoin Dominance and Altcoin Market Cap
The prospect of a 2025 altseason is further supported by patterns related to Bitcoin dominance – Bitcoin's market share of the total crypto market capitalization. Historically, after Bitcoin halvings, Bitcoin dominance tends to drop sharply, triggering altcoin rallies. This was observed in previous post-halving periods. With the latest halving in April 2024, a similar period is approaching, and a decline in Bitcoin dominance could occur within the next few months. If this trend repeats, some market observers anticipate the altcoin market cap could surge toward substantially higher figures. A falling Bitcoin dominance implies that capital is shifting from Bitcoin to altcoins, making them the market's primary focus.
Technical Formations
Several bullish technical patterns are currently visible on Ethereum's charts:
• Ascending Triangle: Ethereum's price action has been forming an ascending triangle pattern, characterized by a horizontal resistance level and a rising support line. This pattern typically indicates that buyers are gaining strength, pushing prices to higher lows against a flat resistance. A breakout above the horizontal resistance of this pattern could lead to a significant upward move.
• Inverse Head and Shoulders: Some analysts have identified an inverse head and shoulders pattern on daily trading charts, a classic bullish reversal pattern. The neckline of this pattern is cited around the $2,700 mark. A decisive close above this level could confirm the breakout, with an immediate target of $3,000.
• Bull Flag: On the daily chart, Ethereum appears to be forming a bull flag pattern, which is a bullish continuation pattern that typically follows a strong rally. The current sideways price action forms the flag, and a breakout could lead to a significant price increase.
• Bullish Market Structure: Despite the consolidation, the broader market structure for Ethereum can still be interpreted as bullish, with the potential for consecutive higher highs and higher lows to remain intact if key support levels hold. ETH trading above its key Exponential Moving Averages (EMAs) indicates a strong technical structure.
Analyst Sentiment
Market observers are cautiously optimistic, with many eyeing the $3,000 level as the next major milestone. Some predict that if Ethereum stays above $2,550, a breakout toward higher levels is likely in the near term. Holding above $2,500 is seen as crucial. If bullish momentum persists and broader crypto sentiment remains favorable, ETH could target the $4,000–$4,500 range later in 2025. Institutional interest, evidenced by spot Ether ETFs attracting inflows and Ethereum's growing market capitalization, also underpins a positive outlook.
Section 4: The Bearish Undertones - Risks and Fragility
Despite the array of bullish signals, Ethereum's path is not without significant obstacles and inherent fragilities.
Substantial Supply Near Cost Basis
A concerning factor highlighted by on-chain data is the substantial amount of Ethereum supply acquired near the current price levels. Analysis of blockchain data indicates that a very large volume of ETH supply, valued in the tens of billions of dollars, is near its cost basis and at risk of flipping into a loss if prices dip. This creates a precarious situation. If ETH's price were to fall below these investors' average acquisition price, it could trigger a wave of selling as holders try to minimize losses or break even. This sell-side pressure could exacerbate any downward trend or prolong the consolidation phase. There is also a significant cluster of investor cost-basis distribution around the $2,800 price level, implying potential sell-side pressure as ETH approaches this zone from investors looking to offload assets near breakeven.
Stubborn Resistance Levels
Ethereum is currently coiling under significant resistance. The $2,700 level has proven to be a formidable barrier, with ETH facing rejections multiple times in May. This level represents a key hurdle for bulls. Failure to convincingly break above $2,700, and subsequently $2,800 and the ultimate $3,000 target, could see selling pressure intensify. Each failed attempt can strengthen the perception of these levels as a ceiling, encouraging more traders to sell at these points.
Macroeconomic and Market-Wide Factors
The broader cryptocurrency market is susceptible to macroeconomic headwinds. Factors such as interest rate policies from central banks, regulatory developments, and global economic stability can significantly impact investor sentiment and capital flows into riskier assets like cryptocurrencies. While some anticipate potential interest rate cuts later in 2025 which could be bullish, ongoing quantitative tightening could pose a challenge. Bitcoin's dominance, while potentially set to fall, has also surged in early 2025, overshadowing altcoins for a period and reflecting a "risk-off" environment at times. Any negative shifts in these broader conditions could dampen Ethereum's breakout prospects, regardless of its specific technical or on-chain signals.
Section 5: Why Failure to Hit $3000 Could Mean Extended Consolidation in 2025
The $3000 mark is a critical psychological and technical threshold for Ethereum. Should the cryptocurrency fail to breach this level decisively in the coming months, several factors could contribute to an extended period of consolidation throughout 2025.
• Loss of Upward Momentum: A failure to achieve a widely anticipated price target like $3000 can significantly dampen investor enthusiasm. Bullish momentum is often self-reinforcing; when it stalls at a major resistance, the energy can dissipate, leading to a more cautious or bearish sentiment. Traders who bought in anticipation of a breakout might exit their positions, adding to selling pressure.
• Strengthening of Resistance: Each time a price level like $3000 (or even preceding levels like $2,700-$2,800) successfully repels an upward advance, it becomes a more established and psychologically potent resistance zone. More market participants will view it as a ceiling, placing sell orders around it, thus making future breakouts even more difficult.
• Capital Rotation: If Ethereum's price remains stagnant while other cryptocurrencies or asset classes show more promising returns, capital may flow out of ETH. Investors are constantly seeking the best risk-adjusted returns, and a prolonged consolidation in ETH could lead them to look for opportunities elsewhere in the dynamic crypto space or even in traditional markets.
• Investor Fatigue and Profit-Taking: Extended periods of sideways movement can lead to investor fatigue. Those who have been holding ETH through the consolidation might become impatient and decide to sell, either to lock in existing profits (if any) or to free up capital for other ventures. This is particularly true for the significant portion of supply bought near current price levels, where the desire to break even can lead to selling pressure if upward momentum wanes.
• Confirmation of Historical Patterns: As mentioned earlier, historical chart patterns suggest that Ethereum can enter extended consolidation phases before major bull runs. A failure to break $3000 would align with these historical precedents, suggesting that the market might indeed be settling in for a longer period of range-bound trading.
• Impact on "Altseason" Narrative: Ethereum's performance is often seen as a bellwether for the broader altcoin market. If ETH struggles to break key resistance and enter a clear uptrend, it could delay or diminish the prospects of a widespread "altseason," further contributing to a more subdued market environment for ETH itself.
Essentially, a failure at $3000 would signal that the current buying pressure is insufficient to overcome the selling interest at that level. This equilibrium could persist for an extended period, leading to the price oscillating within a defined range as bulls and bears remain in a deadlock. Until a significant catalyst emerges – be it a major network upgrade with immediate perceived value, a shift in macroeconomic conditions, or a surge in institutional demand that overwhelms sellers – Ethereum could find itself tracing a path of consolidation through 2025.
Section 6: Scenarios for 2025
Looking ahead, Ethereum's trajectory in 2025 largely hinges on its ability to overcome the current consolidation and the critical $3000 resistance. Several scenarios could unfold:
Scenario 1: Breaching $3000 and Igniting a Bull Run
This is the optimistic scenario favored by many ETH proponents.
• The Breakout: Ethereum successfully smashes through the $2,700-$2,800 resistance zone and then decisively conquers the $3000 psychological barrier. This breakout would likely be accompanied by a surge in trading volume, confirming strong buying interest.
• Targets: Once $3000 is overcome, analysts eye targets such as $3,200, $3,500-$3,600, and previous cycle highs around $4,100. Some even more bullish long-term predictions based on chart patterns suggest significantly higher targets if momentum is sustained.
• Altseason Trigger: A strong ETH rally, particularly one driven by reclaiming key technical levels, could indeed trigger a wider altseason. This would see significant capital flow into other altcoins, potentially leading to a massive altcoin market cap surge if Bitcoin dominance concurrently falls.
• Market Sentiment: Overall market sentiment would turn decisively bullish, fueled by positive price action and the realization of long-awaited breakouts. Institutional interest would likely further increase.
Scenario 2: Failure at $3000 and Continued Consolidation Throughout 2025
This scenario represents the central thesis of this article – a prolonged period of sideways trading.
• The Rejection: Ethereum makes attempts to break $3000 (or even struggles to consistently hold above $2700-$2800) but is repeatedly met with strong selling pressure. The price fails to establish a sustained uptrend above these key levels.
• Trading Range: ETH would likely continue to trade within a familiar range, potentially bounded by support levels around $2,300-$2,500 and resistance capping gains below $3000. This range could persist for a significant portion of 2025.
• Investor Sentiment: Investor sentiment would likely become mixed and potentially frustrated. While long-term believers might continue to accumulate, shorter-term traders could become disengaged due to a lack of volatility and clear direction. The "wait-and-see" approach would dominate.
• Impact on Altcoins: A stagnant Ethereum could dampen enthusiasm for a broad altseason, leading to more selective and narrative-driven gains in the altcoin market rather than a widespread euphoric rally.
Scenario 3: A Bearish Breakdown
While many signals are bullish or neutral (consolidating), a bearish breakdown remains a possibility, especially if broader market conditions deteriorate or if key supports fail.
• Support Failure: Key support levels, such as $2,450, $2,300, or even the psychological $2,000 mark, are breached decisively. This could be triggered by the large supply near cost basis flipping into loss and causing a cascade of selling.
• Negative Catalysts: This scenario could be exacerbated by negative macroeconomic news, stringent regulatory actions, or unforeseen issues within the Ethereum ecosystem.
• Price Action: A bearish breakdown would see Ethereum enter a downtrend, potentially revisiting lower support levels from previous market cycles. Technical indicators like a "Death Cross" on weekly charts, if confirmed, would add to bearish sentiment.
• Market Sentiment: Fear and uncertainty would grip the market, leading to a flight to safety, possibly increasing Bitcoin dominance or a move towards stablecoins.
•
The most probable outcome will depend on a confluence of technical breakouts, fundamental developments within the Ethereum ecosystem (like the impact of future upgrades), institutional adoption trends, and the overarching macroeconomic environment.
Section 7: Conclusion
Ethereum stands at a pivotal moment in May 2025. The allure of a significant rally towards $4,000 and beyond, potentially heralding a new altseason, is palpable, supported by historical precedents and bullish chart patterns. However, the path is fraught with challenges, most notably the formidable psychological and technical resistance clustered around the $2,700 to $3,000 levels.
The current consolidation phase, while potentially a healthy accumulation period, also carries the risk of morphing into prolonged stagnation if upward momentum cannot be decisively seized. The significant volume of ETH supply hovering near its cost basis presents a tangible threat, where a dip could trigger further selling pressure, reinforcing the consolidation or even leading to a decline.
Therefore, the central thesis holds considerable weight: should Ethereum fail to convincingly breach the $3000 mark in the coming months, it is highly plausible that the cryptocurrency could remain locked in a consolidative pattern for much of 2025. This would test the patience of investors and potentially delay the much-anticipated fireworks of a full-blown altseason.
The cryptocurrency market is notoriously dynamic and influenced by a myriad of unpredictable factors. While technical analysis and on-chain data provide valuable insights, they are not infallible crystal balls. Investors and traders must remain vigilant, continuously reassessing the evolving landscape, managing risk, and preparing for various potential outcomes as Ethereum navigates this critical juncture. The battle for $3000 will likely define ETH's narrative for the remainder of the year.

ETH(based on NEowave)I changed my analysis and I think Its better to consider eth in the middle of the running diamond diametrical.
stop loss of this analysis is 2400$.
