ETHUSD INTRADAY bullish trend supported at 2,360Trend Overview:
Ethereum (ETH/USD) remains in a bullish trend, underpinned by a sequence of higher lows and a well-defined rising structure. Recent intraday price action reflects a consolidation phase, likely forming a bullish continuation pattern within the prevailing uptrend.
Key Technical Levels:
Support: 2,360 (primary), followed by 2,160 and 2,090
Resistance: 2,750 (initial), then 2,930 and 3,130
Technical Outlook:
A corrective pullback toward 2,360, which aligns with a prior consolidation zone, may offer a buy-the-dip opportunity. A successful retest of this level could set the stage for a continuation toward 2,750, 2,930, and 3,130 over the medium to long term.
However, a confirmed break and daily close below 2,360 would invalidate the near-term bullish outlook, increasing the risk of a deeper correction toward 2,160 and 2,090.
Conclusion:
ETH/USD continues to show bullish momentum as long as it holds above the 2,360 support level. A rebound from this zone would likely confirm the ongoing consolidation as a base for further upside. A breakdown below 2,360, however, would shift the short-term bias bearish, exposing Ethereum to deeper downside risk.
This communication is for informational purposes only and should not be viewed as any form of recommendation as to a particular course of action or as investment advice. It is not intended as an offer or solicitation for the purchase or sale of any financial instrument or as an official confirmation of any transaction. Opinions, estimates and assumptions expressed herein are made as of the date of this communication and are subject to change without notice. This communication has been prepared based upon information, including market prices, data and other information, believed to be reliable; however, Trade Nation does not warrant its completeness or accuracy. All market prices and market data contained in or attached to this communication are indicative and subject to change without notice.
Ethereum (Cryptocurrency)


HolderStat┆ETHUSD wedge-breaker momentum runCRYPTOCAP:ETH — Monster breakout from a year-long falling wedge rocketed into a rising pennant; 2.55 k acts as dynamic trendline support. As long as bulls defend that level, upside extension toward the 2.95-3.1 k sell zone resistance looks probable. Lost support opens a dip to 2.25 k structural shelf before buyers regroup.

DeGRAM | ETHUSD kept the support📊 Technical Analysis
● ETH retested the old wedge roof (~2 450) and the new rising‑trendline in one touch, confirming them as support and printing a higher low.
● Price is climbing inside a fresh ascending channel; a mini bull‑flag above 2 600 targets the next horizontal resistance/supply at 2 886‑3 083.
💡 Fundamental Analysis
● CME Ether futures open‑interest topped $1.6 B while US spot‑ETH ETFs saw net inflows this week, signalling broader institutional accumulation as softer US CPI dents real yields.
✨ Summary
Confluent support at 2 450‑2 600 plus record futures/ETF demand back a tactical long: objectives 2 886 → 3 083; manage risk on a 16 h close below 2 450.
-------------------
Share your opinion in the comments and support the idea with like. Thanks for your support!

ETH Continues Bullish Momentum Above Broken TrendlineHello guys!
Ethereum has shown a strong bullish rally, breaking through a long-standing descending trendline with significant momentum. Currently, price action is consolidating above the broken trendline, which may now act as a support zone.
🔹 Scenario 1 (Bullish Continuation): If ETH holds above the current range and confirms the broken trendline as support, we could see a continuation toward higher resistance levels around $3,500 and beyond.
🔹 Scenario 2 (Deeper Retest): Alternatively, a pullback toward the $2,200–$2,300 area (highlighted zone) could offer a better accumulation point before the next bullish leg resumes.
This setup suggests that as long as ETH remains above the key support levels, the bullish structure remains intact.

ALTCOIN ROADMAP: REVISITED!!! Ethereum vs NvidiaOne of the most insightful ratio charts that provides a remarkable glimpse into the vitality of Altcoins and the appetite for risk is when Ethereum outshines one of the fastest rising stars in the stock market, #NVDA!
The conventional Altcoin index indicates how many of the top 100 Altcoins are outperforming #BTC.
This is indeed a valuable metric that we can rely on for identifying peaks.
However, I believe that if we broaden our perspective and examine the ETH ratio against a Tech Titan, we can truly pinpoint the timing of the banana zone. When it starts and when it is confirmed violent uptrend.
My interest in this ratio was sparked when ETH was still a proof of work coin, validated through GPUs; it seemed like a natural starting point to assess whether the ETH price was overvalued or undervalued.
Even after the transition to POS, I still think it’s worth analysing, as shown by the recent double bottom on the ratio!
The next crucial question is when we can break the multi-year downtrend to genuinely confirm the Banana zone. Because without ETH, there’s no party.
If we enter a big strong banana zone, I believe the ratio could swiftly trend towards 100, so we will be keeping a close eye on it!

Ethereum H4 | Approaching a swing-low supportEthereum (ETH/USD) is falling towards a swing-low support and could potentially bounce off this level to climb higher.
Buy entry is at 2,364.35 which is a swing-low support.
Stop loss is at 2,250.00 which is a level that lies underneath an overlap support.
Take profit is at 2,693.55 which is a multi-swing-high resistance.
High Risk Investment Warning
Trading Forex/CFDs on margin carries a high level of risk and may not be suitable for all investors. Leverage can work against you.
Stratos Markets Limited (tradu.com ):
CFDs are complex instruments and come with a high risk of losing money rapidly due to leverage. 63% of retail investor accounts lose money when trading CFDs with this provider. You should consider whether you understand how CFDs work and whether you can afford to take the high risk of losing your money.
Stratos Europe Ltd (tradu.com ):
CFDs are complex instruments and come with a high risk of losing money rapidly due to leverage. 63% of retail investor accounts lose money when trading CFDs with this provider. You should consider whether you understand how CFDs work and whether you can afford to take the high risk of losing your money.
Stratos Global LLC (tradu.com ):
Losses can exceed deposits.
Please be advised that the information presented on TradingView is provided to Tradu (‘Company’, ‘we’) by a third-party provider (‘TFA Global Pte Ltd’). Please be reminded that you are solely responsible for the trading decisions on your account. There is a very high degree of risk involved in trading. Any information and/or content is intended entirely for research, educational and informational purposes only and does not constitute investment or consultation advice or investment strategy. The information is not tailored to the investment needs of any specific person and therefore does not involve a consideration of any of the investment objectives, financial situation or needs of any viewer that may receive it. Kindly also note that past performance is not a reliable indicator of future results. Actual results may differ materially from those anticipated in forward-looking or past performance statements. We assume no liability as to the accuracy or completeness of any of the information and/or content provided herein and the Company cannot be held responsible for any omission, mistake nor for any loss or damage including without limitation to any loss of profit which may arise from reliance on any information supplied by TFA Global Pte Ltd.
The speaker(s) is neither an employee, agent nor representative of Tradu and is therefore acting independently. The opinions given are their own, constitute general market commentary, and do not constitute the opinion or advice of Tradu or any form of personal or investment advice. Tradu neither endorses nor guarantees offerings of third-party speakers, nor is Tradu responsible for the content, veracity or opinions of third-party speakers, presenters or participants.

Ethereum flagging out gives us a setup with good RRETH is forming a nice structure that looks like a nice flag on higher timeframes. Structures allow you to create setups that include valid risk management. There is a clear volume gap below that can present some weakness.
Full TA: Link in the BIO

Ethereum 4H - Wyckoff?It is always very difficult to understand the dynamics with fragmented volumes, where peaks almost always coincide with an abrupt move.
This is Ethereum on 4H, a position I am following, although I prefer larger timeframes.
I am not currently trading, but rather holding pending better times.
Remember to be careful, these are delicate and dangerous times, especially for those who are not so experienced.
You can copy the setup and follow it by yourself.

Ethereum Breaks Above MA200, Long-Term Bullish Cycle ConfirmedThe 5-May week marked not only a major advance and recovery above the August/September 2024 low prices, but it also signals a recovery for Ethereum above MA200 long-term, weekly timeframe.
This simple signal confirms that the bulls are in. But there is more.
After breaking above this level, Ethereum closed two additional weeks green above it, both times wicking lower but recovering. So this level has been conquered, retested and continues to hold. This means that we have at least 6 months of bullish action confirmed based on the chart, technical analysis.
There are also some great signals based on the long-term.
» RSI: The weekly RSI has a strong reading (bullish) and produced a major higher low compared to June 2022. This signal matches what happened at the end of the previous bearish cycle.
» MACD: The weekly MACD also produced a long-term higher low compared to July 2022 coupled with a bullish cross. This indicator is trending full-upwards and leaves no room for doubt. Ethereum is set to grow long-term. Let me show you the MACD...
What would you do if you knew, with a high level of certainty, that Ethereum will trade at $7,000 or higher this same year? How would you take action? How best to profit from this knowledge/information?
Namaste.

$ETH - Ethereum enters buy zoneHey traders!
How is your portfolio doing? Trump is shaking us!
After all these months in 2025 I've tried to project a new scenario (bullish/bearish) that clarifies our next outlook.
Not an easy job. As you see day by day, markets are in high volatility due to trade war and (not trying to be pesimistic) could be worse.
However, In my opinion Ethereum (and altcoin markets) are entering into a golden opportunity. that has to be taken 100%. Don't know where is the bottom for CRYPTOCAP:ETH on a short scenario. But, what I can certainly say is that won't fall as a stone for too long.
Ranges between 1400 - 2000 USD are gold prices to make progressives buys. Although it could fall even more ( 900 - 1200 USD) I think this is a high Risk reward buy.
But, timing is not on time. Shouldn't I sell, expecting a bear market( you know Halving and Posthalving ideas). Times have changed as the macro scenario has not been the same as the previous bullruns.
So, it's time to accumulate and expect a possible expansion cycle in 2026.. That could lead Ethereum to prices never seen before. Yes, the range between 8.000 - 15.000 USD.
As I always say. Just my opinion. Stay safe!

ETHUSD📊 1H Analysis – ETHUSD
Strategy: 🐊 Alligator Strategy
Trend: 📈 Strong Uptrend
📝 Trade Plan
🎯 Entry Point (EP): 2577
🛡️ Stop Loss (SL): 2514.76
💰 Take Profit 1 (TP1): 2645.46
🚀 Take Profit 2 (TP2): 2706.17
🔄 Execution:
Open two trades at the Entry Point (2577)
When TP1 hits, move SL to EP for the remaining trade
Let the second trade ride to TP2 or more

ETHUSD📊 1D Analysis – ETHUSD
Strategy: 🐊 Alligator Strategy
Trend: 📈 Strong Uptrend
📝 Trade Plan
🎯 Entry Point (EP): 2577
🛡️ Stop Loss (SL): 2514.76
💰 Take Profit 1 (TP1): 2645.46
🚀 Take Profit 2 (TP2): 2706.17
Open two trades When TP1 hits move your SL to Entry point for and ride TP2.

ETH/USD – Key Support Holding, Eyes on 3000 for Upside TargetEthereum is maintaining a strong bullish structure within a clearly defined ascending channel. Recent price action shows a successful retest of the lower channel boundary and the horizontal support zone around 2477 – 2450.
🔹 Support & Trendline Confluence:
The support zone at 2477–2450 is aligned with the lower boundary of the rising channel.
Multiple successful retests of this trendline indicate strong demand in this area.
🔹 Bullish Scenario:
As long as the 2477–2450 support zone holds, ETH/USD has a good chance to resume its upward move.
The next target for bulls is the 161.8% Fibonacci extension level at 2997.24, which coincides with the upper channel boundary.
📌 Plan:
Long positions are favored as long as price holds above 2450.
Targeting 2997, with intermediate steps of confirming higher lows.
📉 Invalidation:
A break and daily close below 2450 would invalidate this bullish scenario and suggest further downside.
This is a classic “buy-the-dip” scenario within an established uptrend, offering a favorable risk/reward opportunity.

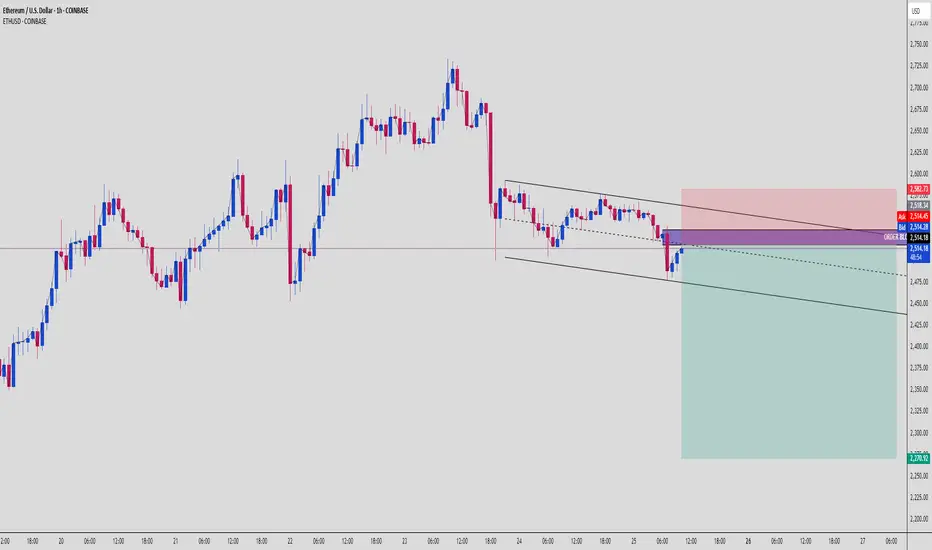
ETH Trap & Drop Setup – OB Rejection + Bearish Channel📉 Ethereum (ETHUSD) | 1H SMC Breakdown | Bearish Setup Explained
Another clean setup for the SMC gang. ETH just gave us a beautiful opportunity, respecting market structure, reacting to Order Block supply, and aiming to clean up sell-side liquidity. Let’s dive in 👇
🧱 1. Structure: Bearish Channel Formation
ETH has been moving in a tight bearish channel, producing:
Lower highs (confirmed supply zones)
Lower lows (liquidity grabs + structure breaks)
This shows consistent bearish pressure.
🧊 2. Premium OB Tap + Rejection Zone
Price just retraced into a Bearish Order Block sitting in the Premium zone, right around $2,514.
💥 OB zone is aligned with:
Upper channel resistance
Supply rejection
Clean inefficiency fill
Price wicked inside and immediately rejected = Smart Money active.
🧠 3. Retail Psychology Trap
Retail likely:
Longing support bounce
Placing stops under structure lows
Not respecting OB/imbalance narrative
Meanwhile, Smart Money:
Enters short from OB
Targets imbalanced zones
Eyes the $2,270 weak low
🎯 4. Liquidity Pool & Final Target
🔻 Target Zone: $2,270
This level is:
A weak low (high chance of being swept)
Sits at lower channel boundary
Acts as a liquidity magnet
Expect price to accelerate as it approaches this zone.
⚔️ 5. Trade Plan (Short Setup)
📍 Entry: $2,514 OB Zone
🔐 Stop Loss: Above $2,582 (structure break + OB invalidation)
🎯 Targets:
TP1: $2,460
TP2: $2,400
TP3: $2,270
⚖️ RRR: ~1:4+ – high precision trade
🧠 Key Concepts in Play:
Order Block Rejection
Premium Pricing Sell Setup
Bearish Channel Continuation
Liquidity Sweep Targeting
📌 Chart Summary:
"Don’t chase candles – follow the narrative. OB tells the story, liquidity gives the profit."
📚 Study the OB zone reaction. These setups repeat every week across assets if you know what to look for.
💬 Drop “ETH OB SNIPER” in the comments if this is your kind of entry.
📈 Tag a trader who needs to stop fading Smart Money moves!
SUSDTAfter forming a Diametric pattern and then correcting after that, the price is now ready to move to the specified range...

Eth to test 3800/4000 cadThis looks too good!
Coiling nicely buying momentum increasing at 3400/3500
Working perfectly for a breakout. I'm bullish to see 4500 right quick

Sideways Still in Play for ETH After RejectionIf you find this information inspiring/helpful, please consider a boost and follow! Any questions or comments, please leave a comment!
Recap
Ethereum just tapped into a key Area of Interest and got rejected. The move confirmed short-term resistance while keeping the broader wave structure intact. Although no clear breakdown has followed, the rejection signals that the asset is still mid-cycle.
The expectation now is for a sideways consolidation. This aligns with a developing wave 4, but the price action ahead will determine how this structure unfolds.
Wave Structure
At present, the count favors a completed wave 3 followed by a wave 4 that is still forming. The rejection at the AOI fits the narrative of a corrective structure underway. Whether that plays out as a triangle or a flat will depend on how the next legs print.
Key markers are in place:
AOI was respected
No breakdown of the prior key support level
Above the 0.382 to 0.5 retracement zone remains in focus as a reaction area
Should price expand beyond typical retrace/time boundaries, the degree of the count may need to be adjusted. A more complex correction or a deeper reset could shift the current interpretation from a wave 4 into something more substantial.
Outlook
• Rejection confirms resistance
• Expecting sideways movement to continue
• Watching the 0.382 to 0.5 zone for key price behavior
• Price action will determine the next wave structure
• If momentum expands rapidly, degree reassessment is on the table
Ethereum’s current posture suggests a market in digestion mode. Whether this leads to a launch into wave 5 or deeper corrective behavior, the next prints will be critical. No confirmation of bullish continuation yet.
More updates soon as the next leg develops.
Trade safe, trade smart, trade clarity.

ETH next move (maybe)The price has tapped into a Fair Value Gap and the price respected the trendline which maybe indicates a reversal

ETHUSDT at 2511: Breakout or Breakdown at 2550?Ethereum (ETHUSDT) is currently trading at 2511 on the 4-hour timeframe, sitting in a consolidation phase after a recent uptrend. Over the past few days, the price has shown resilience, bouncing off a key support level around 2400 and now testing a critical resistance at 2550. This 2550 level is a make-or-break point: a clean break above it could spark a bullish move toward 2700, while rejection here might send the price back to retest 2400. The broader market vibe is cautiously positive, with Ethereum’s upcoming upgrades generating some buzz, though regulatory uncertainties could weigh things down if negative headlines hit. Volume has been tapering off during this consolidation, which is normal, but keep an eye out, a breakout with strong volume will carry more weight.
From a technical standpoint, the 50-period moving average (MA) sits at 2450, and the 200-period MA is at 2300, with the price comfortably above both. That’s a solid bullish sign for now, but the 50-period MA is starting to flatten out, hinting that the upward steam might be cooling off. The Relative Strength Index (RSI) is at 60, right in the neutral zone, not overbought or oversold, so there’s room for the price to swing either way. Over on the MACD, the line is above the signal line, showing bullish momentum, but the histogram bars are shrinking, which could mean that momentum is losing some juice. Traders should watch for a breakout or a MACD crossover to get a clearer sense of what’s next.
There’s also a potential pattern taking shape: an ascending triangle, with the flat resistance at 2550 and a rising support line from 2400. This setup is typically bullish, but it’s not a done deal until we see a confirmed break above 2550. If that happens, especially with a volume spike, it’s a green light for bulls. On the flip side, if the price slips below 2400, it could signal a short-term bearish shift. For now, 2550 is the level to watch, it’s where the action will heat up. Whether you’re trading the breakout or the rejection, this is a spot to plan your moves carefully!

ETHUSD: The Market Is Looking Down! Short!
My dear friends,
Today we will analyse ETHUSD together☺️
The recent price action suggests a shift in mid-term momentum. A break below the current local range around 2,202.5 will confirm the new direction downwards with the target being the next key level of 2,489.5 and a reconvened placement of a stop-loss beyond the range.
❤️Sending you lots of Love and Hugs❤️

ETH Update: Pressed Between Key Levels on the Daily
ETH is currently pressed between the 200MA and the 50% Fibonacci level—two major areas of interest.
On May 14th, we saw a clear rejection at the 200MA, followed by solid support at the 50% Fib on May 18th-19th. 📉
MLR < SMA < BB Center isn't ideal, so we need to play it safe and let price do its thing. If we close above the BB Center and macro conditions support the move, we could see upside. 🌱
⚠️ Keep safe, follow for unbiased TA, and always manage risk! 📊

ETH - Trading at crucial resistance levelBINANCE:ETHUSDT (1W CHART) Technical Analysis Update
ETH is currently trading at $2500 range and the price is at crucial resistance zone, previously ETH had one if its largest crash after this support line was broken, now the same support line is acting as resistance.
50 EMA is also acting as a strong resistance in this are.
ETH needs to breaks this resistance to reach the next resistance around 4k USDT. if ETH cross 3K then 4k is an easy target.
Im expecting this resistance to break in next couple of weeks.
Short term target 3100
Mid Term Target 4000
Long Term Target 7000-9000a
a
aRemember to set your stop loss.
Follow our TradingView account for more technical analysis updates. | Like, share, and comment your thoughts.
Cheers
GreenCrypto
