ETH might be about to melt facesSentiment as negative as it could be, no real inflows for weeks - bottom sentiment? Check.
Sudden massive inflows? Check!
This is not a trade idea. If you trade this, be careful - who knows right now.
Ethereum (Cryptocurrency)

ETH (ethereum) – Massive Flag Pattern After 100% RunCRYPTOCAP:ETH – Bullish Flag After Monster Run
Ethereum ( CRYPTOCAP:ETH ) has nearly doubled since April, and now it’s cooling off — but in the best way possible: a bullish flag consolidation.
🔹 After a nearly 100% move, ETH has been consolidating tightly for two weeks — textbook flag behavior.
🔹 The trend remains strong, and this type of structure often leads to another leg higher.
🔹 Volume has tapered off during the flag — exactly what you want to see before a breakout.
Setup Overview:
Pattern: Large bull flag
Support/Risk: Defined risk to the $2500 zone
Measured Move Target: Breakout could push to $3100–$3500 based on the prior leg
Why I like this setup:
Healthy consolidation after a parabolic run
Risk/reward is favorable with structure and measured target
Potential breakout fuel from the ETH ETF narrative + BTC dominance rotation

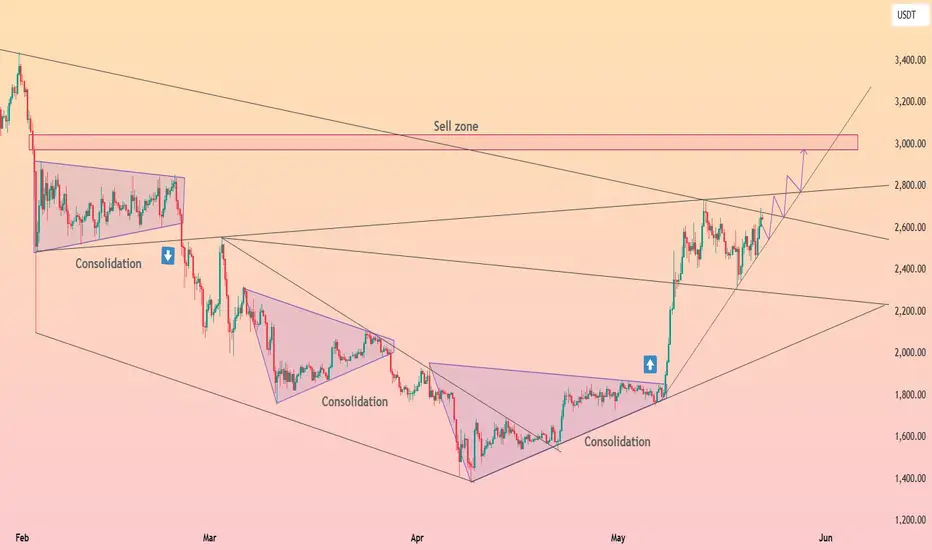
HolderStat┆ETHUSD pressing trend resistanceCRYPTOCAP:ETH blasted out of a mega-triangle, topping at 2.80 k, and keeps pressing along an aggressive rising trendline. Candles are marching through overlapping consolidations, each one springboarding higher; sustain footing above 2.55 k and the route to the 3.0-3.1 k sell zone stays paved. Slip back under 2.40 k and a broad retest of the prior wedge roof near 2.25 k awaits.
ETH — Bull Flag or Trap? Trade Plan with TargetsETH is setting the stage for its next major move — and the chart is packed with clues.
After completing Wave 3 at $2738.50, ETH has entered a corrective phase, forming what looks like a bullish flag. But beneath the surface, smart money levels are aligning: VWAP, Fibs, key levels, and liquidity traps are all converging around one high-probability zone.
This analysis breaks down both the long and short setups, backed by real confluence and clean R:R opportunities. Whether you’re planning to snipe the reversal near support or fade the rally at resistance, you’ll walk away with a clear trade plan and deeper insight into how price reacts at precision levels.
Let’s get into it.
🟢 Bullish Scenario: Long Setup with Deep Confluence
After a fakeout pump into the golden pocket of this minor downtrend (typical for a Sunday), ETH rejected cleanly at the upper resistance of the bull flag channel.
We're now watching for the swing low at $2406.63 to be swept, setting up a potential SFP (Swing Failure Pattern) at a highly confluent support zone:
🔍 Confluence at the $2390–$2360 Zone:
Anchored VWAP from the Wave 3 origin at $1752 is sitting at $2390
Trend-Based Fib Extension 1:1 of the correction lands at $2386.84
Liquidity pool just under the recent swing low
0.382 Fib retracement of the entire Wave 3 at $2361.66
0.618 Fib Speed Resistance Fan intersects this zone
Lower bull flag support line also aligns
This makes the $2390–$2362 zone a high-probability bounce area.
📌 Plan:
Laddered long entries between $2390–$2362, watching closely for a clean SFP or reversal signal.
Target 1: $3000 psychological level
Target 2: 0.618 Fib retracement at $3067.71 (potential Wave 5 top)
Stop-loss: Below previous yearly open (can be tightened after confirmation)
R:R: 1:5 or better after SL adjustment
🔴 Bearish Scenario: Short Setup at Key Rejection Zone
If ETH makes a move up to complete the 5th wave, we monitor $3067.71 — the 0.618 retracement of the entire corrective leg — as a key resistance.
If price rejects here with momentum loss or bearish structure:
📌 Plan:
Short on confirmed rejection of $3067.71
Stop-loss: Above $3211 (above 0.666 Fib)
Target: Previous high near $2700 or lower
R:R: 1:2 or better depending on entry and structure
🧠 Educational Insight: Why Confluence Increases Probability
Many traders chase setups based on single indicators. Real edge comes from stacking independent tools: VWAPs, Fibs, FVGs etc... When they align, the setup isn’t random — it’s high conviction.
This strategy gives you a framework to anticipate where price is likely to move and why, rather than reacting emotionally.
Patience and preparation will always outperform panic and reaction. Trade the plan — not the impulse.
___________________________________
If you found this helpful, leave a like and comment below! Got requests for the next technical analysis? Let me know.

ADA/USDT: Bullish Move Ahead ? (READ THE CAPTION)By examining the #Cardano chart on the 3-day timeframe, we can see that the price is currently trading around $0.80. If it holds above $0.71, we can expect more upside. The expected return for Cardano is around 30% in the short term, 47% in the medium term, and 85% in the long term.
Please support me with your likes and comments to motivate me to share more analysis with you and share your opinion about the possible trend of this chart with me !
Best Regards , Arman Shaban

ETH - BBB - Bullish Building Block!Hello TradingView Family / Fellow Traders. This is Richard, also known as theSignalyst.
🏢 ETH Building Blocks:
📈 Short-Term Bullish:
ETH is currently bullish trading within the second floor in the shape of a rising channel marked in green.
As ETH retests the lower green trendline and $2,550 structure, we’ll be looking for short-term trend-following long setups!
📈 Long-Term Bullish:
For the bulls to remain in control medium-term and push towards the $3,000 mark, a break above the last major high at $2,750 is needed.
📉 Short-Term Bearish:
If the $2,550 structure is broken downward, ETH's momentum will be shifted from bullish to bearish leading to a correction phase towards the $2,300 support.
📚 Always follow your trading plan regarding entry, risk management, and trade management.
Good luck!
All Strategies Are Good; If Managed Properly!
~Rich

Ethereum can get $9900 (23MAY2025)As Ethereum is playing inside a broadening pattern ( 2 blue zone )
1) Hold above the 20 weekly MA
2) Needs to break the $3000 trendline
3) Breaks above $4000 resistance
The target at $9900 is reachable in the coming months

Skeptic |Ethereum (ETH) Analysis: Altcoin Rally Ready to ExplodeHey everyone, Skeptic here! Did you see Bitcoin finally smash through the $107K resistance? Now, with BTC.D dropping, liquidity’s flowing back into altcoins like ETH , which could be gearing up for some wild rallies! 😊 Stick with me for a deep dive into Ethereum’s charts. Let’s start with the Daily Timeframe. 📊
Daily Timeframe: The Big Picture
After breaking the downward curve trendline, ETH has started a sustainable uptrend. Rising volume and Bitcoin’s rally confirm this move, so we can cautiously say the weekly major uptrend is regaining steam. This gets confirmed if we hold above the daily resistance at 2886.63 . Our spot trigger is a consolidation above 2886.63 , backed by increasing volume and momentum, plus a key condition: ETH/BTC needs to be in an uptrend.
Let’s take a quick peek at the ETH/BTC chart.
For a long time, ETH/BTC was in a sharp downtrend on the daily, but recently, it’s kicked off an uptrend momentum. A break above the 0.02588 resistance would confirm ETH/BTC’s uptrend, signaling it’s time to buy spot ETH. Until that break, I don’t recommend jumping in. Always confirm with ETH/BTC—otherwise, Bitcoin is the safer buy since, if ETH/BTC stays bearish, Bitcoin will likely outperform ETH.
4-Hour Timeframe: Long & Short Setups
Let’s zoom into the 4-hour timeframe for long and short triggers. For my long setup, I’ve already opened a position after the break of 2701.33 .
On the 15-minute timeframe, rising volume and RSI hitting overbought during the breakout gave solid confirmation. It looks like it’s pulling back to this level now, but there’s a chance it could be a fakeout. I’m letting it play out—if it hits my stop loss, no big deal; I’ve got risk management in place, and one stop won’t blow up my account :) For a short setup, a break below 2381.51 , coinciding with a break below ETH/BTC support at 0.02289 , could be your short trigger. But I don’t recommend it—the major uptrend is bullish, so shorting means going against the trend, which is risky.
💬 Let’s Talk!
If this analysis sparked some ideas, give it a quick boost—it really helps! 😊 Got a pair or setup you want me to dive into next? Drop it in the comments, and I’ll tackle it. Thanks for joining me—see you in the next one. Let's grow together! 🤍

Ethereum Late 2025 Targets Simplified —$7,331 & $11,318We are getting closer and closer to the bull run phase. We are getting closer to a period where the entire Cryptocurrency market will be extremely bullish. I wanted to simplified Ethereum's targets for you.
Having a long-term perspective can make your trading, your holding, much easier.
Imagine Ethereum goes to $4,500 and starts a strong retrace. As prices move up, you wouldn't feel compelled to sell, you would just be happy looking at the numbers on the screen and waiting for more. As soon as the correction comes, doubt can start to creep in. Should I sell now? Will it continue lower? Is this the end? How far down can it go?
We can plan ahead but the market impulse, the energy, the mass, the group, the herd, the news; things can shake us out of our hands, knowing in advance how high prices can really go, can make it easier for us to hold strong.
If Ethereum trades at $5,000 and stats to retrace, and you know that a minimum target of $7,300 is expected, then you can easily hold. But without this information it would be hard to do so when prices are down 30% from the top. The worst part is that we tend not to sell at the top, ignore the top and the impulse becomes really strong to sell when prices are low.
Ok. That's not the situation now. We bought early, we caught the bottom and it is the start of the bullish wave. Having 20 different targets can be as hard as having no targets, how much to sell and when?
So here are the targets simplified, these are the main targets for Ethereum in this upcoming bullish phase.
1) $3,345 ($3333). Easy target. Can be easily ignored. Resistance can change and instead of $3,345 it shows up at $4,015. Nobody cares, we are aiming higher.
2) The ATH. Ignore it will be broken.
3) $7,331. Now this will be a strong target and can even be the top, so this is one to watch out for. If the market reacts strong and there is huge bear volume, securing some profits wouldn't be a bad idea at this point, but there is more.
4) $11,318. This is full blown-bull market with major bullish force in place. If we get a great bull market, we can hit this target or even higher.
What I mean is that there is no point in selling at $3k, $4k or $5k. When the market shakes, ignore. When there is a retrace or correction, feel free buy-in, rebuy and reload.
Namaste.

ETH/USDT Potential UpsidesHey Traders. in today's trading session we are monitoring ETH/USDT for a buying opportunity around 2420 zone, Ethereum is trading in an uptrend and currently is in a correction phase in which it is approaching the trend at 2420 support and resistance area.
Trade safe, Joe.

ETHUSDT IDEAThings still looks inside a consolidation phase and some breaks upside or downside is needed for long momentum trades.

BTC - Why THIS TIME is DIFFERENT (⊙ˍ⊙)This time IS DIFFERENT. Bitcoin has made a new ATH as I predicted in a few previous posts, but something's off...🤔
If we look at BTC from a macro view, the dates for this run up was quite extended. We do see some similarities in terms of the retracement (highlighted in blue) but from a timeframe analysis, there is no comparing this high to the previous:
stretching from March to October where classical bear market symptoms were show - lower highs and lower lows, with a duration unlike any of the previous cycles.
Interestingly, the previous season we increased not even 7% from the previous peak. And if we were to look at the same fractal, that places us around $116k.
But the ONE thing, that has had me suspicious this entire time (🥁) was ETH. Overlaying the ETH chart, we see that historically, ETH peaked a week or two after the BTC ATH - until this time.
The fact that BTC made such a dramatic ATH and Ethereum didn't? That was a new one. And even up to now, ETH is still 80% away only from it's previous ATH - imagine the altseason we will have IF ETH makes a new ATH... or will this time just be , different ?

ETHUSD Break- Test- GO!!!This is a classic break-test go setup. What you want to see is a hook-down. What you don't want to see is push-back into the structure.
It's that simple.
Boost, like, follow, subscribe!

ETHUSD INTRADAY Bullish consolidation The ETH/USD pair maintains a bullish overall sentiment, underpinned by a sustained upward trend.
Key Levels:
Support: 2,190 (primary), followed by 2,123 and 2,046
Resistance: 2,625, with extended targets at 2,725 and 2,850
A corrective dip toward the key support zone at 2,190 could offer a bullish rebound opportunity. A successful bounce from this level would reinforce the uptrend and pave the way for a test of the 2,625 resistance. A breakout above this level may open the door to further gains toward 2,725 and 2,850 over the longer term.
Conversely, a decisive break and daily close below 2,190 would invalidate the bullish setup, potentially triggering a deeper pullback toward the 2,123 and 2,046 support levels.
Conclusion:
While the broader trend remains bullish, ETH/USD is currently consolidating. Traders should watch the 2,190 support closely—its defence may confirm trend continuation, while a breakdown could signal a short-term bearish reversal.
This communication is for informational purposes only and should not be viewed as any form of recommendation as to a particular course of action or as investment advice. It is not intended as an offer or solicitation for the purchase or sale of any financial instrument or as an official confirmation of any transaction. Opinions, estimates and assumptions expressed herein are made as of the date of this communication and are subject to change without notice. This communication has been prepared based upon information, including market prices, data and other information, believed to be reliable; however, Trade Nation does not warrant its completeness or accuracy. All market prices and market data contained in or attached to this communication are indicative and subject to change without notice.

ETHUSD - Strong Move UpLooking at past price movement for ETH this area shows a strong upward movement which probably will repeat
Very bullish time for altcoins especially after BTCUSD finishes its run
Lets go


ADAUSDT WeeklyLet's see the chart on higher timeframes a bit also for once. Let us examine the bigger levels and bigger picture.

$ETH / $BTC Inverse Head and Shoulders Confirmed! NGL pretty much every chart i'm looking at rn looks crazy bullish 🐂
Inverse Head and Shoulder confirmed on ETH / BTC 🤯
The real test comes at the 200DMA as CRYPTOCAP:ETH has not traded above it in the past 307 days.

Don't Miss This Big Move on COSMOS (ATOMUSDT)Hello Everyone!
With Bitcoin on the rise and Ethereum likely to follow—as outlined in my recent ETHEREUM analysis idea —we continue to look for strong opportunities in the altcoin market. Right now, all eyes are on COSMOS ( BINANCE:ATOMUSDT ) as it shows promising signs of a potential breakout.
On Weekly timeframe
Price has swept the bottom of September 2024 liquidity zone.
On 4D timeframe
- On the OBV (On-Balance Volume) indicator , price has broken a downtrend—similar to the breakout seen in October 2024 , which was followed by a 170% rally.
- The previous 4-day candle closed above a key Fair Value Gap (FVG), indicating potential bullish momentum.
On 1D timeframe
- V shape inverse pattern.
- There’s significant liquidity in the $6.5–$7.5 range . After successfully breaking above the $5.1 level —just as I strongly anticipated—price is now likely targeting that liquidity zone.
To sum up, BINANCE:ATOMUSDT is demonstrating both fundamental strength and technical confirmation, making it a high-potential candidate in the current market environment.

Caught the pivots up, now what?If you find this information inspiring/helpful, please consider a boost and follow! Any questions or comments, please leave a comment!
After catching the directional turn and key pivot level ahead of the recent move, Ethereum delivered the reaction we were anticipating. But what comes next?
The current W2 corrective structure isn’t textbook, so what do we do?
At this stage, we’re anchoring our analysis off the Wave 3 price action, which likely completed before the latest correction. That sets us up to track a potential Wave 4 development.
Here’s what’s still on the table:
We have a sideways style W2
For a wave 4, based off of alternation, we should be looking for a:
A sharp zigzag
Or a contracting triangle coiling up for the next breakout
Key Level to Watch:
👉 A clean break below 2159 would invalidate the more bullish interpretations and open the door to deeper corrective action. ⚠️
Until then, staying patient and letting the structure develop will be key.
Trade safe, trade smart, trade clarity.

Going Short on EthereumBINANCE:ETHUSDT
Ethereum has moved up strongly in the last 6 weeks to a key resistance level, which is the 50% Fibonacci Retracement, leaving a huge Fair Value Gap between the $2,400 USDT and the $1,900 USDT level. Most Fair Value Gaps get filled, and I expect it to be the case this time. The Gap closes at around $1,900 USDT.
I also see this move overextended in the short term and do for a correction, so I am going short here.
I hope you find this interesting.
Good luck to you

BTC on the Move — Will ETH Join the Rally?Hello everyone!
Bitcoin is on the rise, targeting the liquidity zone above $110,000 . This brings up a key question: Will BINANCE:ETHUSDT follow with a rally of its own?
In this idea, I’ll analyze the current ETHUSDT setup and highlight the key levels to watch for a potential breakout.
ETHUSDT on 4H timeframe
- The previous 4H candle closed above $2,553 , which is a strong bullish signal, as this level has previously acted as firm resistance with multiple rejections.
In my view, ETH is now targeting the liquidity at the top of the falling wedge around $2,738.
If this level is successfully swept, the next likely target is $2,878, where a significant amount of liquidity sits above this swing high.
- If a quick pullback occurs, there is strong demand in the $2,338–$2,311 range , which could serve as a solid support zone. However, in my opinion, this scenario is less likely to play out at the moment .
In conclusion, ETH is well-positioned for a continuation if market conditions remain favorable.

ETH - This will take time Part IIAs previously outlined, the fourth wave of the Primary degree in Ethereum (ETH) is forming a large triangle pattern, consistent with the corrective structure observed in XRP. This pattern is likely to extend over time, with the fifth wave of the Primary degree expected to begin around November or December 2025. A potential sharp breakout could occur starting in February 2026, signaling the start of a significant bullish move. If this breakout materializes, ETH could experience a substantial price increase, potentially exceeding current expectations, with a target significantly higher than anticipated.
