Ethereum: The Bullish Cycle Starts Now!The minimum new 2025 All-Time High for Ethereum is $5,794. The next target sits at ~$8,500.
Ethereum took some time out and used this week to challenge resistance. Resistance was found at 0.5 Fib extension with exactitude, that is, $2,746.
Two supports mainly: 1) $2,424 and 2) $2,026.
The bottom is in and it is really far away. The $2,026 is the 0.236 Fib extension and also the baseline of the rounded bottom pattern.
The correction low sits at $1,383 and Ethereum (ETHUSD) will never ever in its entire history trade at this price ever again. It is gone forever. Right now it is still relatively early but this will be more obvious as the month reaches its end.
Good evening my fellow Cryptocurrency trader, I hope you are having a nice Sunday and the week is about to close.
Ethereum is still early, early in its trading session based on the long-term bullish cycle, and I say this based on market data and the chart. Not my speculative opinion.
This is the biggest exchange in the list, it comes up first.
Exchanges are listed by volume when you look up a pair here on TradingView.
It turns out that trading volume is still low but prices are going up. This is what tells me that it is still early, wave 1. When the action gets going and bullish momentum grows, volume will reach its highest; wave 3. Then the action will continue and will go crazy but volume won't keep up; wave 5.
I say the minimum is $5,794 and this is an easy target. Can go higher, much higher but 5.8K is an easy bet.
Go LONG hold spot trade options do what it takes.
Buy the funds, the ETFs, the actual coins holding or staking it doesn't matter as long as you participate. Even with stablecoins through DYDX or whatever way you prefer. As long as you participate in this awesome market the market will reward you.
Thank you for reading.
Namaste.
Ethereum (Cryptocurrency)

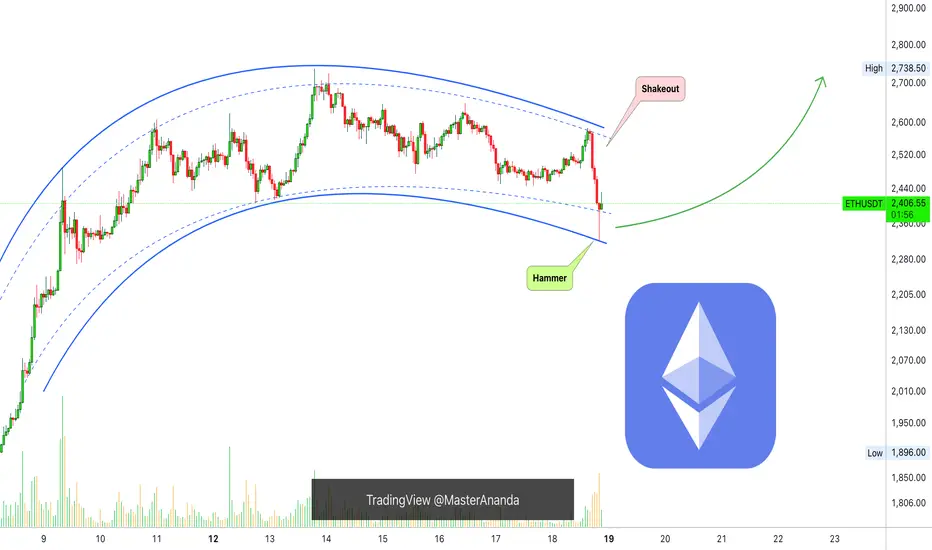
Ethereum Short-Term, Bullish Or Bearish?Notice this recent shakeout on the chart, this is a major move and surely removes lots of over leveraged positions. It also traps the bears, a bear-trap.
If this move continued lower it would be bad news but the 1H candle ended with a long lower wick, producing a hammer which is a reversal signal. This candle produced the lowest price since 9-May, 9 days ago, and the current candle is green, this tells us that a shakeout is confirmed.
The bearish move is a failed signal so the next move is up. With a very small bullish continuation, the current candle closing at current price or higher, it is confirmed ETHUSDT to continue rising.
(If the current candle were to close red and lower this would be a bearish confirmation.)
Short-term bullish structure intact. It is normal to see the market shaking before a major move. Remember, Bitcoin is about to close its 6th consecutive week green, the most bullish development of the decade. This affects Ethereum of course and the entire Cryptocurrency market.
Namaste.
ETHUSD: Strong Growth Ahead! Long!
My dear friends,
Today we will analyse ETHUSD together☺️
The price is near a wide key level
and the pair is approaching a significant decision level of 2,566.3 Therefore, a strong bullish reaction here could determine the next move up.We will watch for a confirmation candle, and then target the next key level of 2,601.4.Recommend Stop-loss is beyond the current level.
❤️Sending you lots of Love and Hugs❤️

SEI breaks the downtrend targets 30cThe SEI network is currently displaying positive price movement after recently breaking out of a downward trend channel that had been in place since the peak on December 5th. On the daily chart, it has been trading sideways within the upper channel, indicating a potential retest of that breakout. However, the momentum isn't particularly strong, especially since Ethereum, the frontrunner in the altcoin resurgence, isn't exhibiting explosive upward movement either.
Should the situation shift and Ethereum regain its leading position, I believe that many struggling smart contract platforms, which have seen their prices plummet by over 80%, could also experience a robust recovery.
If Ethereum manages to climb back into the $2,000+ range, I anticipate that SEI will reach its target on the chart, which is approximately 30 cents.

Ethereum Approaching Key Resistance – Breakout or Rejection?Ethereum ( CRYPTOCAP:ETH ) has been on a strong upward trend since bouncing from the $1500 zone, and it’s currently trading around $2372. All eyes are now on the next major resistance area between $2600 and $2900.
So what’s next—breakout or pullback?
If ETH can push through this resistance with strong momentum and volume, we could see a continuation toward $3000 and beyond.
A rejection from this level could lead to a dip back toward the $1900–$1700 support range.
My Take: The trend is bullish, but this resistance zone is a key test. A strong close above $2900 would confirm a breakout. Until then, caution and close observation are crucial.
What do you think? Will ETH break through or bounce down from here?
Share your thoughts below!
Kindly support this idea with a LIKE👍 if you find it useful🥳
Happy Trading💰🥳🤗

ETHUSD Is Bullish! Long!
Here is our detailed technical review for ETHUSD.
Time Frame: 9h
Current Trend: Bullish
Sentiment: Oversold (based on 7-period RSI)
Forecast: Bullish
The market is approaching a significant support area 2,593.04.
The underlined horizontal cluster clearly indicates a highly probable bullish movement with target 2,920.18 level.
P.S
The term oversold refers to a condition where an asset has traded lower in price and has the potential for a price bounce.
Overbought refers to market scenarios where the instrument is traded considerably higher than its fair value. Overvaluation is caused by market sentiments when there is positive news.
Disclosure: I am part of Trade Nation's Influencer program and receive a monthly fee for using their TradingView charts in my analysis.
Like and subscribe and comment my ideas if you enjoy them!

ETHUSD - Support Line Reestablished A major support line has been recovered on this ETH daily chart
One that previously led to a strong breakout
From here price will find support on this line and then pop off again
Good time to buy ETHUSD
Daily chart

ETH/USDT – First Support in the Blue BoxETH has been slowing down after its latest push, and the first real area to watch is that blue box below price. It’s where buyers will likely step back in, and a clean reaction there could spark a bigger move—especially if ETH/BTC starts to turn higher at the same time.
What you need before pulling the trigger
• A volume surge that outstrips the prior pullback and aligns with a bullish CDV divergence
• A quick break under the blue box on your one- or five-minute chart followed by a fast reclaim, showing order flow flipped to the buy side
• Genuine buying pressure, not just a wick into the zone
“If the levels suddenly break upwards and do not give a downward break in the low time frame, I will not evaluate it. If they break upwards with volume and give a retest, I will look long.”
Jumping in without those confirmations is the easiest way to get shaken out. But if ETH dips into that box, lights up on volume and CDV, and then retests cleanly on the low timeframe, that’s your signal. With ETH/BTC potentially gearing up to rise too, a solid bounce here could turn into something you don’t want to miss.
📌I keep my charts clean and simple because I believe clarity leads to better decisions.
📌My approach is built on years of experience and a solid track record. I don’t claim to know it all but I’m confident in my ability to spot high-probability setups.
📌If you would like to learn how to use the heatmap, cumulative volume delta and volume footprint techniques that I use below to determine very accurate demand regions, you can send me a private message. I help anyone who wants it completely free of charge.
🔑I have a long list of my proven technique below:
🎯 ZENUSDT.P: Patience & Profitability | %230 Reaction from the Sniper Entry
🐶 DOGEUSDT.P: Next Move
🎨 RENDERUSDT.P: Opportunity of the Month
💎 ETHUSDT.P: Where to Retrace
🟢 BNBUSDT.P: Potential Surge
📊 BTC Dominance: Reaction Zone
🌊 WAVESUSDT.P: Demand Zone Potential
🟣 UNIUSDT.P: Long-Term Trade
🔵 XRPUSDT.P: Entry Zones
🔗 LINKUSDT.P: Follow The River
📈 BTCUSDT.P: Two Key Demand Zones
🟩 POLUSDT: Bullish Momentum
🌟 PENDLEUSDT.P: Where Opportunity Meets Precision
🔥 BTCUSDT.P: Liquidation of Highly Leveraged Longs
🌊 SOLUSDT.P: SOL's Dip - Your Opportunity
🐸 1000PEPEUSDT.P: Prime Bounce Zone Unlocked
🚀 ETHUSDT.P: Set to Explode - Don't Miss This Game Changer
🤖 IQUSDT: Smart Plan
⚡️ PONDUSDT: A Trade Not Taken Is Better Than a Losing One
💼 STMXUSDT: 2 Buying Areas
🐢 TURBOUSDT: Buy Zones and Buyer Presence
🌍 ICPUSDT.P: Massive Upside Potential | Check the Trade Update For Seeing Results
🟠 IDEXUSDT: Spot Buy Area | %26 Profit if You Trade with MSB
📌 USUALUSDT: Buyers Are Active + %70 Profit in Total
🌟 FORTHUSDT: Sniper Entry +%26 Reaction
🐳 QKCUSDT: Sniper Entry +%57 Reaction
📊 BTC.D: Retest of Key Area Highly Likely
📊 XNOUSDT %80 Reaction with a Simple Blue Box!
📊 BELUSDT Amazing %120 Reaction!
📊 Simple Red Box, Extraordinary Results
I stopped adding to the list because it's kinda tiring to add 5-10 charts in every move but you can check my profile and see that it goes on..

ETHBTC Is it repeating its first Cycle?I know that the timeframes are not the same but don't tell me that the structure between then and now isn't similar.
The biggest difference is that in 2016 ETHBTC made a deeper low than now, but the current rebound is showing signs that we might have a similar parabolic rise.
Now will that be enough to give a new All Time High?
We will see, but don't tell me that this can't target 0.0900 byu the end of the year.
Follow us, like the idea and leave a comment below!!

Ethereum is Approaching an Important Support Zone!!Hey Traders, in today's trading session we are monitoring ETH/USDT for a buying opportunity around 2,520 zone, Ethereum is trading in an uptrend and currently is in a correction phase in which it is approaching the trend at 2,520 support and resistance area.
Trade safe, Joe.

Why Echelon Prime will hit $200 and potentially $400 in 2025Echelon Prime (PRIME) is at the forefront of a transformative movement in Web3 gaming and AI-driven virtual economies. With its innovative ecosystem and upcoming flagship game, Parallel Colony, Echelon Prime is poised for significant growth.
The Echelon Ecosystem: Merging AI and Gaming
Echelon Prime is a blockchain-focused organization supporting a decentralized gaming ecosystem. It provides the PRIME token and Web3 tools for game developers, facilitating resource allocation and governance within a community-led environment.
The ecosystem's cornerstone is the PRIME token, which serves as the native currency across its platforms. PRIME enables players to access exclusive content, participate in governance, and engage in various in-game activities.
Parallel Colony: A Revolutionary AI-Driven Game
Parallel Colony is an upcoming simulation game where players partner with AI avatars to navigate a mining colony. Each avatar controls a wallet, allowing them to own digital possessions and interact with other semi-autonomous agents.
This "1.5 player" game design introduces a new paradigm in gaming, where AI agents operate alongside human players, creating a dynamic and immersive experience. The game's integration of AI and blockchain technology exemplifies the innovative direction of the Echelon ecosystem.
Market Potential and Price Outlook
As of now, Echelon Prime (PRIME) is trading at approximately $4.24, with a market capitalization of around $151 million. Given the ecosystem's innovative approach and the anticipated release of Parallel Colony, there is substantial growth potential.
A projected market cap of $15 billion would correspond to a PRIME token price of approximately $204, representing a 50x increase from current levels. This projection is based on the expected adoption of the Echelon ecosystem and the success of its flagship game. This could very well be a $30 billion market cap by end of 2025 as well, depending on other game title releases and new updates to other ambitious projects.
Conclusion: A Promising Investment in Web3 Gaming
Echelon Prime stands at the intersection of gaming and AI, offering a unique and forward-thinking ecosystem. With the upcoming release of Parallel Colony and the continued development of its platforms, Echelon Prime presents a compelling opportunity for investors interested in the future of Web3 gaming.

ETH 2025 Bull Run Price Targets: PT1 $5,800 PT2 $8,725Pectra: Ethereum’s Most Ambitious Upgrade Yet
On May 7, 2025, Ethereum activated the Pectra upgrade, marking its most comprehensive enhancement since the 2022 Merge. This dual-layer upgrade, combining the Prague execution layer and Electra consensus layer, introduced 11 Ethereum Improvement Proposals (EIPs) aimed at boosting scalability, usability, and staking efficiency .
Key features include:
EIP-7702: Introduces account abstraction, enabling wallets to function like smart contracts. This allows for batch transactions, gasless operations, and improved user experiences.
EIP-7251: Raises the staking cap per validator from 32 ETH to 2,048 ETH, streamlining staking operations and catering to institutional participants.
Enhanced Layer-2 Integration: Improves data handling and reduces costs for Layer-2 solutions, fostering greater scalability and efficiency across the Ethereum ecosystem.
These advancements position Ethereum to handle increased demand and support a broader range of decentralized applications, setting the stage for substantial growth.
Institutional and Governmental Embrace of Ethereum
Ethereum's adoption is accelerating among institutional investors and government entities:
Spot Ether ETFs: In May 2024, the U.S. Securities and Exchange Commission approved the first spot Ethereum exchange-traded funds (ETFs), launched by major firms like BlackRock and Fidelity. This milestone has facilitated greater institutional investment and integration of Ethereum into traditional financial markets.
Tokenization of Assets: Financial institutions are leveraging Ethereum's blockchain to tokenize assets, including U.S. Treasury bonds, enhancing transparency and efficiency in asset management.
Federal Initiatives: The U.S. government is exploring the creation of a national digital asset reserve, potentially incorporating Ethereum, signaling a significant shift toward embracing blockchain technologies at the federal level.
These developments underscore Ethereum's growing role as foundational infrastructure in the evolving digital financial landscape.
Price Targets for 2025
Considering the technological advancements and increasing institutional adoption, Ethereum's price is projected to reach:
Price Target 1: $5,800 (1.618 Fib Line)
Price Target 2: $8,725 (Bull Flag PT and near the 2.618 confluence)
These targets reflect a bullish outlook based on Ethereum's enhanced capabilities and its expanding role in global finance.

ADAUSDT IDEAI think chart looks pretty clear now. Red supply area properly laid down. Along with price properly taking buys from demand area in blue with higher lows. So obvious path will be the movement above supply till next supply (red area). Remember the supply is selling area (no retest concept) so strong selling could also originates. so trades are only after breaking out with clear price marching above supply zones.

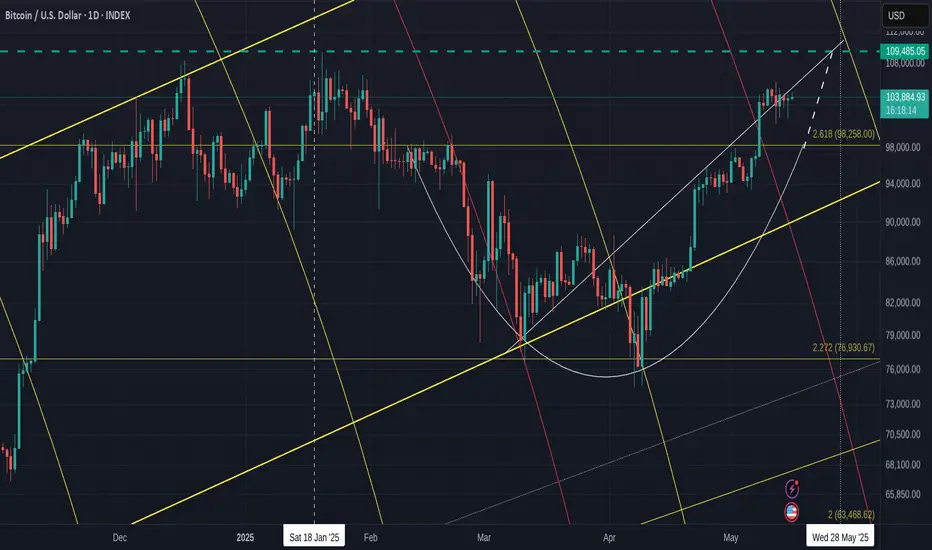
Comprehensive BITCOIN Analysis for the next 7 days - DAILY chart
First Off - Sorry for all the lines on the chart but EVERY one is very relevant to what is happening right now.
The Dashed Blue Horizontal line is the current ATH line. possible Resistance.
The 2.618 Fib extension has not yet been tested as support. This could happen still, at any point till end of month and is around the 98K usd zone.
PA has Ranged through the Local rising line of support, as if it no longer existed, which was a little surprising given the strength that PA has still. There maybe some uncertainty in the air.
PA is above the neckline of the Cup pattern it printed and, again, it would not be unusual to see PA come back down to test this Neckline as support, which is on that 2.618 Fib extension.
The Bold Yellow line is Long Term Support line since 2015, showing that Bitcoin PA is in the Lower side of a Long Term ascending channel, with plenty of room to rise,
PA has a lot of inert strength right now, so, we may not see this retest happen.
We just have to wait.
BUT you can see that Rising dashed line, the extension of the Cup pattern.
PA may range across into this and bump into it next week. If it acts as support again, PA will then be pushed into a tight Squeeze against the other rising line of support, with an Apex on the current ATH line.
PA ALWAYS REACTS BEFORE THE APEX
All that points towards some Volatile times next week if PA remains in this area.
The other descending line there is a 618 Fib Circle. You can see that 98% of the Time, PA is effected by these.
All this shows us 4 points of resistance, in the same Zone, All Next week and PA will Either Shoot through it with a Big push, Or we may see PA Drop back down. The Big question being, how Far ?
We do not want to loose the 2.618 Fib ext at 98K
But what else can we look at. ?
The RSI DAILY
This is still up high in the near Over Bought zone. It can range up here for extended periods but this is something we should be aware of as the possibility of a drop does exist.
On the weekly, RSI has room to move higher & the 4 hour is in neutral zone, again with ability to push higher.
The MACD DAILY
This is once again curling over and about to test the red signal line as support.
On a 4 hour chart, the MACD is down on Neutral line, giving it strength to push higher and if that continues, we will see the yellow MACD line bounce off the Red signal line on the Daily chart.
Once again, Look at the Histogram and the similarity to the area that the Arrow is pointing at.
We could repeat this but on a larger scale. We have to wait and see if this happens.
But also note how there was a Visit into a red Histogram ( for 4 days ) before the bigger push and I remind you about what has been said above.
So, what else can we look at that may offer some ideas ?
The Chart below is the 4 main Crypto Dominance charts by market Cap - 4 hour
BTC.D - ETH.D
OTHERS.D - USDT.D
( OTHERS = Top 125 Coins MINUS Top 10 by Market Cap) Mid to Low cap
We have recently seen a Drop in Bitcoin dominance, giving the ALTS some time to push higher. This is seen with the BTC.D dropping and the ETH.D and OTHERS.D rising
Also note how USDT.D Dropped, showing that stable coins were being exchanged for Crypto,
And as we see now, we have the possibility of BTC.D being rejected by its 50 SMA ( Red)
ETH.D is above its 50 SMA, showing it had a good push and may get support if PA drops
OTHERS.D has already fallen below its 50 SMA, showing a brutal sell off, rapid profit taking.
That is the world of ALTS.
In the last 48 hours, we saw a return for Bitcoin as it rose from a shallow Low in its Range. This was enough to cause a sell off of the ALT coins as we see in the Drop in Others.D
ETH however, remains in a range with obvious intention to continue higher if the market allows.
Lastly, we can compare Bitcoin to the other Markets
Bitcoin - CFD GOLD
DXY - S&P500
Bitcoin has performed well. It has reclaimed some position on Gold recently while it climbed alongside the S&P
We can also see how BTC climbed while DXY dropped.
This highlights some Flaws in using the BTC USD pair to judge the success of BTC but this is explaned better in another post. But in short, If the $ looses Value and your BTC USD pair appears to climb, theg ain is lost as the $ is worth less.
Use BTC XAUT pairs. Bitcoin Gold Pair - Historically, GOLD looses little Value by comparison. So when Bitcoin gains against Gold..It is WIN WIN
So, in conclusion, we see Bitcoin under some pressure to avoid Lower or sharper Drop in the short tern.
The Lower Timeframes show us that BTC has the ability for a Continued Range but with caution.
We see ETH ( and larger Alts ) intent on remain in the game now they have had a small glimpse of Gains
And we see that Mid and Lower Cap Alts are mostly just money makers providing you play the game right. And that game may have some more time if Bitcoin Stumbles in the next 7 days.
And that possibility does exist.
Today is crucial in many ways and will set the tone for the following week.
There is Financial Data being released by the USA today and if unfavourable, we may see some sharp moves.
And ,Longer Term VERY BULLISH - I HOLD AND CONTINUE TO BUY WHEN I CAN ON SPOT ORDERS
I hope this helps and I am grateful for comments
ETHBTC: Ethereum to gain massively against Bitcoin.Ethereum is overbought on its 1D technical outlook (RSI = 72.854, MACD = 228.230, ADX = 38.542) due to the rebound it initiated last week. Even though it is still on its very early stages, this rebound and statement of its strength is better viewed on the ETHBTC pair against Bitcoin. As you can see, ETHBTC bottomed on a level that it hasn't seen since January 6th 2020. The massive downtrend since 2023 is comparable to the one that started in 2018. Similar bottoms, similar 1W RSI sequences. We expect this rebound to be the main driver all the way to the 7 year Resistance level (R1). Traders of this pair can target 0.0800 on the long term.
## If you like our free content follow our profile to get more daily ideas. ##
## Comments and likes are greatly appreciated. ##

2 possible scenariosEthereum may continue to rise after correction waves. I showed 2 possible scenarios on the chart. If you zoom in a little bit more on the graph you can see the ABCDE waves more clearly. I think at least these waves will be completed.
* The purpose of my graphic drawings is purely educational.
* What i write here is not an investment advice. Please do your own research before investing in any asset.
* Never take my personal opinions as investment advice, you may lose your money.

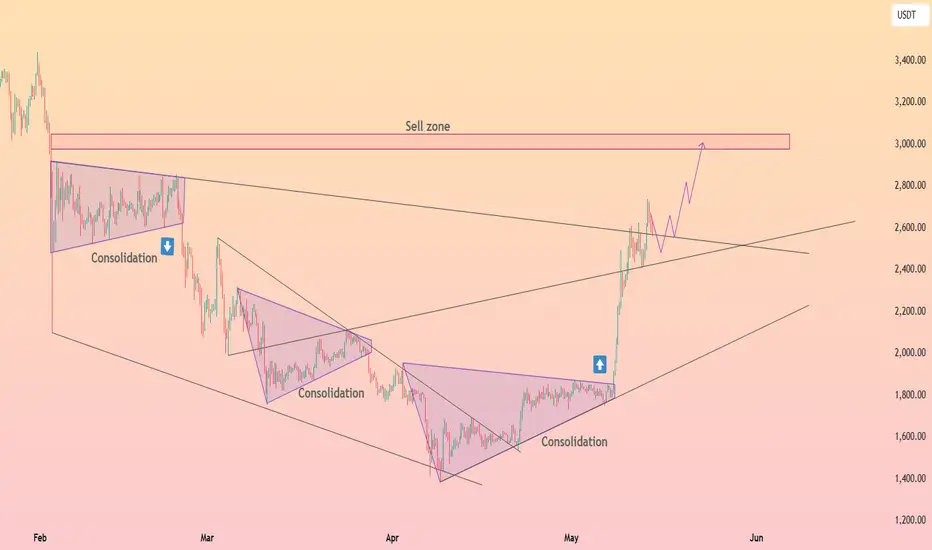
HolderStat┆ETHUSD wedge catapult toward 3kEthereum price tore out of its multi‑month falling wedge and smaller consolidation triangle, blasting through the mid‑2 k range before pausing around 2.7 k. As long as price respects the former wedge roof as trendline support, bulls retain scope to probe the highlighted 2.8‑3.1 k sell zone. A soft pullback into 2.4‑2.5 k would be viewed as a constructive retest rather than trend failure.

Ethereum - Short Term Buy IdeaH1 - Strong bullish move.
No opposite signs.
Currently it looks like a pullback is happening.
Expecting further continuation higher until the two Fibonacci support zones hold.
If you enjoy this idea, don’t forget to LIKE 👍, FOLLOW ✅, SHARE 🙌, and COMMENT ✍! Drop your thoughts and charts below to keep the discussion going. Your support helps keep this content free and reach more people! 🚀
--------------------------------------------------------------------------------------------------------------------
Disclosure: I am part of Trade Nation's Influencer program and receive a monthly fee for using their TradingView charts in my analysis.

ETHUSD: First red day, day 2 on the backsideHello traders and welcome back on my profile, here is Gianni, and I hope you can enjoy this detailed analysis on ETHUSD.
As always, I don't use technical analysis for market prediction, because predicting is 50/50, but I use it to calculate my risk reward in case I would position myself in the market.
My general thesis for the day is pretty short, and following, the logic behind this thesis.
Monday, opening range of the week, established the current monthly high, breaking into the low of Friday (lower low) at the end of the day. Other time frames/big players might be in play and potentially the week can setup for a pump and dump.
Tuesday performed a strong pumping day, breaking through the Monday high and expanding the range higher, closing as well in breakout long.
Wednesday the market pretty much consolidated for the whole day, coming back inside the opening range high, and closing as first red day.
First red day is only a bearish signal, it doesn't mean that the market will drop certainly, but it gives you a signal the potentially long might be trapped in the wrong direction, increasing the chances of reversal, the day later or few more days later.
Today, Thursday, the market kept breaking lower, and it looks like coiling into the yesterday low of day, definitely a sign of weakness which I will keep in consideration.
8:30am and 8:40am NYT major red news are on schedule, I would not touch this market before that time, avoiding any possibility to be stuck in the trade.
How would I take this trade?
Simply I will be looking for any sell high opportunity after the news, reinforced with bearish price action, as triple tops, double tops and any kind of reversal patterns into the most recent high in place.
What about a long view?
Actually I'm not interested today, it can go higher, it can retest the weekly high, it can consolidate, it can do EVERYTHING, I don't care, my only focus is aligning my bearish thesis with a bearish setup.
I won't take in consideration any long opportunity for the day.
Overall, the market strongly pumped up during the previous week, I do not expect any crazy move, I do not think that this market trapped volume enough for a huge bearish collapse.
The potential opportunity of today, if presented, will be targeting the current weekly low (Monday low).
Stay tuned for further update during the NY session

Pectra Breakout to Unleash a New All-Time High? Ethereum’s Breakout Moment – Pectra to Unleash a New All-Time High?
Post with Emojis:
💎🚀 Ethereum’s Breakout Moment – Pectra to Unleash a New All-Time High? 🚀💎
Hey Traders!
Ethereum is standing at the gates of its next legendary move! With price holding strong above $2,531 and the Pectra upgrade just around the corner, all the stars are aligning for what could become one of the biggest rallies since The Merge. Are you ready for the breakout of the year?
📊 Key Levels to Watch:
📍 Support: $2,531 – Bulls holding the line perfectly.
🚀 Breakout Levels: $2,805 – $2,848 – The historic ‘Clashing Rocks’ resistance zone.
🎯 Immediate Targets: $3,200 – $3,500 🚀
🏆 Ultra Bullish Target: $4,000+ All-Time High Breakout Incoming!
📚 Why This Is NOT Just Another Pump:
🔧 Pectra Upgrade is a Game Changer:
💡 Smarter Wallets: No more annoying popups—seamless transactions!
⚡ Frictionless UX: Say goodbye to endless “approve + confirm” loops.
📉 Cheaper Transactions: Blobs scaling kicks in—lower fees, even in the craziest market conditions!
🌱 Staking Revolutionized: Bigger validator caps, faster deposits, smart contract withdrawals.
🔓 Unlocking $490B in Trapped Value: Capital flows freely—fueling the next bull run!
Ethereum is no longer just an asset—it’s transforming into the most efficient and user-friendly financial platform ever built.
💬 Question for You:
Are you already on board this rocket, or are you still watching from the sidelines? Which level will break first—$2,805 or $3,200?
Remember: When history and technology collide, markets explode. This is that moment.
One Love,
The FXPROFESSOR 💙
ps Trump bringing money from all over the place dominate news: for sure some ends up in Ethereum

Ethereum: 96% of Hedge Funders Were Short on Monday!FenzoFx—Ethereum is trading bearishly, having broken below the 50-SMA. Currently, 96.0% of hedge funders are short, while 52.0 percent of institutional traders were long at the beginning of the week.
If ETHUSD remains under the 50-period moving average, the downtrend may persist, with a potential dip toward the 2,420-dollar support. Retail traders should watch for bullish signals, such as a candlestick pattern, near this level.

BTC - ATH Incoming?current market structure
this 1-hour chart of btcusdt presents a sophisticated transition from accumulation to a potential breakout structure, with well-defined fair value gaps (fvgs) and a clear instance of manipulation followed by rapid recovery. the market appears to be attempting to regain bullish momentum following a liquidity sweep and subsequent internal shift in structure.
accumulation within an ascending channel
price action developed within an ascending channel, marked by higher highs and higher lows over time. this is a classic representation of controlled bullish accumulation. the tight, stair-stepping movement reflects steady institutional positioning, building long exposure while keeping volatility contained. this phase shows multiple rejections of the lower trendline, confirming consistent demand.
manipulation into fvg
the breakdown beneath the channel coincides with a sharp move into a large fvg (highlighted in light blue). this aggressive wick likely triggered stop-losses of retail longs, constituting a liquidity grab or manipulation event. such actions are typical after extended consolidations, flushing out weak hands to enable large players to enter at a discount. the reaction from this zone confirms its significance, as buyers immediately stepped in and reclaimed lost ground.
recovery and shift in momentum
after manipulation, the market found support in the fvg zone and launched a sharp bullish move. the rapid recovery illustrates strong underlying demand. the price re-entered a smaller fvg (labelled “resistance in this fvg”), briefly faced selling pressure, and then decisively broke through it. this reclaim of supply zones is often a powerful signal that bullish momentum is back in control.
bullish inversion fair value gap (ifvg)
price is now challenging a smaller bullish internal fair value gap (ifvg), marked in red. this zone, which once acted as a resistance layer, has now become a pivot point. successful hold or breakout above this region would likely trigger continuation, with market participants targeting previous swing highs or beyond.
break of structure and bullish continuation
a key development here is the break above the previous swing high or "bsL" (buy-side liquidity). this signifies a structural shift—no longer just recovering, the market is actively seeking higher liquidity. such breaks often catalyze rapid directional movement, especially when they occur after liquidity has been swept from the opposite side.
distribution and potential for new all-time high
the green projection suggests the possibility of further bullish expansion toward a distribution zone. if current momentum continues and no major supply zones disrupt the advance, the market could be on its way to challenge or set new all-time highs (ath). the label “on the way to new ath?” reflects this open-path scenario, contingent on continuation above 105,600–106,000 levels.
market psychology
this chart reveals a narrative of engineered manipulation followed by strength confirmation. institutions manipulated price below support to shake out retail traders, then absorbed that liquidity and pushed price higher. once resistance was reclaimed, confidence returned, inviting both short cover and fresh long entries. such sequences reinforce the importance of waiting for price reactions at key levels rather than acting on the first impulse.
summary
btc has exited an accumulation phase within a rising channel, experienced a strategic liquidity sweep into a deep fvg, and then quickly reversed. the current positioning above multiple reclaimed fvgs and just beneath a structural break confirms a bullish outlook. if price holds above the current bullish ifvg, the pathway to distribution and possibly new highs remains open. strategic traders may now focus on confirming pullbacks into these reclaimed zones for continuation setups.
