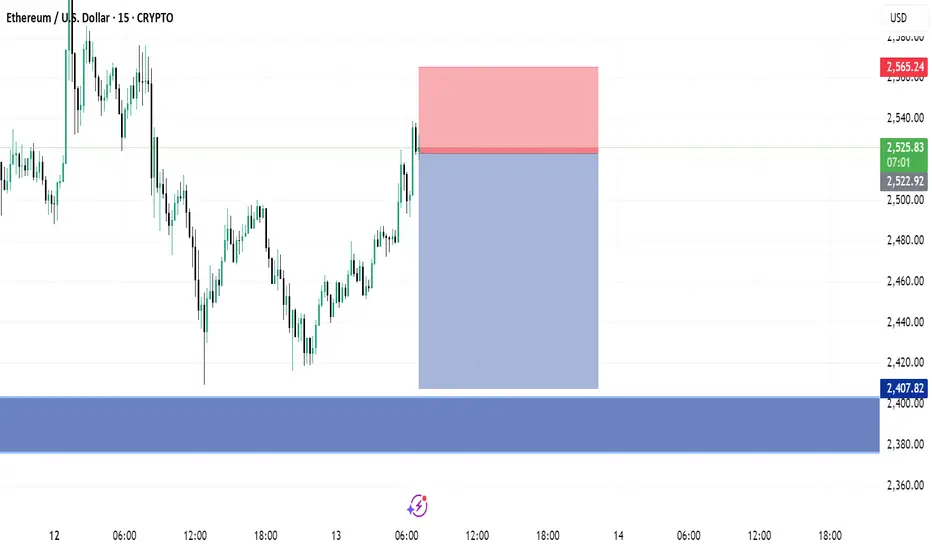
Ethereum: 96% of Hedge Funders Were Short on Monday!FenzoFx—Ethereum is trading bearishly, having broken below the 50-SMA. Currently, 96.0% of hedge funders are short, while 52.0 percent of institutional traders were long at the beginning of the week.
If ETHUSD remains under the 50-period moving average, the downtrend may persist, with a potential dip toward the 2,420-dollar support. Retail traders should watch for bullish signals, such as a candlestick pattern, near this level.
Ethereum (Cryptocurrency)

BTC - ATH Incoming?current market structure
this 1-hour chart of btcusdt presents a sophisticated transition from accumulation to a potential breakout structure, with well-defined fair value gaps (fvgs) and a clear instance of manipulation followed by rapid recovery. the market appears to be attempting to regain bullish momentum following a liquidity sweep and subsequent internal shift in structure.
accumulation within an ascending channel
price action developed within an ascending channel, marked by higher highs and higher lows over time. this is a classic representation of controlled bullish accumulation. the tight, stair-stepping movement reflects steady institutional positioning, building long exposure while keeping volatility contained. this phase shows multiple rejections of the lower trendline, confirming consistent demand.
manipulation into fvg
the breakdown beneath the channel coincides with a sharp move into a large fvg (highlighted in light blue). this aggressive wick likely triggered stop-losses of retail longs, constituting a liquidity grab or manipulation event. such actions are typical after extended consolidations, flushing out weak hands to enable large players to enter at a discount. the reaction from this zone confirms its significance, as buyers immediately stepped in and reclaimed lost ground.
recovery and shift in momentum
after manipulation, the market found support in the fvg zone and launched a sharp bullish move. the rapid recovery illustrates strong underlying demand. the price re-entered a smaller fvg (labelled “resistance in this fvg”), briefly faced selling pressure, and then decisively broke through it. this reclaim of supply zones is often a powerful signal that bullish momentum is back in control.
bullish inversion fair value gap (ifvg)
price is now challenging a smaller bullish internal fair value gap (ifvg), marked in red. this zone, which once acted as a resistance layer, has now become a pivot point. successful hold or breakout above this region would likely trigger continuation, with market participants targeting previous swing highs or beyond.
break of structure and bullish continuation
a key development here is the break above the previous swing high or "bsL" (buy-side liquidity). this signifies a structural shift—no longer just recovering, the market is actively seeking higher liquidity. such breaks often catalyze rapid directional movement, especially when they occur after liquidity has been swept from the opposite side.
distribution and potential for new all-time high
the green projection suggests the possibility of further bullish expansion toward a distribution zone. if current momentum continues and no major supply zones disrupt the advance, the market could be on its way to challenge or set new all-time highs (ath). the label “on the way to new ath?” reflects this open-path scenario, contingent on continuation above 105,600–106,000 levels.
market psychology
this chart reveals a narrative of engineered manipulation followed by strength confirmation. institutions manipulated price below support to shake out retail traders, then absorbed that liquidity and pushed price higher. once resistance was reclaimed, confidence returned, inviting both short cover and fresh long entries. such sequences reinforce the importance of waiting for price reactions at key levels rather than acting on the first impulse.
summary
btc has exited an accumulation phase within a rising channel, experienced a strategic liquidity sweep into a deep fvg, and then quickly reversed. the current positioning above multiple reclaimed fvgs and just beneath a structural break confirms a bullish outlook. if price holds above the current bullish ifvg, the pathway to distribution and possibly new highs remains open. strategic traders may now focus on confirming pullbacks into these reclaimed zones for continuation setups.

Will ETH Hit 16% Upside With $3,100 In Sight?Hello and greetings to all the crypto enthusiasts, ✌
All previous targets were nailed ✅! Now, let’s dive into a full analysis of the upcoming price potential for Ethereum 🔍📈.
Ethereum continues its bullish trajectory 🚀 following last week’s impressive rally. With strong volume backing the move, a breakout above the $3,000 psychological level appears imminent. I’m targeting a 16% upside with a primary resistance at $3,100 , supported by daily structure, Fibonacci alignment, and a long-term trendline 🔍.
🧨 Our team's main opinion is: 🧨
Ethereum is gaining momentum with a 16% upside in sight — main target at $3,100 after a clean $3,000 breakout 🚀.
Give me some energy !!
✨We invest hours crafting valuable ideas, and your support means everything—feel free to ask questions in the comments! 😊💬
Cheers, Mad Whale. 🐋

ETH sub $1k coming soonCRYPTOCAP:ETH is rejecting resistance here. Unless we can flip it as support, then it looks like new lows are coming.
I think the most likely level to find support is at $753, however I marked off other levels that are important incase we find support there.
You'll want to bid these levels because they'll be the buy of the decade, should we get down there.

Ethereum Monthly: Bull-Bear Market & Transition Until 2029Ethereum closed five months red, something seen only once in the past in 2018 in a bear market. Needless to say, after such a strong bearish period the market produced an equally strong bull market.
Back in 2018 Ethereum went beyond five months red but this is the only time ever in its history, then now in 2025 this is the longest stretch of continued bearish action. This is good because we know that the market will produce a bull market that is many times stronger, just to balance things out.
These five red months resulted in a long-term higher low.
The bottom was hit at $1,385 in April, last month. This month we already have a full green candle going mid-way through February. All the loses incurred in April and March have been recovered.
The low last month hit levels not seen since March 2023. In March 2023 ETHUSDT was rising but produced first some bearish action; the month closed green. After more than eight months of consolidation it produced a major advance and the highest prices since the 2021 All-Time High.
This time it will be different. Ethereum will be rising steadily, month after month. Rather than sideways-neutral, up-up.
In 2024 there was a double top. March 2024 and December 2024.
In 2025 we will have one top, a blow-off top. So there will be only one chance to sell when prices are really high up.
It will grow steadily month after month as bullish momentum builds up. After several months, we will have a bull run reaching mania levels, euphoria, excitement and a very strong new All-Time High. After this phase is over, the classic bear market in 2026.
The bear market will produce a multi-year low price, then a period of consolidation, sideways-neutral, and then back again bullish, a major bull market in 2029. There will be growth in the transition years, 2027 and 2028. You can equate these with 2023 and 2024.
2022 was the last bear market.
2026 will be the next bear market.
2021 was the last bull market.
2025 is the next bull market.
2023-2024 were the transition years.
2027-2028 will be transition years.
Thank you for reading.
Namaste.

I'm calling for $10,000 per Ethereum.I think Ethereum could reach $10,000 or even $20,000 if we really go parabolic in wave 5.
We are potentially gearing up for the biggest crypto bull market in human history, and Ethereum should be a major player in this move.
As always, stay profitable.
– Dalin Anderson

Eth/Btc vs Bitcoin Dominance Ethbtc parity and bitcoin dominance parabolic curve breakout occurred. bitcoin dominance down ethbtc will start the up process

I see ETH break the trend lineETH owner buy enough coin in their wallet with breaking the descend line.

Ethereum ETH Will Go Insane Soon!Hello, Skyrexians!
It's not a top secret that Bitcoin dominance is about to finish the uptrend and it can give the second life to BINANCE:ETHUSDT . We have already seen the bounce, but now asset is struggling to break through $2600. We can really see small correction in the upcoming week, but finally uptrend has been already confirmed.
Let's take a look at the weekly chart. I marked the Elliott waves structure for you and in my opinion now price is printing the wave 3. At the bottom there was a green dot on Bullish/Bearish Reversal Bar Indicator which is huge confirmation of the bull run. The target for wave 3 is 1.61 Fibonacci at $6500. Anyway, please take into account the second scenario, when BTC dominance will reach 67% and ETH will retest the low (wave 5 in C). Now I have 50/50 probability, but anyway if you bought alts at the 65.3% dominance your deposit will not suffer significantly.
Best regards,
Ivan Skyrexio
___________________________________________________________
Please, boost this article and subscribe our page if you like analysis!

$TOTAL2: Altcoin bull market until April 2026Signal flashing here, very promising outlook for altcoins...
Follow me for more insights on how to maximize profits in the coming bullish cycle that is forming now, check out my signature for more info.
Best of luck!
Cheers,
Ivan Labrie.

EtherFi ETH.fi price analysis⁉️ Increased trading volumes, shrinking growth candlesticks, and a trend line "overhang" - for us, these factors indicate the likelihood that a correction is near.... And for you?
The #ETHfi price shot up nicely thanks to promising updates to the #Ethereum ecosystem, about which we write a few posts early.
🟢 And of course, there are further prospects for the growth of the #Etherfi project, because now the capitalization is only $375 million.
🔴 But still, in our opinion, the price of OKX:ETHFIUSDT would still be suitable to slightly correct to $0.84-0.74-0.64, whoever likes which figure)
🔝 And from there, with new strength, break through the trend to new heights.
_____________________
Did you like our analysis? Leave a comment, like, and follow to get more

Could PEPE reach a staggering 3000X and hit a market cap of 69B...this year?
YES 69 BILLION Dollars for a Frog coin!
To assess the potential growth of a cryptocurrency, we first need to identify its all-time low price.
Coinpedia reports that PEPE's all-time low was $0.00000005514 on ETH via Uniswap on April 18, 2023, marking the lowest price recorded on a decentralized exchange.
For PEPE to achieve a 3000X increase, it would need to rise to $0.00016542 by December 31st.
Given its current price of $0.000014238, this represents an 11.5X increase from its present value.
With a total supply of 420.69 trillion tokens, reaching the target price would result in a market cap of $69.58 billion.
While this may seem ambitious for a memecoin lacking utility, the idea of hitting such a whimsical market cap is tempting.
I estimate the likelihood of this happening at around 2.5%.
(This scenario also suggests a reasonable portfolio allocation for those primarily holding #BTC and #ETH and I highly suggest rebalancing above 5%)

FXAN & Heikin Ashi Trade IdeaBINANCE:ETHUSD
In this video, I’ll be sharing my analysis of ETHUSD, using FXAN's proprietary algo indicators with my unique Heikin Ashi strategy. I’ll walk you through the reasoning behind my trade setup and highlight key areas where I’m anticipating potential opportunities.
I’m always happy to receive any feedback.
Like, share and comment! ❤️
Thank you for watching my videos! 🙏

Ethereum H4 | Overlap support at 23.6% Fibonacci retracementEthereum (ETH/USD) is falling towards an overlap support and could potentially bounce off this level to climb higher.
Buy entry is at 2,455.05 which is an overlap support that aligns close to the 23.6% Fibonacci retracement.
Stop loss is at 2,250.00 which is a level that lies underneath an overlap support.
Take profit is at 2,846.25 which is a multi-swing-high resistance.
High Risk Investment Warning
Trading Forex/CFDs on margin carries a high level of risk and may not be suitable for all investors. Leverage can work against you.
Stratos Markets Limited (tradu.com):
CFDs are complex instruments and come with a high risk of losing money rapidly due to leverage. 63% of retail investor accounts lose money when trading CFDs with this provider. You should consider whether you understand how CFDs work and whether you can afford to take the high risk of losing your money.
Stratos Europe Ltd (tradu.com):
CFDs are complex instruments and come with a high risk of losing money rapidly due to leverage. 63% of retail investor accounts lose money when trading CFDs with this provider. You should consider whether you understand how CFDs work and whether you can afford to take the high risk of losing your money.
Stratos Global LLC (tradu.com):
Losses can exceed deposits.
Please be advised that the information presented on TradingView is provided to Tradu (‘Company’, ‘we’) by a third-party provider (‘TFA Global Pte Ltd’). Please be reminded that you are solely responsible for the trading decisions on your account. There is a very high degree of risk involved in trading. Any information and/or content is intended entirely for research, educational and informational purposes only and does not constitute investment or consultation advice or investment strategy. The information is not tailored to the investment needs of any specific person and therefore does not involve a consideration of any of the investment objectives, financial situation or needs of any viewer that may receive it. Kindly also note that past performance is not a reliable indicator of future results. Actual results may differ materially from those anticipated in forward-looking or past performance statements. We assume no liability as to the accuracy or completeness of any of the information and/or content provided herein and the Company cannot be held responsible for any omission, mistake nor for any loss or damage including without limitation to any loss of profit which may arise from reliance on any information supplied by TFA Global Pte Ltd.
The speaker(s) is neither an employee, agent nor representative of Tradu and is therefore acting independently. The opinions given are their own, constitute general market commentary, and do not constitute the opinion or advice of Tradu or any form of personal or investment advice. Tradu neither endorses nor guarantees offerings of third-party speakers, nor is Tradu responsible for the content, veracity or opinions of third-party speakers, presenters or participants.

ETHEREUM SWING SHORT|
✅ETHERUM went up by 76%
In just 3 weeks so the coin is
Overbought, therefore, despite
Or overall very bullish bias on
Crypto mid-term we will be
Expecting a local correction
From the wide horizontal
Resistance above around 2900$
SHORT🔥
✅Like and subscribe to never miss a new idea!✅
Disclosure: I am part of Trade Nation's Influencer program and receive a monthly fee for using their TradingView charts in my analysis.

ETH/BTC bear market since 2021.. bounce time ?ETH / BTC
If you checked this chart you will notice that ETH was in downtrend and bear market against BTC since 2021 !
Now we have reached a very important multi years support (price action on 2020 - 2019 - 2016 )
Time for bounce soon ?

ETHUSD Multi Time Frame Trend Analysis, Profit Surging InsightsDaily Chart (1D) Overview
The daily chart reflects a powerful bullish breakout, where ETHUSD surged past prior resistance levels, now potentially turning into support. Key observations:
Support Zones:
The $2,300 to $2,400 zone has emerged as a strong demand area. This zone was previously resistance and has now flipped into support after the breakout.
A deeper retracement could potentially revisit the $1,750 to $1,850 demand area, though that would suggest a breakdown of current bullish momentum.
Resistance Zones:
The price is currently testing minor resistance around $2,600 and $2,650, with historical supply and reaction zones visible from previous consolidation.
A broader supply zone exists between $2,800 to $3,400, marked in red, which could be the next major target area if the bulls maintain momentum.
Structure:
ETH formed a higher low in late April followed by a higher high in early May, confirming a trend reversal from the earlier bearish structure.
The clean breakout from consolidation signals a fresh bullish leg, with increasing volume and momentum indicators likely aligning with upward bias.
Trend Direction: Bullish on both Daily and 4H
✅ Market Structure: Higher highs and higher lows
✅ Key Short-Term Support: $2,350 to $2,450
✅ Key Resistance Zones: $2,620 to $2,650 → $2,800 → $3,400
✅ Upside Targets:
1. Short-Term: $2,650 → $2,800
2. Medium-Term: $3,400 → $4,108
✅ Potential Retracement Levels:
3. Shallow: $2,420
4. Deeper: $2,200 and $1,850
If the price holds above $2,400, the bullish outlook remains intact, with increasing likelihood of testing higher resistance levels. However, a sustained move below $2,300 could trigger deeper retracements.


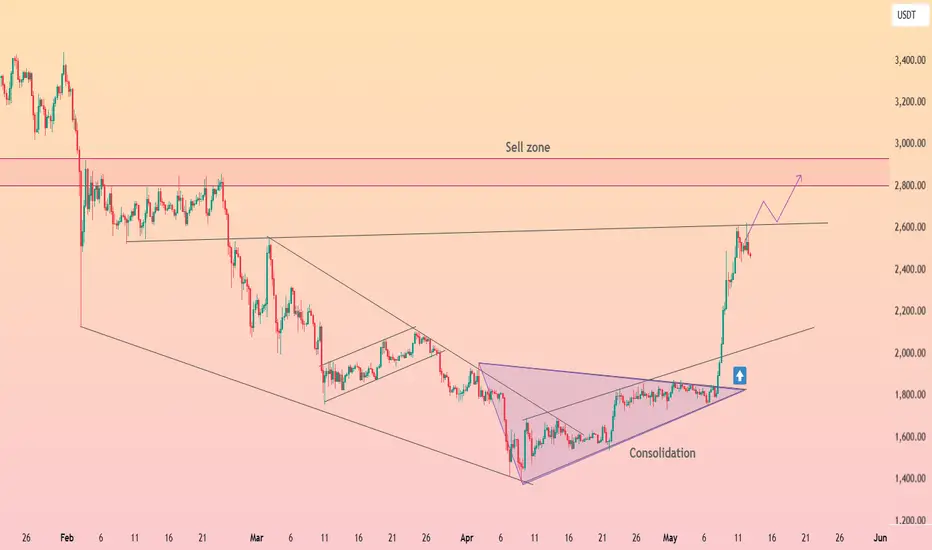
HolderStat┆ETHUSD retest $2500 After months locked inside a broad falling wedge, ETH erupted in early May, blasting through both the wedge roof and an internal consolidation triangle. The vertical thrust carried price from 1.8 k straight to 2.6 k, where a key horizontal lid now tests bulls’ resolve. Short‑term dips back toward the broken trendline or 2.2 k support would look constructive while momentum targets the well‑flagged 2.8‑3 k sell zone overhead. 🎯
ADAUSDT IDEALooking for the level breaks to the upside. This indicator has higher accuracy telling in short to medium term trades rather than long term anticipation.

ETHBTC – Bottom Likely In!Finally stepping in to say it—ETHBTC has likely bottomed.
April marked the final month of its bearish phase, and it just tapped the impulse zone from the last major move, which also lines up with a key range low we haven’t seen since December 2019.
The weekly is starting to show early signs of strength, adding weight to this being a pivotal area.
From a risk/reward standpoint, this is arguably the best BINANCE:ETHBTC setup in a long time.
Time to act accordingly—this could be the moment many have been waiting for. I expect BTC dominance to give alts some room over the next couple of weeks. The real test comes in July.
MARKETSCOM:ETHEREUM BINANCE:ETHUSDT

BTCUSDT IDEAAt the highs on the one side and on the contrary formations seems to be a chance for breakout to capturing more upside might put a limited move but with momentum (on the upside).
Only hurdle seems to be supplies on daily TF at this price.
