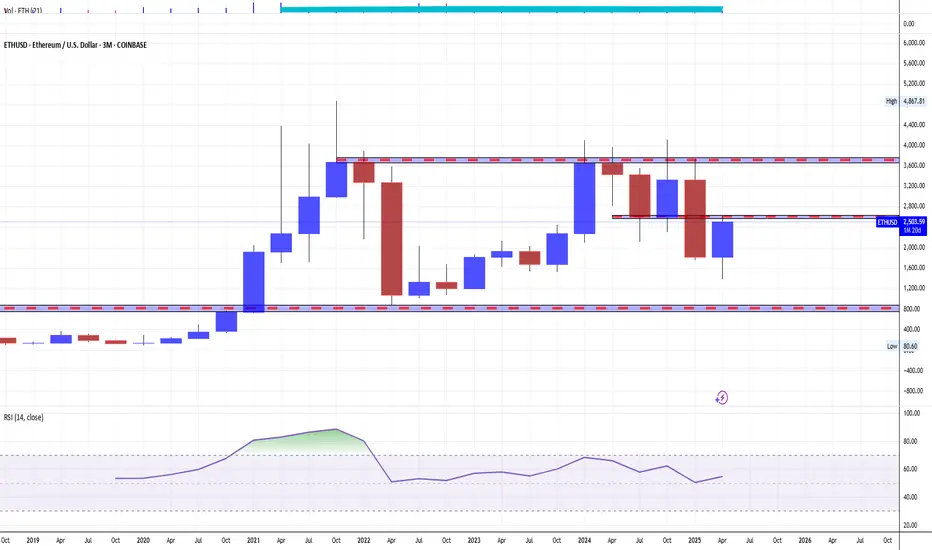
Welcome to ALT SEASON (Real) | BTC.D & ETH/BTCCRYPTOCAP:BTC.D is rejecting off 2021 POI and deviating this cycle's high having just closed the weekly under 64%. Coupled with CRYPTOCAP:ETH strength showing signs of a trend reversal after downtrending for 4-year against $BTC. Likely see CRYPTOCAP:ETH trade upwards of US$5000 this year as ETH outperforms BTC.
Ethereum (Cryptocurrency)

ETH USDT Umbrella patternPrediction: an umbrella. Markets sometimes are symmetric, this time it might print an umbrella.

Ethereum ... Don't miss this train!The Ethereum season has arrived, and in the coming days, we'll be focusing on Ethereum and the tokens built on its network.
The chart shows a descending broadening wedge pattern, which has been broken on the daily timeframe.
Don’t wait for a retest or any major corrections—this train won’t wait for you.
The target for this pattern is $6,600.
Best regards Ceciliones🎯

Ethereum Daily AnalysisEthereum is trying to reach its important resistance levels. We are monitoring its reaction in these areas(2749-3105). After reaching important support levels, it should be checked whether Ichimoku is showing an upward trend or not, then the analysis will be updated.

ETH Targeting the HighsEthereum (ETHUSD) Trading Setup
Direction: CALL 🟢
Entry Price: $2,484.60 (most recent price from chart as of June 27, 2025)
Profit Target: $3,445.32 💰 (targeting previous highs as shown in the chart)
Stop Loss: $2,004.24 (below recent consolidation low for a 2:1 risk-reward ratio)
Risk-Reward Ratio: 2:1
Position Size: Risk 1-2% of your portfolio
Entry Timing: Enter immediately at market price
Confidence Level: 75% 🚀
Why This Signal?
Price Action: ETHUSD broke out of consolidation ($2,484.15-$2,679.34) with strong momentum, targeting previous highs at $3,445.32.
Technical Indicators:
Bullish breakout above 50-day and 200-day moving averages.
RSI at 78.32 (slightly overbought but supports momentum).
MACD showing bullish crossover (Bull signals on chart).
VIX/Bond Yields: VIX at 21.90 (low volatility, good for risk assets); 10-year Treasury yield at 4.375% (moderate, not a headwind).
News Sentiment: Mixed economic news with US-China trade tensions, but crypto markets remain resilient (per Forex Factory news).
Follow for the best AI generated Signals

Crypto Markets: “Sell in May, and Go Away” — What Does It MeanThe historical pattern known as the “Sell in May, and Go Away” seasonal divergence was popularized by the Stock Trader’s Almanac, which stated that investing in stocks represented by the Dow Jones Industrial Average from November to April and switching to fixed income for the other six months “has delivered reliable returns with reduced risk since 1950.”
What is “Sell in May, and Go Away”?
“Sell in May, and Go Away” is a well-known saying in finance. It is based on the historical underperformance of stocks over the six-month period from May to October.
According to Fidelity Investments, the divergence has been most pronounced in recent years, with the S&P 500 (SPX) gaining an average of about 2% from May to October from 1990 onwards over the next 30 years, compared with an average of about 7% from November to April.
The Halloween Indicator, 'Sell in May and Go Away': Everywhere and All the Time*, a research paper examining stock markets outside the US, found the same pattern, calling the seasonal divergence trend "surprisingly resilient."
Key Takeaways
👉 "Sell in May and go away" is a saying that refers to the historically weaker performance of financial markets from May to October compared to the other half of the year.
👉 Investors can try to capitalize on this pattern by switching to less risky assets from May to October, based on historical data.
Seasonality in investment flows may persist as a result of year-end bonuses from the financial industry and businesses, perhaps helped by the mid-April deadline for filing U.S. income tax returns.
Whatever the underlying fundamentals, the historical pattern was made more pronounced by the October stock market crashes of 1987 and 2008.
Final Points
👉 The problem with historical patterns is that they do not reliably predict the future. This is especially true for well-known historical patterns. If enough people became convinced that the “Sell in May and Walk Away” pattern would persist, it would essentially begin to disappear immediately. All the early sellers would try to sell in April and bid against each other to buy back the assets before everyone else in October.
👉 At the same time, certain considerations regarding the development of geopolitical events in the period from May to October 2025 reasonably give reason to think about the prospects of such a scenario for the next 6 months.
* The Halloween Indicator, 'Sell in May and Go Away': Everywhere and All the Time
>> Ben Jacobsen Tilburg University - TIAS School for Business and Society; Massey University
>> Cherry Yi Zhang. Nottingham University Business School China; Massey University - School of Economics and Finance.
--
Best wishes,
@PandorraResearch Team 😎
TOTAL market cap chart: turning bullish this monthGM gents, it seems the TOTAL crypto market cap chart is resuming the bullish trend that started in October 2023, after the bear market that started in late 2021 ended.
Sentiment is pessimistic, has shifted from capitulation to fading rallies to generalized wall of worry despite very positive technical developments.
Most people on CT expect the 'cycles' they now believe in to play out in the same predictable manner, all correlations and timing for moves and rotations to match, that obviously won't happen and hasn't happened since the market bottomed, and I expect it to continue to make people end up getting wrong footed (like selling too early cause now they say this is the last leg up due to alt szn).
People think we are in a late 2021 redux when in reality we had a COVID crash grade capitulation which can't really precede a top, but rather indicate we saw a bear market bottom long term. Trade is getting resolved, risks from mon pol as well, rate cuts coming soon and no on is positioned.
Don't miss out my friends.
Best of luck!
Cheers,
Ivan Labrie.

ETHUSD: Bulls Are Winning! Long!
My dear friends,
Today we will analyse ETHUSD together☺️
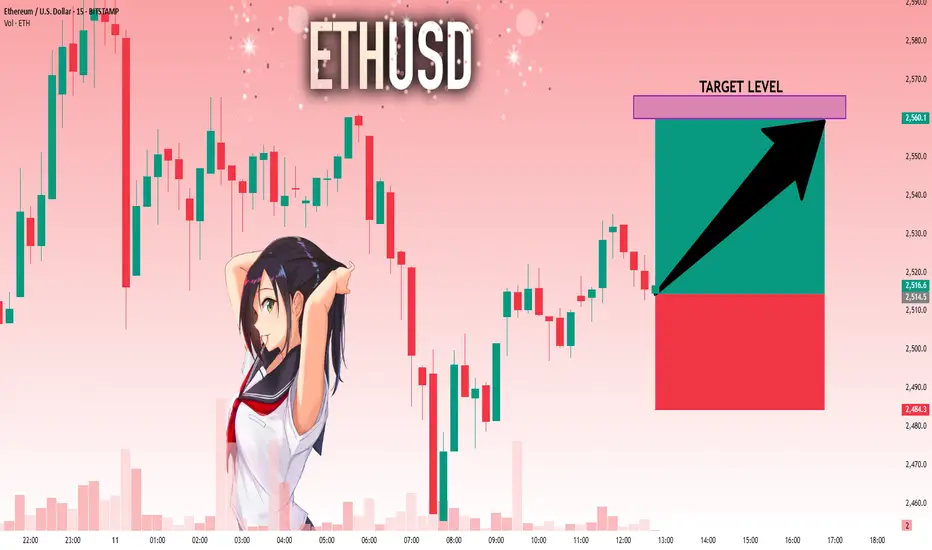
The price is near a wide key level
and the pair is approaching a significant decision level of 2,514.5 Therefore, a strong bullish reaction here could determine the next move up.We will watch for a confirmation candle, and then target the next key level of 2,560.1.Recommend Stop-loss is beyond the current level.
❤️Sending you lots of Love and Hugs❤️
GOLD - The Timeless Standard Bitcoin Can Only Dream Of ✨💰
1/ Bitcoin’s Aspirations vs. Gold’s Reality
Bitcoin proclaims to be “digital gold” , promising decentralization and stability. But the truth is clear: while Bitcoin is shaken by extreme wealth concentration and constant media hype, gold has built a centuries-long reputation for trust and enduring value. 🔥🏆
2/ The Digital Gold Revolution
Gold isn’t a relic—it's evolved! 🚀 Today, through blockchain tokenization, you can own digital gold that’s 100% backed by physical gold safely stored in vaults. 🏦🔐 This fusion of ancient value and modern tech shows that gold means business, while Bitcoin just tries to copy its legacy.
3/ Concentration vs. Distribution
Check this out: over 90% of Bitcoin is hoarded by a few whales 🐋, leaving everyday holders with crumbs. In contrast, gold’s market has naturally spread out over centuries of global trade. 🌍📈 This organic distribution reinforces stability and genuine market confidence.
4/ Liquidity, Custody & Security
🔹 Gold Is Easy to Custody
Gold is already stored securely in banks and reputable vaults all over the world, and its ownership transfers digitally. You can withdraw or trade anytime without relying on untrustworthy crypto exchanges or wallets vulnerable to hacks . 🔓💼 Meanwhile, Bitcoin’s security is often subject to risks and platform issues.
5/ Real-World Utility vs. Speculative Hype
Gold isn’t just an asset—it’s a workhorse! ⚙️ From use in electronics to medicine and aerospace, gold’s real-world applications generate organic demand. No aggressive, 24/7 hype machine is needed here. In contrast, Bitcoin runs on media-fueled life support, with bots and influencers relentlessly (and tediously) pushing its narrative . 😴📢
6/ Stability You Can Count On
Gold has weathered economic storms with calm resilience 🌪️➡️☀️, proving itself as the ultimate safe haven. Bitcoin, however, is notorious for its wild 80%+ price crashes, making it a volatile bet for long-term wealth preservation. 🏛️💚
7/ Finite Supply: Strength or Vulnerability?
Bitcoin’s fixed supply is often touted as a key advantage. Yet this scarcity makes it vulnerable to manipulation by a few major holders. 😬 Gold, on the other hand, sees a natural and gradual expansion through mining, ensuring a balanced, organic market flow. ⚖️🌿
8/ Institutional Adoption: Not the Magic Fix
State and corporate Bitcoin deals are usually quiet, behind-the-scenes OTC transactions that rarely impact open market prices. 🤫 Gold’s widespread institutional acceptance is built on centuries of trust and real-world use—no constant screaming into the void required. 📣🚫
9/ Gold: No Need for Hype, Just Legacy
Gold stands proudly without the constant need for promotion. 🌟 Its legacy of stability, digital adaptability, and secure custody speaks volumes. Bitcoin, burdened by relentless crypto spam and hype, can only watch from the sidelines. 🎭🗣️
10/ Invest in Timeless Security
When it comes to long-term wealth preservation, gold is your steadfast asset. It offers proven security, with both digital tokenization and secure physical storage, ensuring smooth withdrawals and trades every step of the way. 🏦🔐 Bitcoin, by contrast, survives on a steady diet of media noise and desperate promotions. 🚑🤖
Gold remains the reliable, time-tested choice in today’s fast-paced world of trends and fleeting hype. Whether you’re safeguarding your wealth or seeking an asset that seamlessly bridges digital innovation with physical security, gold’s enduring legacy is the real deal. 🌟💎
If you’d like to explore how tokenized gold is revolutionizing traditional finance or uncover more about its industrial applications and secure custody mechanisms, there’s always another layer of brilliance waiting to be discovered. 🚀🔍
TVC:GOLD TVC:SILVER INDEX:BTCUSD NASDAQ:MSTR NASDAQ:MARA NASDAQ:COIN CRYPTO:BTCUSD CRYPTOCAP:BTC.D

ARBUSDT - This was just the beginning.The upcoming wave will be directed toward all Ethereum-based tokens, with ARB being one of the most significant.
On the 3-day timeframe, you’ll notice it has broken the downward trendline with a giant bullish candle, signaling a trend reversal from bearish to bullish.
It has also formed an inverse Head & Shoulders pattern, a strong bullish signal.
While the long-term targets for this token are insane, I’ll settle for a $2 target—for now.
Best regards Ceciliones 🎯

Ethereum (ETH) XABCD Pattern – $3,000 Target Ahead?ETHUSDT is at $1,759 and we’ve got an XABCD harmonic pattern in play!
▸ From $1,516 (X) to $4,147 (A), then slow retracement to $2,120 (B), then a big spike to $4,120 (C), and crash to $1,385 (D).
▸ Now, the chart is eyeing $3,000 as the next big target!
▸ Watch $2,100 and $2,500 as resistance on the way up. $1,500 is key support – let’s see if it holds!
✉️ What’s your take?
Will ETH hit $3,000, or are we dipping first? Drop your thoughts! ⬇️

Ethereum (ETH/USDT) – Bullish Momentum Building Toward targetHello guys...
Ethereum has broken out of its long-term descending channel and is currently trading inside a smaller ascending channel, showing strong bullish momentum. After a "fake breakout" below major support around $1,400, ETH quickly reclaimed higher levels, suggesting a bear trap.
Currently, ETH is approaching the critical resistance zone around $2,000. As long as the price stays inside this rising structure and continues making higher lows, the bias remains bullish toward a test of the major resistance.
✅ A clear breakout above $2,000 could trigger a stronger move up.
⚠️ However, if the structure breaks down, we should watch for potential pullbacks.
___________________________
Key Levels to Watch:
Support: $1,720–$1,750 zone
Resistance: $2,000–$2,050 zone

Support and Resistance Zone: 2273.58-2359.35
Hello, traders.
If you "Follow", you can always get new information quickly.
Please click "Boost" as well.
Have a nice day today.
-------------------------------------
(ETHUSDT 1M chart)
In order to turn upward on the 1M chart, the price must rise to the Fibonacci ratio range of 0.382 (2674.80) ~ 0.382 (2723.46) and maintain it.
Before that, the key is whether it can rise above the M-Signal indicator on the 1M chart.
-
(1W chart)
The key is whether the price can be maintained and rise above the M-Signal indicator of the 1W chart.
To do so, we need to check whether the price is maintained by rising near the right Fibonacci ratio 0.5 (2295.84).
In order to continue the uptrend in the medium to long term, the price must be maintained above the M-Signal indicator of the 1M chart.
Accordingly, the key is whether the price can rise above the M-Signal indicator of the 1M chart when the price is maintained by rising near the right Fibonacci ratio 0.5 (2295.84).
Therefore, it is expected that a breakout trade will be possible when the right Fibonacci ratio 0.5 (2295.84) is broken upward.
However, since the StochRSI indicator is showing signs of entering the overbought zone, the increase may be limited.
-
(1D chart)
It showed a big rise as it broke through the A section, that is, the 1861.57 point.
In any case, since it is currently below the M-Signal indicator of the 1M chart, we can see that there is still time to buy.
Therefore, as I mentioned earlier, we should focus on finding a buying point when the price rises above the M-Signal indicator of the 1M chart and maintains the price, or when it rises to the Fibonacci ratio range of 0.382 (2674.80) ~ 0.382 (2723.46) and maintains the price.
ETH is in a typical reverse arrangement (M-Signal of the 1M chart > M-Signal of the 1W chart > M-Signal of the 1D chart).
Therefore, we should focus on finding a buying point while watching the situation with a relaxed mind.
If it continues to rise like this,
1st: 2273.58-2359.35
2nd: 2627.18
3rd: 2921.73
We need to check if it can rise with support near the 1st-3rd above.
If not, if it falls, we need to check if it can support near 1861.57.
-
Thank you for reading to the end.
I hope you have a successful trade.
--------------------------------------------------
- This is an explanation of the big picture.
I used TradingView's INDEX chart to check the entire range of BTC.
I rewrote it to update the previous chart while touching the Fibonacci ratio range of 1.902(101875.70) ~ 2(106275.10).
(Previous BTCUSD 12M chart)
Looking at the big picture, it seems to have been following a pattern since 2015.
In other words, it is a pattern that maintains a 3-year bull market and faces a 1-year bear market.
Accordingly, the bull market is expected to continue until 2025.
-
(Current BTCUSD 12M chart)
Based on the currently written Fibonacci ratio, it is displayed up to 3.618 (178910.15).
It is expected that it will not fall again below the Fibonacci ratio of 0.618 (44234.54).
(BTCUSDT 12M chart)
I think it is around 42283.58 when looking at the BTCUSDT chart.
-
I will explain it again with the BTCUSD chart.
The Fibonacci ratio ranges marked in the light green boxes, 1.902 (101875.70) ~ 2 (106275.10) and 3 (151166.97) ~ 3.14 (157451.83), are expected to be important support and resistance ranges.
In other words, it seems likely to act as a volume profile range.
Therefore, in order to break through this section upward, I think the point to watch is whether it can rise with support near the Fibonacci ratios of 1.618 (89126.41) and 2.618 (134018.28).
Therefore, the maximum rising section in 2025 is expected to be the 3 (151166.97) ~ 3.14 (157451.83) section.
To do that, we need to look at whether it can rise with support near 2.618 (134018.28).
If it falls after the bull market in 2025, we don't know how far it will fall, but considering the previous decline, we expect it to fall by about -60% to -70%.
So, if the decline starts near the Fibonacci ratio 3.14 (157451.83), it seems likely that it will fall to around Fibonacci 0.618 (44234.54).
I will explain more details when the downtrend starts.
------------------------------------------------------

ETHUSDT Breakout & Retrace: Watching the $2,200 Buy Zone!Hey Traders,
In today's session, we're keeping a close eye on ETHUSDT for a potential buying opportunity around the $2,200 zone. After trending downward, Ethereum has successfully broken out of its downtrend and is now undergoing a correction. It’s currently approaching a key support/resistance area at $2,200, which could act as a strong retracement level.
As always, trade safe.
Joe

ETH 2000$📈 CRYPTOCAP:ETH Analysis – May 2, 2025
Ethereum is forming a bullish ascending triangle and reacting to the key resistance at 1812, possibly preparing for a breakout.
🔹 Resistances:
1812 USDT 🔼
1910 USDT 🎯
2000 USDT 🎯
🔹 Supports:
1728 USDT 🛡️
1680 USDT ⚠️
1484 USDT ⚠️

ETH to $2100 Looks like the bulls are starting to dominate again, traders! Ethereum has started to rise, Lips crossed the Jaw on Alligator, and AO confirms the bullish sentiment. On top is the Order Block, which acts as a magnet for the price.
BINANCE:ETHUSDT

$ETH Surprised $2.4K Price Mega Big pumping & touch to $3K ✨ CRYPTOCAP:ETH Surprised $2.4K Price Mega Big pumping & Trying to $3K Milestone again.
💫 From Breaking News:
• Ethereum Foundation Invests $32.65M in Ecosystem Growth
• Ethereum To Expand Network Capacity with Gas Limit Increase
Ethereum blockchain is preparing for a major upgrade that could make its network faster, cheaper, and more efficient. Developers have proposed raising the gas limit by 66% in a new development, from 36 million to 60 million units.
This change aims to improve the number of transactions the network can handle per block. This is to help users and developers enjoy smoother and more affordable activity on the blockchain.
Developer Says Testing Success Leads to Mainnet Rollout
Ethereum core developer Parithosh Jayanthi recently confirmed that the upgrade had passed early tests and is now ready for broader use. The new gas limit was successfully tested on the Sepolia and Holesky testnets. According to Jayanthi, the final rollout to Ethereum’s mainnet will begin shortly.
This is the second time Ethereum has raised its gas limit in 2025. The first increase happened in February, when the limit increased from 30 million to 36 million. These changes came after there hadn’t been any gas increase on the network since 2021.
#Write2Earn #ETH #BinanceSquareFamily #MarketRebound #SUBROOFFICIAL
Disclaimer: This article is for informational purposes only and does not constitute financial advice. Always conduct your own research before making any investment decisions. Digital asset prices are subject to high market risk and price volatility. The value of your investment may go down or up, and you may not get back the amount invested.

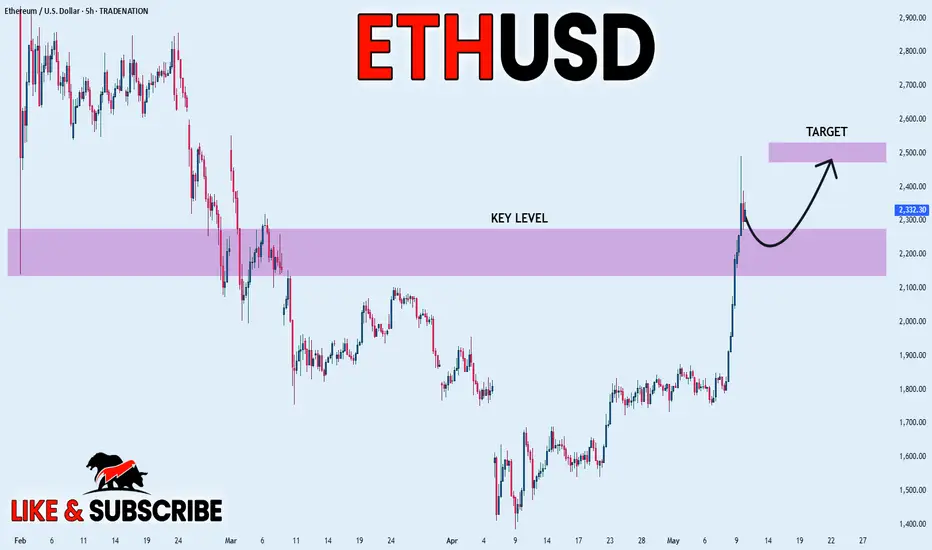
ETHEREUM BULLISH BREAKOUT|LONG|
✅ETHEREUM is growing finally
And the coin broke a key horizontal
Level of 2,200$ and the breakout
Is confirmed so we are bullish biased
And we will be expecting a
Further bullish move up
LONG🚀
✅Like and subscribe to never miss a new idea!✅
Disclosure: I am part of Trade Nation's Influencer program and receive a monthly fee for using their TradingView charts in my analysis.
ETH / BTC Breakout ConfirmedExpect ETH to lead Bitcoin in the near term as the trend has finally reversed on a HTF.
Hopefully this is a sign of a proper Alt season inbound...

Ethereum waking up?One of the most disappointing projects in the crypto space in recent years has to be ETH, losing ground on BTC since September '22. Finally ETH looks to have woken up outpacing BTC this week and broken out from the daily downtrend channel and currently at the underside of the DAILY 200 EMA.
BTC.D has printed a SFP and dropped 2% from 65.4% to 63%, could we be seeing a rollover and rotation into altcoins?
How I see it the moving average should cap off this move for now and a retrace towards the breakout area & previous lower high. That would then be the first higher high and higher low of this calendar year, a very bullish change in structure.
A more aggressive bullish scenario in the short term would be a reclaim of the 1D 200 EMA, leaving the inefficiency zone at the breakout level unfilled.
Either way the next HTF target is $2,800 for ETH which would bring price to the range midpoint and a key supply zone with many resting Stop losses.

ethusd 1400 EOY then bull run to ATH 4500Huge Triangle pattern of ethereum.
If 1400 till end of year will hold could be as simple as in 2023 the start of bull run in 2026 to new ATH at 4500

ETH vs USDT Crypto Heist - Bullish Breakout Plan!🔥 Thief Trading Style: ETH/USD Bullish Heist Plan 🔥
Dear Money Makers & Market Robbers 🤑,
Ready to pull off a master heist in the Ethereum vs. U.S. Dollar (ETH/USD) crypto market? 📈 Using Thief Trading Style’s technical and fundamental analysis, here’s our strategic plan to ride the bullish wave and escape near the dangerous MA zone. Follow the chart, stick to the plan, and let’s secure those profits! 💪🎯
---
📊 Trade Setup: The Heist Blueprint
- Market: ETH/USD (Crypto) 🌐
- Bias: Bullish Breakout 🌟
- Timeframe: 1D (Swing Trade) ⏰
Entry 📈:
- Breakout Entry: Wait for a confirmed breakout above the Moving Average (MA) at 2500. Set Buy Stop orders just above 2500 to catch the momentum. 🚀
- Pullback Entry: For safer entries, place Buy Limit orders at the most recent 15M/30M swing low (e.g., 2450-2475) for pullback opportunities. 📍
- Pro Tip: Set an alert on TradingView for the 2500 breakout to never miss the move! 🔔
Stop Loss 🛑:
- Breakout Traders: Place your Stop Loss below the recent 1D swing low at 2000 after the breakout confirms. This protects against false moves. ⚠️
- Pullback Traders: Adjust Stop Loss based on your risk tolerance (e.g., 1-2% of account per trade). Use lot size and multiple orders wisely. 📏
- Risk Warning: This is a high-risk heist! Manage your position size and stick to your risk plan. 🔥
Target 🎯:
- Aim for 2900 (near the dangerous MA zone, a risky overbought level with potential consolidation or reversal). 🏴☠️
- Escape Plan: Consider taking profits early if bearish signals (e.g., reversal patterns, high volume) appear near 2900. 💸
Scalpers 👀:
- Focus on Long-side scalps using tight trailing stops. Join swing traders for the full heist or scalp quick moves with high leverage (if your capital allows). 💰
---
📡 Why This Heist Could Work
The ETH/USD market is currently neutral with bullish potential, driven by:
- Technical Signals: Breakout above the 2500 MA signals strong bullish momentum, supported by higher lows on the 1D chart. 📊
- Fundamentals: Positive sentiment in crypto markets, fueled by macroeconomic trends and institutional interest (check COT reports for positioning). 📰
- Seasonal Factors: Crypto often sees Q2 bullish runs, aligning with our setup. 📅
- Intermarket Analysis: Bitcoin’s strength and USD weakness could propel ETH higher. 🌎
For deeper insights, review COT Reports, Geopolitical News, and Sentiment Analysis on platforms like Bloomberg or Cointelegraph. 🔗
---
⚠️ Risk Management: Protect Your Loot
- News Alerts: Avoid new trades during high-impact news (e.g., FOMC, CPI releases) to dodge volatility spikes. 🗞️
- Trailing Stops: Use trailing Stop Loss to lock in profits as price approaches 2900. 🔒
- Position Sizing: Never risk more than 1-2% of your account per trade. Stay disciplined! 🚨
---
💥 Boost the Heist! 💥
Support our Thief Trading Style by liking, commenting, and following for more high-octane trade plans! 🚀 Every boost strengthens our robbery crew, helping us conquer the markets together. 🤝 Let’s make money with ease and style! 🏆🎉

Careful with your Crypto BuysWinter is comming
A retracement 2ullback is comming
levels in the chart, nothing goes up forever
