ETH daily trend lines#ETH/USD
$ETH trend lines show:
🐮 price can head up to resistance of cross of ascending and descending trend lines around $3600.
break out from this resistance can increase price to ascending trend line around $3600.
🐻 and rejection from resistance of $3170can drop price to lower trend line around $2650.
Ethereumanalysis

Ethereum: Future Price PredictionHello friends, today you can review the technical analysis on the 1W (weekly) linear scale chart for Ethereum (ETHUSD).
The chart shows only the price and the similarities between the current market structure and price to the prior bull/bear cycle market structure and price.
Each Support and Resistance Trend Line is color coordinated to match the prior cycle to current cycle. Though price may move slightly different, the overall structure looks very similar. It seems that the current price may be headed down to $1,000 - $1,500. To make it easier to follow, I made a pathway in the prior and current cycle. There is a possibility that price could come all the way down to $250 range due to a black swan event, however there are multiple support and resistance zones before that happens.
I am NOT confident that Ethereum price will make an all time high until after the next Bitcoin halving in 2024.
What are your opinions on this?
If you enjoy my ideas, feel free to like it and drop in a comment. I love reading your comments below.
Disclosure: This is just my opinion and not any type of financial advice. I enjoy charting and discussing technical analysis . Don't trade based on my advice. Do your own research! #cryptopickk

ETH trend line and fib levels#ETH/USD
$ETH trend lines and fibonacci levels show that price is at support between 0.5 and 0.618 fib levels.
🐮 holding this support will head up price toward descending resistance around $3300 and breaking this trend line will increase ETH to $3700 and $4200.
🐻 it is possible that price drop more to 0.786 fib level that is the same with ascending support. then increase.
🐻🐻 breaking down from support of 0.786 fib level will drop price to $2000 and lower.

ETHUSD 1 hr - the same line. Across the crypto verse. I like to ask why, about everything. At least for a moment. Why are these prices riding such a fine line. This is why charting helps me. I like to see the pattern of the power keeping the price above the main buy zoe and below the main sell zone. I want to see that development. If thais creates a stability then i want to wonder if that is what the final stage will look like. If so this is closer to the gold pattern. When do the alt coins fall away from the BTC flow. Like copper to gold. Copper fluctuates more because its higher use.

ETH Ethereum: 1H Chart UpdateHello friends, today you can review the technical analysis idea on a 1H linear scale chart for Ethereum (ETHUSD).
Ethereum price looks like it may be headed back down from the current price. Keep an eye on my Support and Resistance Trend Lines. The Fibonacci Retracement shows price has possibility getting back to the 0.382 level. There is also Ichimoku Cloud resistance ahead.
If you enjoy my ideas, feel free to like it and drop in a comment. I love reading your comments below.
Disclosure: This is just my opinion and not any type of financial advice. I enjoy charting and discussing technical analysis . Don't trade based on my advice. Do your own research! #cryptopickk

ETHUSD Dominant Trendline and MA ContinuationConsider that the dominant trendline hasn't been broken yet
A bullish attempt has already been seen at this Trend Line
Also the wedge that the price has provided us is quite a large range, providing a possibility of a huge price increase, comparable to the one seen in 2021 May
The 200MA wouldn't have to curve much to begin to rise again
A great long entry point

Ethereum: Bears In Charge 🐻The bears are in charge! They have already dragged Ethereum below the mark at $3412 and – after some recreational sidewards movement – even further down. Soon, they should reach the support at $2306 and lead Ethereum below this mark as well to finish wave v in orange. However, we must keep in mind the 42% chance that the bears could lose control so that Ethereum could escape above $3412 and into the blue zone between $3512 and $4559.

ETH pull back to broken triangle#ETH/USD
$ETH reached the triangle target and now is in pullback to triangle again.
🐻 price can drop to descending support line that is the same with support zone around $2800

ETHUSDT LongHey traders, in today's trading session we are monitoring Ethereum for a buying opportunity around 3190 zone, once we will receive any bullish confirmation the trade will be executed.
Trade safe, Joe.

ETH reached strong resistance#ETH/USDT
$ETH reached a resistance zone that make it strong by being the same with 0.5 fib level of last weekly swing down and ascending trend line.
🐮 break out from ascending trend line can head up price to make a new ATH.
🐻 rejection from this zone can drop price to support zone between $3350 and $3050.

ETH USD ANALYSISEthereum looks bullish to me. We are creating higher highs, and we already have a minor correction. But, according to other altcoins and sentiment, we can go higher to $3570.

ETH Ethereum: 1M Chart ReviewHello friends, today you can review the technical analysis idea on a 1M linear scale chart for Ethereum (ETHUSD).
Ethereum price on a monthly chart show resistance ahead with support below. Fibonacci Retracement levels shown along with 200 SMA and RSI.
If you enjoy my ideas, feel free to like it and drop in a comment. I love reading your comments below.
Disclosure: This is just my opinion and not any type of financial advice. I enjoy charting and discussing technical analysis . Don't trade based on my advice. Do your own research! #cryptopickk

ETHEREUM LONGHey traders, today we are monitoring ETHEREUM for a buying opportunity around 3.3k zone, once we will receive any bullish confirmation the trade will be executed.
Trade safe, Joe.

Ethereum in a parallel channelEthereum has been consolidating in a ascending parallel channel in a 4-hr time frame.
There is a negative rsi divergence there.
We may short Ethereum once the parallel channel breakdown.
Support/target levels or there on the chart.
Can wait for a entry, Once it retest the parallel channel support we can enter the trade and hold it till our target price.

ETH Ethereum: Doesn't Look GoodHello friends, today you can review the technical analysis idea on a 1D linear scale chart for Ethereum (ETHUSD).
Ethereum price looks like it is headed back down from the Support and Resistance Line. There is a rising broaden wedge forming as well.
If you enjoy my ideas, feel free to like it and drop in a comment. I love reading your comments below.
Disclosure: This is just my opinion and not any type of financial advice. I enjoy charting and discussing technical analysis . Don't trade based on my advice. Do your own research! #cryptopickk

Ethereum: Snake Charmer 🐍Like a snake captivated by a snake charmer, Ethereum is sprawling upwards to the resistance at $3412. There is a 38% chance that Ethereum could be enthralled enough to cross this line immediately. However, we rather expect it to coil up in the orange zone between $2402 and $1861 to finish wave ii in magenta a bit deeper, before darting upwards above $3412 and higher still.

ETHUSDT LongHey traders, Above is a technical overview on ETHEREUm and the most important levels to watch for long and short.

Ethereum Prediction H4Here is my view for ETHEUR on H4. The price should go up, you can put a pending order on the Order block or find an entry on LTF within OB Zone. Trade Safe!

Ethereum Prediction H4Here is my view for ETHUSD on H4. The price should go up, you can put a pending order on the Order block or find an entry on LTF within OB Zone. Trade Safe!

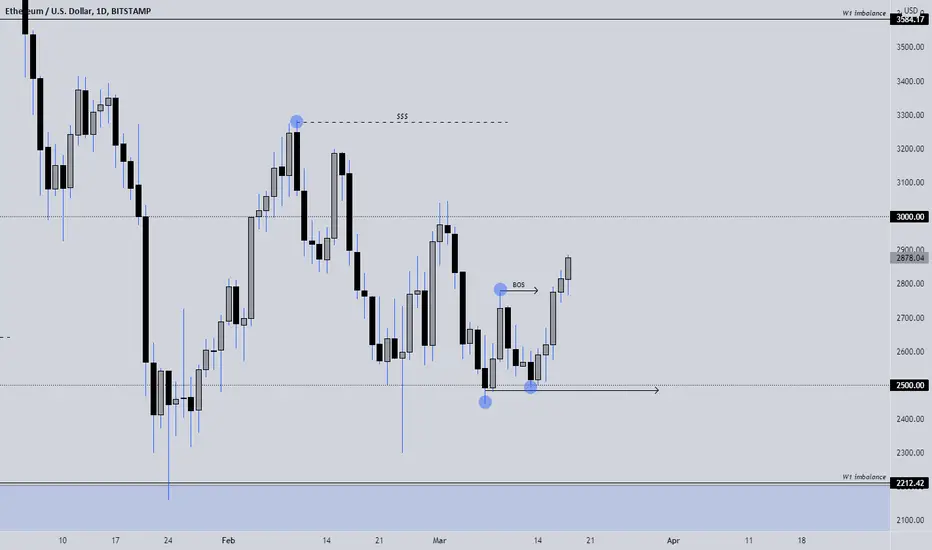
ETHEREUM LONGS 📉📉📉📉 Expecting bullish price action on this asset as price made a bullish BOS (break of strucutre) meaning the trend was shifted from bearish into bullish near the institutional figure 2500 that acts as a valuable area of SUPPORT for the price.
I think we will see in the next days or week the liquidity area above 3300 hit.
What do you think ? Comment below..
ETHEUR Prediction H1Here is my view for ETHEUR on H1. The price should go up, you can put a pending order on the Order block or find an entry on LTF within OB Zone. Trade Safe!

ETHEUR Prediction H1Here is my view for ETHEUR on H1. The price should go up, you can put a pending order on the Order block or find an entry on LTF within OB Zone. Trade Safe!

ETH triangle#ETH/USD
$ETH is inside triangle and above lower line.
🐻 if price break down from lower line the target of triangle is around $1700.
🐮 and if hold the lower line it will head up to upper line around $3000 and break out the upper line will increase price to $3500.
