Ethereum Set To Outperform BTC!!Checking out Ethereum vs Bitcoin on the daily timeframe we see a confirmed Bullish Divergence! This pattern signals a reversal coming ETH, we have been in a clear short term downtrend from the highs in the beginning of september and we are finally set to explode against BTC, pair this with Bitcoin dominance starting to slide we could be looking at a mega run for the altcoins! We are currently holding the 0.3 FIB level and we do have support from the bollinger bands midline right below the 0.3 FIB. Something else to take note of is we are pretty close to that top bollinger band and i think if we see a grab onto here we could be sent flying to upside taking out key resistance on the way! Any way you want to look at this bullish divergence it is very very clear, we have been seeing multiple lower highs on price action shown by the green trendlines, we have them from the beginning of september all the way until now! Now that we just got confirmation from the stoch RSI we are set for a massive breakout to the upside in a matter of time, The way you can find divergences is simply by seeing lower highs on price action or higher highs or higher lows or lower lows and then seeing the opposite on an oscillator, i personally like using the stoch RSI. Basically if you see a uptrend line on price action and a downtrend line on the oscillator or vise versa, but keep in mind there are different meanings for each divergence so that is up to you to find out which one you are seeing! Taking a look at the MACD we are seeing on the histogram yet another increase for our daily bar which is a good sign and shows growing bullish momentum, we want to see this continue for that reason, if we do see a decline a bearish cross looms but always remember there is a chance it is a fakeout and we could see a rebound with another bull cycle on the MACD, Notice the MA's we are seeing good separation with the blue continuing to push upwards and moving further away from the orange MA, we also want to see this continue to play out because it lessens the chance of a near term bearish cross and it also shows an increase with the bull momentum! We have many targets we could talk about but the main one for me that i will talk about in a later TA when we actually see a breakout is the highs we saw at the beginning of september, this reversal along with the grabbing of the top bollinger band could most definitely send us up that far but that will be for a later TA as we still have a ways to go! But things are starting to look very very good for ETH and the altcoins and i woulnd't be surprised if we saw a mega altseason coming up in the near future! Not financial advice just my opinion!
Ethereumanalysis

ETH #ETH Ethereum Log Chart $24K incoming?This is a monthly chart on a Log scale for Etherum for three cycles. I included in Fibonacci patterns as well as taking into account days. Drop in a comment and I will surely give you my feedback. I am unsure if it is all too possible but $24K ETH to USD seems to be coming soon. Something is brewing for sure. Disclosure: This is just my opinion and not any type of financial advice. I enjoy charting and discussing technical analysis . Don't trade based on my advice.

Ethereum Climbing Back Up!!Since we were trading withing the bullish triangle a little while ago i talked about some very nice looking upside on the horizon and we have seen just that with a strong breakout and a steady climb back to the upside! PS. This drawing was not the Bullish triangle i am referring too i erased it to clean up the chart a bit, we have taken out the 0.2 FIB level and we have had multiple retests with us being successful everytime, another key level we have successfully regained is the 3667$ and again we have had multiple retests succeeding. The next big test we are facing is the 4k level or aprx 3990-4000K level we have had one touch so far and we're rejected but we are still looking strong and seem to be taking a little cooldown resting on our current support level until we make our next move upwards! We also have uptrend support coming from around 2800$ and we have respected it all the way up till now, i see us holding onto this level following it upwards and ultimately i am looking for a reentry of our ascending channel shown above and then eventually the 0 FIB of course coming from our ATH! Looking at our Bollinger bands we seem to be inna very nice spot with price action well above the midline and not far away from that top band, i think we could be in for a rollercoaster ride up the top BB since we have not seen one in quite some time and we keep on wicking too the very top, likely just a matter of time before we have a nice upside day then eventually grabbing onto that top band taking it for a ride likely up towards that 0 FIB level, if the momentum is there i don't see us having too many problems shredding through this level and creating a new ATH and aswell entering price discovery mode! Looking at the Reversal Momentum Indicator we are in a slight downside right now but we see the orange curling heavy to the upside and coming towards the blue, we don't want too see a bearish reversal with the blue going under the orange but we could definitely see a little fakeout where we get a nice bounce off of the orange to continue this upside climb! Checking out the ADX we are looking good and seem to have found some footing a decent bit below our previous high, we are starting to turn to the upside with the direction looking to start an overall reversal after having some significant downside. A must watch for Ethereum is price action grabbing onto that top bollinger band, the RMI getting a bounce and keeping the blue ontop, and aswell the RSI which isn't currently on the chart, we need to stay above the midline to continue the uptrend, we are significantly above the midline currently near the top of the zone so thats why i decided to leave it out of this TA but always keep an eye on that! Not financial advice just my opinion!

ETH a strong position and an attempt to break through a new pricETH currently has a strong position with no major price fluctuations, it looks like the new price level could be broken in the near future, but everything will depend on BTC and its behavior

ETH dominanceETH dominance potencial forming triangle and if make a push up and support it then this scenario is valid

ETH is readyI am not sure, what all of you are you waiting for?
I told you a month ago, and tell you now again. Eth is screaming buy me.
Beautiful I Head n Shoulder. Right on the neckline...i will buy the breakout and load up on the retest. Target 4700 in the short term. Last target of this bull run 21k. You know it!
FOLLOW ME, SHARE, LIKE AND COMMENT

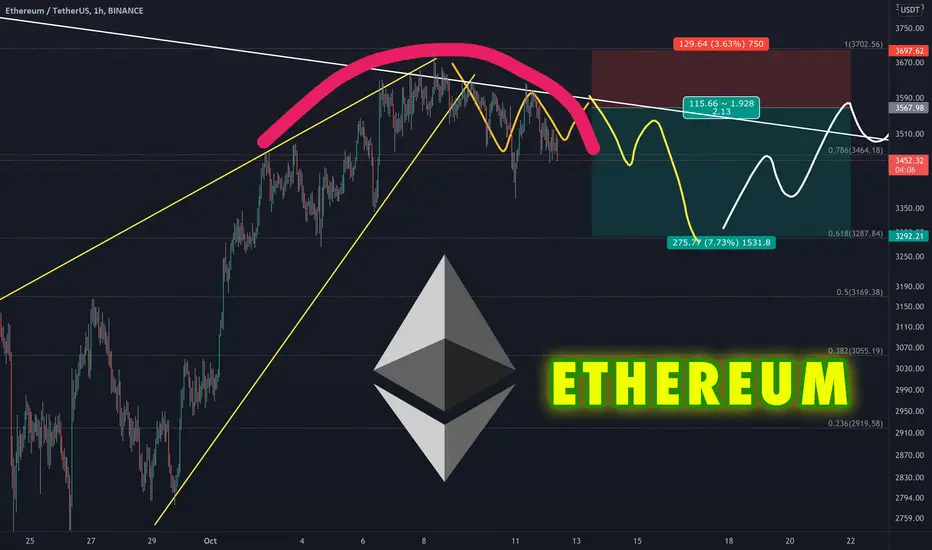
Ethereum trending lower. Intraday setupHello, this is an ETHUSDT short-term setup. It appears that the price will drop below the current trend line (white) once more, with a probable rebound in the next days.
Profits should be taken at 3300, with a stop loss at 3700.
DYOR
Ethereum Daily ChartWe saw the Ethereum movement on the Weekly chart and the rejection from the levels of 85% FR at the numbers of 3970 and then the Crypto currency made its retracement before the Bitcoin therefore we expect consolidation movement before the continuation of the Downside trend
from that approach we can position our sell limit orders at the numbers of 3850 with our stop losses above the highest high as usual at 4800 and regarding our targets they will be as shown on the charts with our first target at the number of 2651 and then we might see movement to downside till the numbers of 1730
use strict money management
don't move or remove your stop loss
Trade safe

Ethereum- Correction to 3150?After breaking above 3150 confluence resistance, EthUsd has risen more than 10% and has riched 3500 important zone
The last leg up is without much power and the new recent high is marginal, and this can mean a correction could follow.
The price back under 3450 would signal the start of this correction and EthUsd can drop to 3150, now support

Ethereum Big Upside On The Horizon!!Ethereum recently had a very strong breakout of this pennant and has been pushing the 0.2 FIB for the last 4 days, we want to continue to see momentum pushing upwards and ultimately a daily close above the 0.2 FIB at some point soon, none the less we are looking very good and very bullish! A daily close up and above the 0.2 FIB opens the door back up for us to regain the ascending channel which we fell out of somewhat recently and also as i said opens the door for big upside! Taking a look at the Wavetrend we are just starting to pass the midline and still have quite a bit of room to keep pushing up, and we are showing no signs of stopping, we see the red crosses are below our wave pushing us upwards with bullish momentum and we want to keep seeing our wave push vertically, lessening the chance of us having a bearish crossover and ultimately ending our current bullish wave. Now lets take a look at our squeeze momentum indicator, just today we have crossed over the midpoint and putting out our first green bar in quite some time and after a long drawn out bearish period! Things are really starting to look good, noticing the black crosses which indicate a current squeeze we haven't seen any grey crosses in awhile showing a squeeze release, all this momentum building up could be absolutely huge for Ethereum, once we see those grey crosses and more green bars we likely will be on the verge of a huge run upwards, just like what we saw nearing the end of July, we had a decent red period squeeze and shortly after we turned bullish we got that squeeze release which sent us flying as you can see in the ascending channel. (Remember, keep an eye out for those grey crosses) Now lets look at the ADX or the average directional index, we have been seeing a bigger downslope in the ADX but i have some positive news, it looks like we are catching some longterm support here and we are seeing the ADX starting to curl upwards which is a very great sign! If we can get a bounce off here we could be looking at the next upside "wave" for Ethereum, all things are pointing to this happening, and keep in mind this indicator is very smooth and we don't see any jagged movement or sharp turns up or down, its a gradual move and we could be seeing the beginning of that big move! Not financial advice just my opinion!!

Ethereum Analysis BINANCE:ETHUSDT
Hello dear traders
if the Ethereum is on the support zone, if it manages
to breaks the this support zone then it can fall to
its previous ceiling and completing its pullback
but if it fails to breaks the support zone then
it can rise to the top of channel.

Ethereum Looking very Bullish!!A little bit ago i posted a TA on ETHBTC and we were trading inside of this descending wedge which is a very bullish pattern and i talked about seeing an upcoming breakout and that is exactly what happened! We are starting to gain some nice momentum coming out of this falling wedge and we are coming up on some very important daily closes for ETH against BTC! We are getting a little stuck right underneath this resistance line at aprx 0.0714 and the reversal pivot point just above there, if we can successfully see a strong push above both of these levels at some point soon we can expect Ethereum and altcoins to really start to move, a close above the pivot point in the coming days is key for us, we will likely see a reversal back into an uptrend coming out of our current short term downtrend. Looking at the bollinger bands we have regained a crucial level and that is the midline on the bands, we definitely want to stay above here and keep this level as support and this opens up the window for us to keep moving strongly upwards and eventually getting to that top band, whenever we see price action up and around the top band there is a high chance we grab onto it and go for a big move to the upside, but that'll be for a future TA as we got some work to do before we see that happen. Now checking out the RSI, we have slightly broken up and above the midline after remaining below in a confirmed short term downtrend for a week or two, we want to make sure to hold this level and even see a retest and be successful before really jumping the gun, but personally i think we are going to see at some point soon some big rallies in the overall crypto market, i believe its just a matter of time everything all around is looking pretty great and if you havent already i highly suggest checking out my recent BTC.d divergence TA's! There is something huge coming! Not financial advice just my opinion!

ETHEREUM , Full Analysis (short-term to long-term)hey guys , the whole analysis is here in the description. make sure you read it all . so let's get it started !
we start with longer terms :
this pic is for the ones who are looking for a LONG-TERM analysis , so it'll probably take 1 and half to 2 years for ETH to get there. as you see , Ethereum could be repeating the cycle . I marked two red zones for y'all . both have descending channel and ETH seems to be repeating that pattern again . alrighty , let's move on to the next pic !
so here's our elliott waves ,we had the first two waves . the second wave which is a correction wave is completed and the third wave is already started . so what is our TARGET here ? it's easy to find out the target , just by Fibonacci Extension . and well , 10774 $ is our target and that is when the third wave is probably gonna end . "so 1 question , Armin . when should we buy it ?!" -----> next pic !
as yall see Ethereum broke outta the descending channel and price has gone up a bit . so price is in a triangle . bearish or bullish ? I say bullish due to all of these analysis , but those who wanna buy for the long-term , it's better for the price to break the red line and that's when it's confirmed that it will rise the way I told in the previous pics. so WHEN TO BUY ? after the red line breakout. "Armin , no short-term analysis ?!" , dude wait , check the rest .
alright , in this pic the price has met the MA50 , and I'm guessing it'll have a little correction and then go back up ! what are the targets for short-term ? the red zone and then the red line that we talked about earlier.
and at the end , here we are with 1H timeframe. there are two waves that I drew , it's simple . either it will break the top of that little triangle and rise after it OR as I said in the previous pic , it will break the bottom and rest a bit and then go back up.
So guys this was the full analysis of ETHEREUM , if you liked it , hit the like . and if you wanna see some more , follow !
GoOoOod LuUuUucK !

Ethereum ready to take off!!?Looking at Ethereum vs Bitcoin we see a clear descending wedge which is very bullish in itself and as you can see to the left of our current wedge we had another descending wedge which blasted us upwards once we brokeout. Think we are looking very good overall and wouldn't put it past ETH to pull this off again! We have a very heavy support area below us shown by the rectangle, we have the pivot point which acts as support and then aswell as the bottom of the wedge which is also support, on the other hand though we do have a fair amount of resistance above us, the top of the wedge, the 0.2 FIB level, resistance at 0.0741 sats and then the R1 resistance. the beauty of this and the positive is the fact that we have had quite the correction and cooldown across the whole market and plus once we do start to see bullish momentum it is going to be explosive, plus don't forget the very bullish pattern we are currently in, once we start to take off i would say we can most likely easily blast through most of these levels because they are so close, and i would expect us to reach the R1 level before we start to see some pushback from the bears, even at that point though i think we could shred right through there after a couple attempts at the level. Looking at the MACD we are seeing a steady decline in the red bearish bars day after day and thats exactly what we want, bearish momentum draining out and giving the bulls that chance to really takeover. On the MA's we are seeing them getting pretty close together which is a good sign, meaning we are getting closer to a bullish cross, however there could still be a couple or few more days of decline due to the fact that the blue MA is slightly turning to the downside. The Wavetrend overall looks great, we are nearing the bottom zone which is the buy zone and we are seeing what looks like a sort of bottom out from this downtrend wave, like i said with the MACD we could still see a bit of a decline on the wavetrend but i really doubt we go much further, we want to keep an eye on those red crosses and as you can see we are pretty close to getting them underneath our wave to start giving us that push back up! Not financial advice just my opinion!

ETHUSDT 4HR TimeframeSNIPER STRATEGY (new version)
It works ALMOST ON ANY CHART.
It produces Weak, Medium and Strong signals based on consisting elements.
NOT ALL TARGETS CAN BE ACHIEVED, let's make that clear.
TARGETS OR ENTRY PRICES ARE STRONG SUPPORT AND RESISTANCE LEVELS.
ENTRY PRICE BLACK COLOR
TARGETS GREEN COLOR
STOP LOSS RED COLOR
DO NOT USE THIS STROTEGY FOR LEVERAGED TRADING.
It will not give you the whole wave like any other strategy out there but it will give you a huge part of the wave.
The BEST TIMEFRAMES for this strategy are Daily, Weekly and Monthly however it can work on any timeframe.
Consider those points and you will have a huge advantage in the market.
There is a lot more about this strategy.
It can predict possible target and also give you almost exact buy or sell time on the spot.
I am developing it even more so stay tuned and start to follow me for more signals and forecasts.
START BELIEVING AND GOOD LUCK
HADIMOZAYAN

Ethereum New ATH!??Ethereum has been holding up very well during this pullback with us still able to hang onto some key levels, including this ascending channel, we are currently sitting on the bottom of the channel holding on strong and i think the market is starting to rebound, if you take a look at my last TA talking about the BTC hidden bullish divergence the same thing actually applies to Ethereum currently, ill let yall check that out for yourselves, refer back to my BTC TA and throw on the Stoch RSI on Ethereum and see if you can find it. Other than the divergence the market i think is ready for another leg up since we just saw a significant healthy pullback. Some key levels we are looking at here are the 0.2 FIB which we need to break soon, the R1 resistance slightly above the 0.2 FIB and the midline coming from the bollinger bands which is currently acting as resistance, if we can get above atleast the 0.2 and the BB midline we are going to be looking super bullish and the good thing is they aren't far away at all so our indicators like the MACD and RSI will barely be affected by a move like this. On the RSI we slightly took a dip below the midline but barely really an we are now seeing some upwards direction here with us just right underneath this midline, i think we aren't going to have any problems getting above here with ease and we can continue our confirmed uptrend! Also gotta keep an eye on ETH's Domiance in the market, we have had significant upside in the dominance and that definitely correlates with the big upswings in price action, we are likely going to see another big pump in price action and dominance level we are seeing respect on this uptrend support line and i think even if we fall a little bit more we are likely going to get a nice bounce which afterwards i would expect us to have a solid move to the upside! And remember ETH's dominance is a big deal with the Altcoins the higher ETHs dominance goes the more altcoins will follow ethereum rather than BTC! Not financial advice just my opinion!

ETHUSD Demand !Ethereum can be seen undergoing huge demand
This is demonstrated on the Weekly chart by these long wick ends
Price has consistently been pushed up before candle close
This shows demand throughout this price area
Coupled with a large support area, I expect bullish continuation on the Weekly timeframe based on this observation

The fractal everyone is talking about ETHUSDClear similarities both in price action and in MACD setups
Ethereum right now has a strong bottom setup and will likely hodl this bottom, leading to the bull part of this scenario with the ~200% increase
I have seen versions of this across twitter and Facebook and thought I would address it for my followers
I aim to exit mid next year at by then 8k or higher

Ethereum Bull DivergenceBull divergence can be seen on chart and indicator
Price prints a lower low
while indicator prints higher low
This is the 4Hr chart for ETH


LONG ETH BECAUSE OF HEX COIN 40% INTEREST PER MONTH. + MOREETHEREUM IS ON IT'S WAY TO $4500 BECAUSE OF THE CREATION OF THE CREATION OF THE NFT MARKET AND CHARGING FOR THE ERC 721 PROTOCOL. Also because they are moving to Proof of Stake. Proof of stake means liquidity on the blockchain. ETH is growing because of the growth of HEX COIN blockchain that is paying 40% to lock a stake which is on the ethereum platform. We are headed for a world without end with Platinum bars and a gold pyramid. Just like the pyramids of ancient Egypt were telling us. BLOCK chain technology is here to stay, we may walk into the gates of heaven with the return of G-D in this lifetime. We are very close to having all of our dreams come true. All you must do is simple, be a good person and believe in a higher power greater than yourself who made this. That is all you have to do. Then you can find shelter under his umbrella ay ay ay

Ethereum making head and shoulder patter and consolidating aftershort after confirm breakout of consolidated area.
can show big downside move.
1st target is small though can take support there but if it breaks 3690 levels than 100 points target can be achieved

ETHEREUM - Bullish Flag After Major BreakoutVery Bullish signs from ETHEREUM.
Further to our post earlier today, the price has broken over resistance and is now breaking over a bullish flag.
Expect anything but this is more Bullish now and most likely to rise.
One Love,
the FXPROFESSOR
