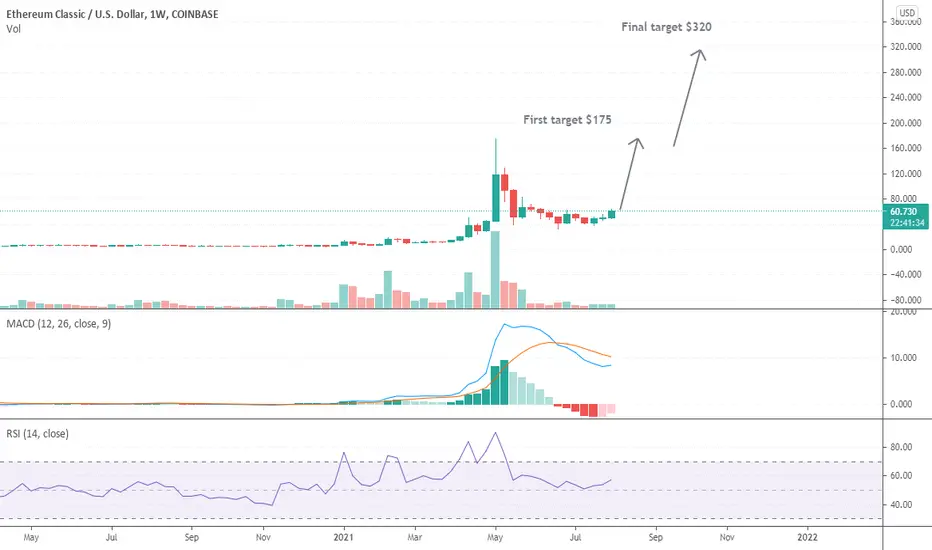
ETHEREUM CLASSIC, a long term vision. ETCUSDTHello my friends, A multi timeframe analysis of ETC and a long term vision for investment. We have a beautiful W pattern which the price broke the neckline and retesting it. you can consider it and the price actions in the circles to buy it. Good luck
If you like the idea, do not forget to support with a like and follow me for next analysis :)
Write your comment and opinion below for me
Ethereumclassic

Eth adjustments After breakdown from 3300 lvls
3218 - 3160 is acting as (0.6 & 0.7) fib lvls
As it was previous key level's
Therefore they are still important to track
On 4h tf : if 3160 is taken down (2980) maybe possible level,
4h currently shows it has created higher high and lower high considering last two swings
Price seems to taking support on ema 50 on 4h chart

Ethereum: still bullishTechnical analysis Ethereum
Ethereum (ETHUSD) was able to continue its rally from the central support zone at USD 1,700 / 1,730 and work off and overcome the target zone we were targeting USD 2,847-3,000. Most recently, a sideways consolidation between around USD 2,950 and USD 3,340 has shaped the share price. At the start of the week, the coin hit a 3-month high at USD 3,381.
Cops have an advantage
In terms of extent, the breakout from the youngest range cannot yet be qualified as sustainable. However, we believe the technical bias will remain immediately bullish as long as the support at USD 3,127-3,177 is not undercut. If the price can establish itself above the USD 3,400 mark in the coming days, the breakout would be confirmed. If successful, our next target price is USD 3,570. In addition, the analytical minimum price target of the range breakout at USD 3,690 would come into focus.
Catchment areas
A slide below critical support at $ 3,127-3,177 would negate the breakout. In this case, the resulting false breakout would bring immediate downside risks towards the lower limit of consolidation at USD 2,950. However, the technical picture would only deteriorate significantly below the broad support zone at USD 2,850-2,950. Then a price setback in the direction of USD 2,410-2,460 would be expected.
Note:
Despite careful analysis, Global Investa accepts no liability for the content, topicality, correctness or completeness of the information provided. The information provided does not constitute investment advice, purchase recommendations or investment brokerage.

Eth breakout and retestSince few days eth was consolidating and had 3280-3300 as a resistance
This lvl has been broken and retested today !
Eth has setup to another move forward If there is no uncertain event
Our long target of 3900 is still intact
There is no specific stop loss but I'm following daily market structure based on it will look forward to accumulate rather than profit booking
The upcoming lvl will be choppy as many trapped retailers will try to get out from higher lvl and getting the cash in hand so it better to be flexible rather than tight stop loss

Eth enjoying my levelsAs analysed from flag and pole post
To consolidation to penant
To support halting levels
Eth is going good for me
Just crossed all recent highs
Let's wait and see how it sustain that 3300+ levels

ETCUSDT 1D TF : Long or what ??As we can see, after breaking its downward trend, the price is gathering strength to start a strong climb.
In order to buy, the SL (stop loss) and capital management must be observed.
All resistances and TPs (take profits) are marked on the chart.
(DYOR)

Who's down for a game of Peek-A-Boo?!?!? ETCUSD Hello Trading View Community,
Looks like ETCUSD is playing a game of Peek-A-Boo using the current resistance zone to hide and reveal itself .. If ETCUSD can manage to overcome this level, 0.382 Fib zone could be the next target zone. Keep in mind this is the 4th attempt in 7 days trying to peek above current resistance zone, if it fails we could see price drop back down to the mid/low $50s.
Thank you guys for checking out this idea on ETCUSD. If you find this analysis useful, support with a simple "Like" or "Follow".
Trade carefully and remember these are just ideas, not trading advise.

ETC $100+ This CycleEthereum Classic looks just like the leading coins in terms of chart patterns. ETC wants to take another run up towards its local high just like other big projects are doing right now such as ADA, SOL.
ADA is coming up towards $2.30 and SOL is heading upwards to $55.
ETC bottomed out along the $38 level which was the swing high found in April right before the pump from $38 - $148.
This time it has slowly been gaining under our noses and recently bounced off of $59 to hit $73.
From here, i'm expecting a little bit of a pullback before we continue climbing upwards towards the $93 - $95 take profit zone.
ETC is going to come back up and hit its local high this year on this upcoming parabolic cycle and find new highs after reaching $148+ in the price discovery zone at that point.
As always please do your own research, I am not a financial advisor.

I told you etc is gonna fly🤩🚀Exactly as i told you in previous post linekd below etc has started its parabolic rising. In few ours we made a lot of money 💵


I'm back again with introducing a new rocket 🚀 In previous post i talked about ripple(the post linked below) and you saw how ripple did its best even while bitcoin is going down. Now i wanna tell you about new rocket that will be launched soon.
ETCUSDT or ethereum classic don't miss it guys i see lots of profits on daily chart!

Ethereum classic will go to $1000. |April 2022| Greed 1You can visit my profile and see why fund managers always win.
I give the date. If the regulation is realized,
we will have a double feast. these amounts are possible.
It is easier to develop than bitcoin and ethereum.
mining services are on the rise.
My minimum estimation is between 400-450 dollars.
I think it will take place effectively in the regulation.
It will bring huge profits.
I have no doubt that the new rich will give birth to billionaires.

ETC Breakout And Retest Done !Another bullish pattern in the ETC chart. Breakout and retest have been already done. Buy it with low risk and hold it with patience.

Ethereum Classic ETC - MASSIVE parallel channel + TRIANGLE!- We have a huge parallel ascending channel on the daily chart, which provide us with great support/resistance!
- Bullish volume is much higher, than bearish volume!
- Ascending triangle is also very bullish!
- The price is above 200 daily moving average.
- For expected duration of the trade, probability, stop loss, profit target, entry price and risk to reward ratio (RRR) - please check my signature below ↓
- If you want to see more of these ideas, hit "Like" & "Follow"!

ETH bullish run#ETCUSDT
$ETC touched the half of yesterday bullish master candle, it seems wanna go up to touch $75 so soon

ETC to test ATH soon?Weekly MACD bullish cross-over forming.
ETH now PoS, ETC hashrate increasing... does higher demand = higher price?
Many people missed the first ETC rally.
Could go huge......
ETC.USDT (Y21.P5.E1).Looking for the entryHi Traders,
Here is a tip if you already missed this initial buy,
Cheers,
S.SAri

ETC 144$ +1000$ Colecting Ok. Don't mind the price, collect it. It's not easy to have $1000.
His target is $1000. We are collecting.
We do not go back on our word.
Remember to look ahead when the shaking is over.
We will accelerate the trend.
Not investment Area.
Not investment idea.

Update 3940$ ETHEREUM +7000$ expectationI'm not fomo, I'm telling you what happens, the first target is here, then when it breaks it can go up to the $ 7000 band. Beware of Bitcoin.
Ethereum Greed. Ethereum Ultra Bullish.
ETH/BTC Bitcoin short.
Not investment area
I have already said that ethereum will be number 1, it will go to $ 7000 first and then to $ 10,000.
not investment idea.

ETHEREUM: bulls forwardTechnical analysis of Etherum
As part of the steep rally from the central support zone at USD 1,700 / USD 1,730, Ethereum (ETHUSD) was able to overcome the several-week downtrend line and then the horizontal resistance zone at USD 2,410. This means that the price targets we had set in the event that the USD 2,050 mark was exceeded have not only been achieved, but have already been exceeded. The sustained overcoming of USD 2,410 led to a further brightening of the technical starting position. The price is currently in a relevant resistance zone in consolidation mode below the last marked 8-week high at USD 2,699.
In consolidation mode
In view of the overbought technical market indicators, the breather could extend in terms of time and price. Below the previous consolidation lows of $ 2,507, we would consider at least a test of the $ 2,410-2,464 zone likely. Below that, there would be short-term downside risks towards USD 2,317 and USD 2,108-2,151. Only below the latter support region would our preferred scenario of further rising prices be called into question. It would ultimately be negated with a slide below USD 1,997.
Where is the journey going?
The central resistance zone at USD 2,847-3,000 is currently acting as a possible target price on the upside. Pricing confirmations for an advance on this hurdle would be in a rise over the next barriers at USD 2,641, USD 2,666 and USD 2,699. From an opportunity-risk perspective, however, we prefer new investments into price weaknesses.
Note:
Despite careful analysis, Global Investa accepts no liability for the content, topicality, correctness or completeness of the information provided. The information provided does not constitute investment advice, purchase recommendations or investment brokerage.

Ethereum- small triangle for continuationAlthough I think the rise from 1700 is just a correction to the overall bear trend, short-term speculators can find a good buy opportunity now, with EthUsd forming a continuation triangle.
2800 and above is strong resistance and only price under 2500 would negate this scenario

Ethereum Classic (ETC) - August 3Hello?
Welcome, traders.
By "following", you can always get new information quickly.
Please also click "Like".
Have a nice day.
-------------------------------------
(ETCUSD 1W Chart)
If the price maintains above the 16.722-25.179 range, we expect the uptrend to continue.
In particular, if the price is maintained above the 42.100-47.296 section, it is expected to create a new wave.
(1D chart)
If the price is maintained in the 47.947-69.480 range, it is expected to turn into an uptrend and rise.
If it goes down from the 37.180-47.947 range, you can touch the 16.722 point, so you need to trade cautiously.
-------------------------------------
(ETCBTC 1W chart)
If the price holds above the 0.00097 point, it is expected that the uptrend will continue.
In particular, if the price is maintained above the 0.0013736 point, it is expected to create a new wave.
(1D chart)
If the price is maintained in the range of 0.0012739-0.0016415, it is expected to turn into an uptrend.
If the decline from the 0.0012739 point, you can touch the 0.0007226-0.0009064 range, so you need to be careful with your trades.
------------------------------------------
We recommend that you trade with your average unit price.
This is because, if the price is below your average unit price, whether it is in an uptrend or in a downtrend, there is a high possibility that you will not be able to get a big profit due to the psychological burden.
The center of all trading starts with the average unit price at which you start trading.
If you ignore this, you may be trading in the wrong direction.
Therefore, it is important to find a way to lower the average unit price and adjust the proportion of the investment, ultimately allowing the funds corresponding to the profits to regenerate themselves.
------------------------------------------------------------ -----------------------------------------------------
** All indicators are lagging indicators.
Therefore, it is important to be aware that the indicator moves accordingly with the movement of price and volume.
However, for the sake of convenience, we are talking in reverse for the interpretation of the indicator.
** The wRSI_SR indicator is an indicator created by adding settings and options to the existing Stochastic RSI indicator.
Therefore, the interpretation is the same as the traditional Stochastic RSI indicator. (K, D line -> R, S line)
** The OBV indicator was re-created by applying a formula to the DepthHouse Trading indicator, an indicator disclosed by oh92. (Thanks for this.)
** See support, resistance, and abbreviation points.
** Support or resistance is based on the closing price of the 1D chart.
** All descriptions are for reference only and do not guarantee a profit or loss in investment.
Explanation of abbreviations displayed in the chart
R: A point or section of resistance that requires a response to preserve profits.
S-L : Stop Loss point or section
S: A point or section where you can buy to make a profit as a support point or section.
(Short-term Stop Loss can be said to be a point where profit and loss can be preserved or additional entry can be made through split trading. It is a short-term investment perspective.)
GAP refers to the difference in prices that occurred when the stock market, CME, and BAKKT exchanges were closed because they are not traded 24 hours a day.
G1 : Closing price when closed
G2: Opening price
(Example) Gap (G1-G2)

