ETH at Critical Resistance + Liquidation Zone | Time to Short?Today I want to analyze Ethereum ( BINANCE:ETHUSDT ) on the 1-hour time frame . Is there a short position opportunity?
Please stay with me.
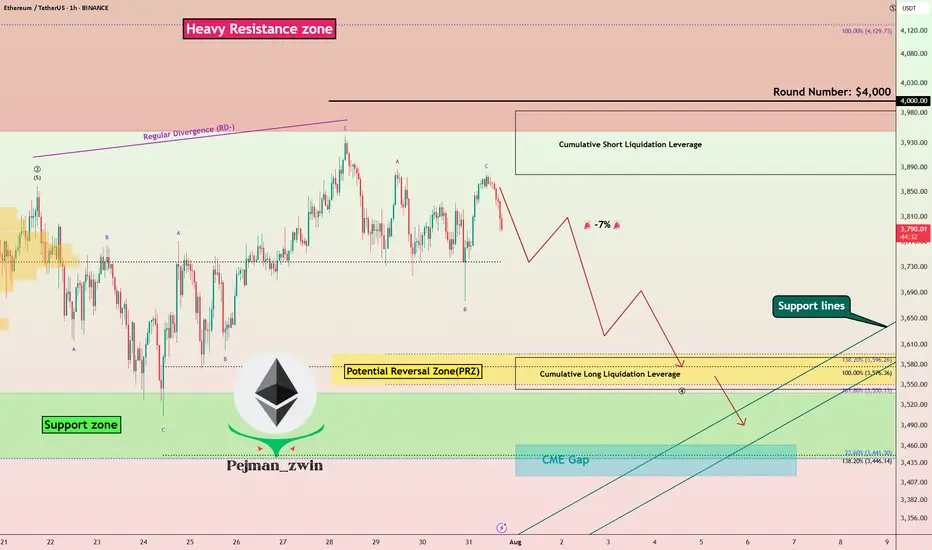
Ethereum is currently trading near a Heavy Resistance zone($4,390-$3,950) , Cumulative Short Liquidation Leverage($3,983-$3,878) and the $4,000 ( round number ). $4,000 could be a psychological number to sell .
In terms of Elliott Wave theory , Ethereum appears to have completed the main wave 3 at $3,860 and is currently completing the main wave 4 . The main wave 4 could have a Double Three Correction(WXY) or Expanding Flat(ABC/3-3-5) , with the Expanding Flat structure being more likely .
One of the reasons why shorting Ethereum could be better than shorting Bitcoin right now is that ETHBTC ( BINANCE:ETHBTC ) is currently trading above the ascending channel and is likely to correct to Fibonacci levels .
Also, we can see the Regular Divergence(RD-) between Consecutive Peaks.
I expect Ethereum to drop to at least the Potential Reversal Zone(PRZ) and attack the Support lines ( Second target ) .
Cumulative Long Liquidation Leverage: $3,591-$3,543
CME Gap: $3,461-$3,417
Note: Stop Loss: $4,023
Please respect each other's ideas and express them politely if you agree or disagree.
Ethereum Analyze (ETHUSDT), 1-hour time frame.
Be sure to follow the updated ideas.
Do not forget to put a Stop loss for your positions (For every position you want to open).
Please follow your strategy and updates; this is just my Idea, and I will gladly see your ideas in this post.
Please do not forget the ✅' like '✅ button 🙏😊 & Share it with your friends; thanks, and Trade safe.
Ethereumforecast
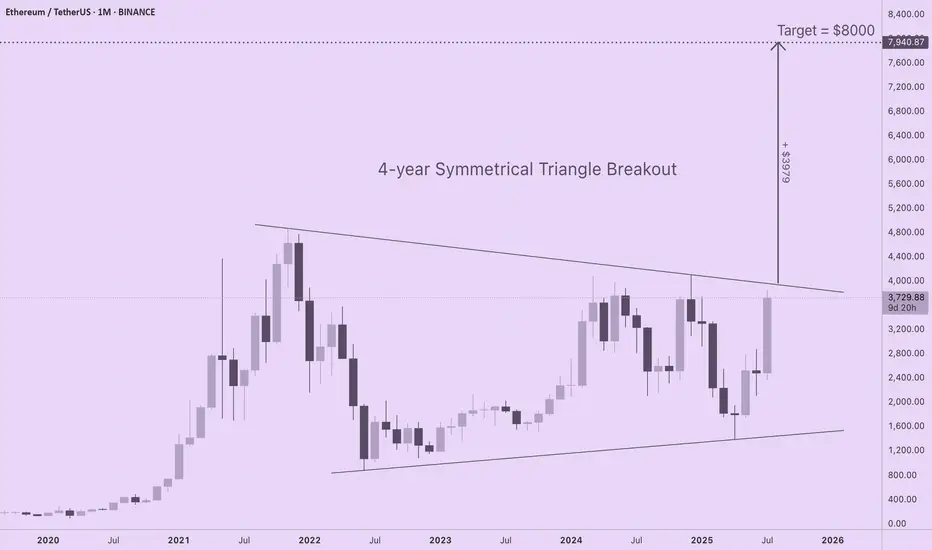
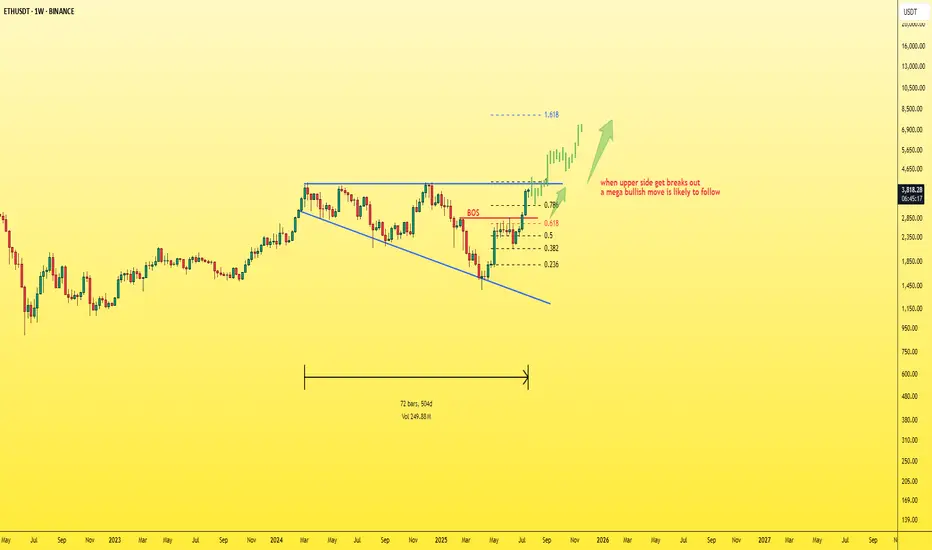
ETH Targets $8000 with 4-Year Symmetrical Triangle BreakoutIf you are seeking realistic ETH price targets based upon solid long-term market structure, check out this 4-year symmetrical triangle forming on the ETH/USD monthly chart. ETH is coiling for a major move to $8000, yet none of the CT "influencers" I follow are talking about this. I am new to technical analysis, so I am interested in learning your thoughts about this pattern and which tools or indicators you prefer for setting price discovery targets.
For those of you new to technical analysis, symmetrical triangle patterns can form on long timeframes (weeks, months, or years), indicating indecision between bulls and bears as price compresses within a continually narrowing range. A breakout from a symmetrical triangle typically follows the direction that preceded their formation, and the longer the consolidation period, the stronger the move.
The chart shows a strong euphoric phase in 2021 followed by a bear market low. Subsequent failure to reach previous ATHs is balanced by a pattern of higher lows. Since ETH was in an uptrend prior to triangle formation, odds are this is a continuation pattern, especially given profound shifts in capital flows and sentiment for the asset over the last several weeks.
With trendlines set at the price extremes, the height of the triangle is roughly $3980. If a breakout occurs at a price of $3960, ETH will target a price of $7940 (height of triangle + breakout price). A more conservative price target of $7000 is obtained by resetting the trendlines at the monthly opening and closing prices (omitting the wicks).
Regardless of the specific method for drawing the triangle, ETH is primed for a major move to the upside that has been four years in the making.
Ethereum - The moment of truth!🔬Ethereum ( CRYPTO:ETHUSD ) trades at a key breakout level:
🔎Analysis summary:
Ethereum - after consolidating for the past four years - is once again retesting the previous all time high. And before we will witness another bearish rejection, Ethereum has the chance to finally break out of the long term triangle pattern. It's time for us to start praying.
📝Levels to watch:
$4.000
SwingTraderPhil
SwingTrading.Simplified. | Investing.Simplified. | #LONGTERMVISION

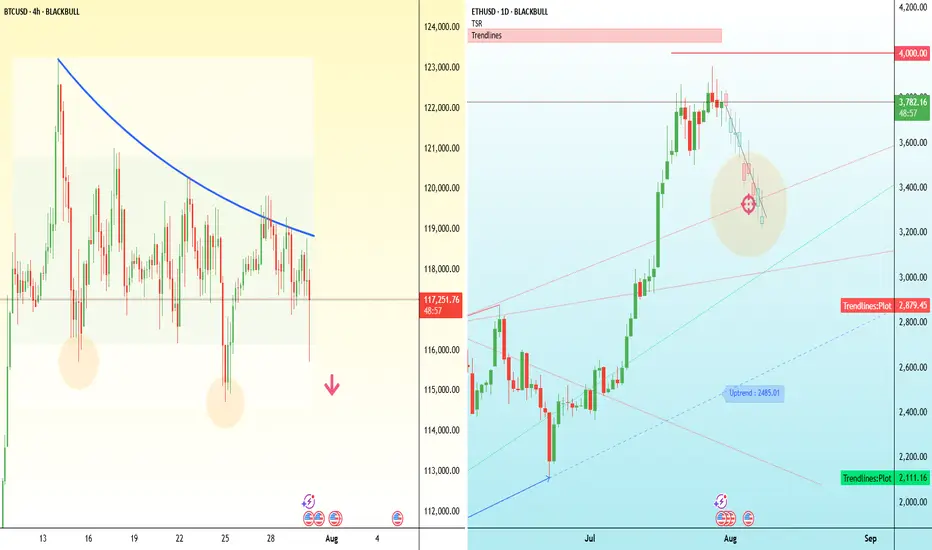
Major test for crypto bulls - BTC and ETH Bitcoin has dipped below $118,000, putting pressure on the bullish structure that’s held for the past two weeks.
The attempted breakout above $121,000 has failed, and price is now breaking down through the middle of the consolidation range, threatening short-term higher lows. On the 4H chart, this move resembles a failed breakout with a potential double-top near $121,000.
If Bitcoin can’t reclaim $116,000 quickly, the next downside levels to watch are $114,000 and $110,000.
Ethereum, meanwhile, has stalled just below $3,800 after a strong rally this month. Price action has flattened out over the past few days, with several failed attempts to push through that level. The key upside trigger remains $4,000.
But if $3,700 gives way, ETH may slide back to the $3,450–$3,300 region, where previous resistance and the rising trendline converge.
3 Key Catalysts Driving the Next ETH Bull Run
A remarkable confluence of powerful market forces is brewing in the Ethereum ecosystem, fueling increasingly bold outlooks for its future valuation. A potent combination of historical price patterns, dramatic supply dynamics, soaring institutional interest, and resilient price action is painting a picture of a digital asset potentially on the verge of a historic expansion. While a target of $20,000 may seem audacious, a granular look at the underlying mechanics reveals a compelling, multi-faceted argument for a significant upward repricing of Ethereum (ETH).
This deep dive will explore the four key pillars supporting this optimistic outlook: a striking historical price pattern that mirrors Bitcoin’s monumental 2021 surge, a critical supply shock evidenced by a mass exodus of ETH from exchanges, record-breaking institutional engagement in the futures market, and a tenacious price strength holding firm at key technical levels.
Chapter 1: The Bitcoin Fractal: Is History Rhyming?
In financial markets, history rarely repeats itself exactly, but its patterns often rhyme. Market analysts are increasingly pointing to a "fractal"—a recurring geometric pattern in price action—that suggests Ethereum's current market structure is eerily echoing that of Bitcoin's in late 2020, just before its parabolic surge in 2021.
This analysis highlights that Ethereum's chart is displaying a nearly identical pattern of accumulation, re-accumulation, and price compression that Bitcoin exhibited before its own historic breakout. During that period, Bitcoin experienced a multi-fold increase in value, shattering previous records. The parallel suggests that, much like Bitcoin did, Ethereum has emerged from a prolonged consolidation phase and is now pressing against a long-term downtrend resistance line that has defined its market structure for several years.
Should this fractal play out as it did for Bitcoin, a decisive breakout above this critical resistance could trigger a rapid, exponential move upwards. The potential for such a climb is being fueled by a perfect storm of institutional adoption and favorable market shifts.
A critical catalyst underpinning this parallel is the recent launch and explosive growth of spot Ethereum Exchange-Traded Funds (ETFs). The 2021 Bitcoin bull run was significantly propelled by growing institutional legitimacy and new, regulated investment vehicles. Similarly, Ethereum ETFs are now providing a secure and accessible gateway for a fresh wave of institutional capital. These funds have already seen staggering net inflows, with major asset management firms accumulating billions in assets, signaling deep conviction from the titans of traditional finance. This institutional stamp of approval is a powerful parallel to the forces that drove Bitcoin's last major cycle, providing the foundational capital flows needed for a sustained rally.
Chapter 2: The Great Supply Squeeze: A Mass ETH Exodus from Exchanges
One of the most compelling bullish arguments for Ethereum is rooted in fundamental on-chain economics: a dramatic and accelerating supply squeeze. The "Exchange Reserve," a metric that tracks the total amount of ETH held in the wallets of centralized exchanges, has plummeted at an astonishing rate.
In a recent one-month period alone, well over one million ETH were withdrawn from these platforms. This mass exodus of coins is a profoundly bullish indicator. When investors move their assets off exchanges, it typically signals an intention to hold for the long term in self-custodial wallets, rather than keeping them liquid and ready for a quick sale. This behavior drastically reduces the immediately available supply on the open market. Consequently, even a steady level of demand can exert significant upward pressure on the price.
This trend has pushed the total supply of Ethereum on exchanges down to its lowest level in nearly a decade. The drivers behind these massive withdrawals are multifaceted and all point toward a tightening market:
• Long-Term Conviction and Staking: A growing number of investors are locking up their ETH in staking contracts to help secure the network and earn passive yield. Others are simply moving their holdings to secure "cold storage" with a long-term investment horizon, effectively taking them off the market for the foreseeable future.
• DeFi Integration: A significant and growing portion of ETH is used as the primary form of collateral within the sprawling Decentralized Finance (DeFi) ecosystem, where it is locked into smart contracts for lending, borrowing, and other financial applications.
• ETF Accumulation: The newly launched spot ETFs are required to purchase and hold real ETH to back their shares. This direct accumulation removes vast quantities of ETH from the circulating supply that would otherwise be available to retail and institutional buyers.
This fundamental imbalance between a shrinking available supply and growing demand is creating the perfect conditions for a potential "supply shock." The sustained decline in exchange reserves, even as prices have rallied, reinforces the idea that current holders are not rushing to take profits. This indicates a strong belief in future price appreciation and adds a powerful layer of underlying support to Ethereum's macro bullish structure.
Chapter 3: The Wall of Institutional Money: Futures and Open Interest Soar
The derivatives market, often seen as the playground for more sophisticated and institutional investors, is flashing its own set of glaringly bullish signals. Open Interest (OI) in Ethereum futures—representing the total value of all outstanding futures contracts that have not been settled—has surged to unprecedented levels.
On major regulated exchanges favored by institutional investors, Ethereum futures Open Interest has recently shattered all-time highs. This represents a massive and undeniable increase in institutional participation, as asset managers, hedge funds, and other large-scale players use these regulated products to gain exposure to ETH's potential upside and to manage their risk. This is not an isolated phenomenon; across the global landscape of exchanges, the total Open Interest for Ethereum futures has climbed to record-breaking heights.
Rising Open Interest that occurs in tandem with a rising price is a classic technical confirmation of a strong and healthy trend. It demonstrates that new money is actively flowing into the market, with participants expressing confidence in future price appreciation. This influx of capital adds significant fuel to the ongoing rally. The surge in derivatives activity highlights a maturation of the market, where both institutional and retail investors are increasingly using sophisticated financial instruments to speculate on Ethereum's price trajectory.
While the high levels of leverage inherent in futures trading can introduce volatility and the risk of cascading liquidations, the primary signal is one of immense and growing institutional conviction in Ethereum's medium-to-long-term outlook. The influx of capital into both spot ETFs and the futures market creates a powerful, self-reinforcing feedback loop, enhancing liquidity, legitimizing the asset class, and attracting even more conservative capital off the sidelines.
Chapter 4: The Immediate Battleground: Price Action Shows Resilient Strength
Zooming in from the macro-outlook to the short-term technical picture, Ethereum's price action has demonstrated notable resilience, reinforcing the broader bullish thesis. After a strong rally, the price has been consolidating its gains, establishing critical support zones that traders and algorithms are watching with keen interest.
Recent price action shows Ethereum starting a fresh increase above the $3,820 and $3,880 levels. The price is trading near the crucial $3,800 mark and the 100-hourly Simple Moving Average, an indicator that often acts as a dynamic line of support during uptrends. Although there was a brief break below a key bullish trend line that had formed with support at $3,800 on the hourly chart, the ability of the price to remain supported above the broader $3,720 zone is considered vital for a bullish continuation. Should the pair remain supported above this zone in the near term, it could start a fresh increase.
The price has recently faced resistance near the $3,900 and $3,920 levels. The psychological $4,000 barrier remains the next major target. A decisive and sustained break above the $4,000 mark could open the door for a rapid advance, as it would clear the last major resistance area before a potential retest of previous all-time highs.
Technical indicators on higher timeframes remain robust. The price is in a clear long-term uptrend, trading well above its key daily moving averages. While short-term indicators may show temporary overbought conditions or moments of waning momentum, the overall market structure remains decisively bullish as long as critical support levels continue to hold.
Conclusion: A Compelling Case for a New Era of Price Discovery
The prospect of Ethereum reaching a valuation of $20,000 is a monumental forecast, but it is one built on a solid and multi-faceted foundation. The convergence of a compelling historical fractal mirroring Bitcoin's most famous bull run, a verifiable and intensifying supply shock, unprecedented institutional adoption via both spot ETFs and futures markets, and a resilient technical posture creates a powerful case for a sustained bullish continuation.
Each pillar of this argument reinforces the others. Institutional inflows from ETFs directly contribute to the supply squeeze on exchanges. The resulting upward price pressure attracts more speculative interest in the futures market, and the resilient technical picture provides the stable base from which a larger market move can be launched. While no outcome in financial markets is ever guaranteed, and the risks of volatility and sharp corrections remain ever-present, the confluence of these potent factors suggests that Ethereum may not just be knocking on the door of its old all-time high, but preparing to smash through it and enter a new and explosive era of price discovery.
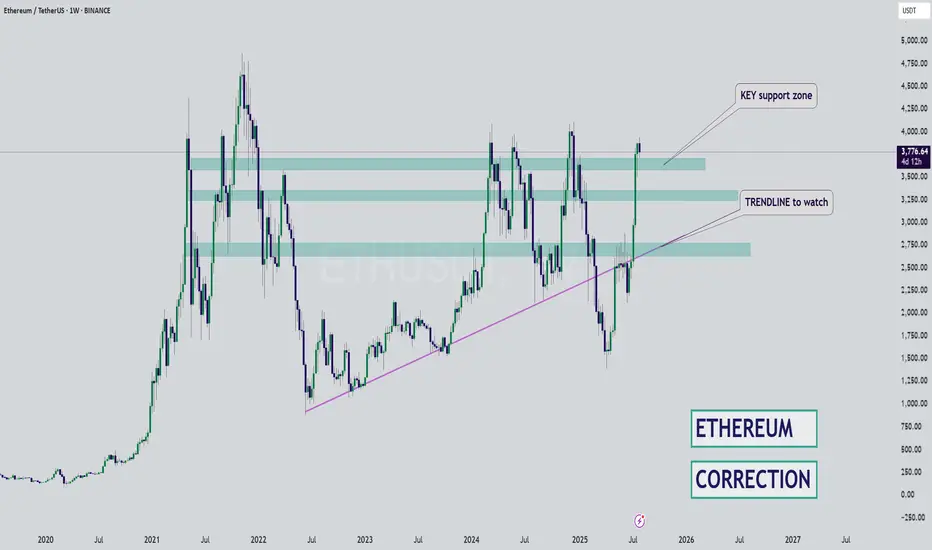
ETH - Bounce Zones - Nears the End for BULLSHello Fello's ☕
I'm watching Ethereum today and I believe it may be very close to the end of it's bullish cycle.
I think what could become likely is an extended altseason, where Bitcoin trades around the same price for some time, and Ethereum increases slightly. Afterwhich smaller altcoins (by marketcap) make random rallies before the beginning of a bearish cycle (which is due, see my previous BTC update).
There's an interesting channel here that previously determined bounce zones... I don't believe the channel itself will hold as much value going down, but this zone may be a likely bounce zone - around $3k.
Key bounce zones to watch include:
I'm not saying it will be this straightforward, but this image demonstrates the power of bounce zones for swing trades:
Next update will be when we've lost the first support zone.
Until then!
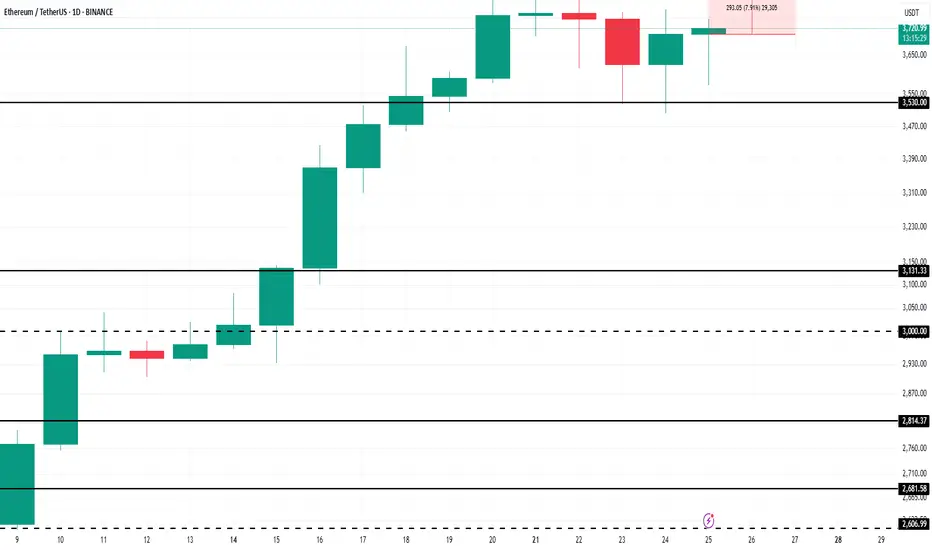
Ethereum Price to Reach $4,000, but Market Top Suggests DelayBINANCE:ETHUSDT current price stands at $3,872, holding above its local support level of $3,742. While ETH is approaching the $4,000 mark , it has not yet managed to breach it. This resistance could continue to hold, limiting Ethereum's immediate potential for further gains.
Currently, 96% of BINANCE:ETHUSDT total supply is in profit. Historically, when the profitable supply surpasses 95%, it signals a market top . This has been followed by price corrections as investors begin to secure profits.
If the market top triggers a reversal, BINANCE:ETHUSDT price could drop to $3,530 or lower . A sharp decline to $3,131 is also a possibility, erasing much of the recent gains made in the past month.
On the other hand, if the influx of new addresses continues and strengthens, BINANCE:ETHUSDT may finally break through the $4,000 resistance. Should this happen, ETH could rise towards $4,425, with a renewed surge in price. This would invalidate the bearish thesis and push Ethereum into a new bullish phase.

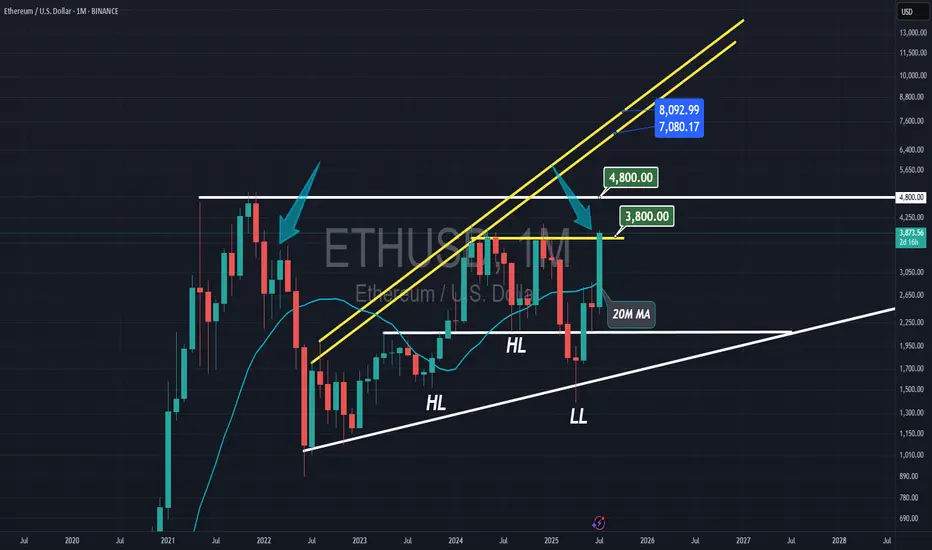
Ethereum the HIGHEST MONTHLY CANDLEEthereum is closing its highest monthly candle since 2021, signaling very bullish months ahead, with $8,000 as the resistance.
Ethereum - Finally new all time highs!🔬Ethereum ( CRYPTO:ETHUSD ) will break out now:
🔎Analysis summary:
For more than four years, Ethereum has overall been moving sideways. However now Ethereum is once again retesting previous all time highs and preparing a bullish breakout. Multiple retests are generally considered bullish so the breakout is very likely to happen any time soon.
📝Levels to watch:
$4.000
🙏🏻#LONGTERMVISION
SwingTraderPhil

Ethereum Price Eyes $5K as Frenzy Fuels Supply ShockEthereum's Ascent: A Perfect Storm of Institutional Frenzy, Dwindling Supply, and Shifting Market Dominance
A palpable sense of anticipation is building in the cryptocurrency market, and its focal point is increasingly not on the reigning king, Bitcoin, but on its heir apparent, Ethereum. A confluence of powerful forces—ranging from bullish proclamations by Wall Street titans and an unprecedented institutional buying spree to compelling on-chain metrics and a shifting market structure—is painting a picture of a potential paradigm shift. The world's second-largest cryptocurrency is not just rallying; it appears to be on the precipice of a significant breakout, with some analysts eyeing targets that would shatter its previous all-time highs. This is not merely a story of price appreciation but a narrative of a "quiet takeover," where Ethereum's fundamental strengths and evolving role in the digital asset economy are finally being recognized by the world's largest financial players.
The chorus of bullish voices has grown louder in recent months, led by influential figures like billionaire investor and Galaxy Digital CEO, Mike Novogratz. A long-time crypto proponent, Novogratz has become increasingly vocal about his conviction that Ethereum is poised to outperform Bitcoin in the near future. He has repeatedly stated that Ethereum has a "really powerful narrative" and that market conditions are aligning for a significant upward move. Novogratz's thesis is built on a simple yet potent economic principle: a demand shock colliding with an already constrained supply. He predicts that Ethereum could outperform Bitcoin in the next three to six months, a bold statement given Bitcoin's own impressive performance.
The catalyst for this potential outperformance, according to Novogratz, is the flood of institutional capital now targeting Ethereum. This isn't just speculative interest; it's a strategic shift by major companies to hold ETH as a treasury reserve asset. This trend, he argues, is creating a supply crunch that will inevitably drive prices higher. The billionaire has identified the $4,000 mark as a critical psychological and technical level. In his view, a decisive break above this price point would launch Ethereum into a phase of "price discovery," where past resistance levels become irrelevant and the asset's value is determined by the sheer force of market demand. Novogratz believes Ethereum is "destined" to repeatedly challenge this $4,000 ceiling, suggesting that a breakout is a matter of when, not if.
This bullish sentiment from one of crypto's most respected voices is not occurring in a vacuum. It is underpinned by a dramatic and sustained price rally that has seen Ethereum's value surge by an astonishing 75% since late June. This powerful uptrend is not fueled by retail FOMO alone; rather, it is the result of a verifiable and accelerating wave of institutional adoption.
The primary engine behind this rally has been the launch and subsequent success of spot Ethereum Exchange-Traded Funds (ETFs). These regulated financial products have opened the floodgates for institutional investors to gain exposure to ETH without the complexities of direct custody. The inflows have been nothing short of staggering. In one remarkable instance on July 25th, Ethereum ETFs registered a net inflow of $452.8 million in a single day, with BlackRock's ETHA fund accounting for the lion's share at $440.1 million. This figure represents a dramatic escalation from the sub-$100 million daily inflows seen in early July, indicating a multifold jump in institutional buying pressure. In a single week, these ETFs absorbed a massive $2.18 billion, showcasing the voracious appetite of big money for a piece of the Ethereum network.
The impact of these ETF inflows is being magnified by a phenomenon known as a "supply shock." Analysts have noted that in a three-week period, ETFs purchased an amount of ETH equivalent to what the network would issue over 18 months. This aggressive absorption of the available supply from the open market, at a time when supply is already constrained due to staking and other factors, creates a powerful upward pressure on price.
The institutional frenzy is not limited to passive ETF investments. A new and significant trend has emerged: the rise of the "Ethereum treasury company." Mirroring the strategy pioneered by MicroStrategy with Bitcoin, corporations are now beginning to add substantial amounts of ETH to their balance sheets, viewing it as a strategic asset and a yield-bearing investment through staking.
Leading this charge is SharpLink Gaming, an online technology company that has made headlines with its aggressive accumulation of Ether. The company recently purchased an additional 77,210 ETH, worth approximately $295 million, in a single transaction. This purchase alone was more than the total net issuance of new Ether over the preceding 30 days. Following this acquisition, SharpLink's total holdings soared to over 438,000 ETH, valued at more than $1.69 billion. This makes SharpLink one of the largest corporate holders of Ethereum, second only to Bitmine Immersion Tech.
SharpLink's strategy is clear and ambitious. The company has filed to increase its stock sale from $1 billion to $6 billion, with the majority of the proceeds earmarked for further ETH purchases. The appointment of Joseph Chalom, a 20-year veteran of the world's largest asset manager, BlackRock, as its new co-CEO, lends further institutional credibility to its crypto-centric strategy. The company has also been vocal about its belief in the Ethereum network, with a recent social media post declaring, "Banks close on weekends. Ethereum runs 24/7." This sentiment captures the essence of why institutions are drawn to the programmable, always-on nature of the Ethereum blockchain.
Other companies, such as BitMine Immersion Technologies and the upcoming Ether Machine, which plans to list on Nasdaq, are also amassing significant ETH treasuries. BitMine has reported holdings of over 566,000 ETH, worth more than $2 billion. Collectively, these corporate players are creating a significant and sustained source of demand, locking up large portions of the circulating supply. This corporate buying spree is a powerful vote of confidence in Ethereum's long-term value proposition, extending far beyond its utility as a digital currency.
The torrent of institutional capital and corporate accumulation is vividly reflected in Ethereum's on-chain data. The network is buzzing with activity, providing a transparent window into the scale of the current buying pressure. One of the most telling metrics has been the explosion in on-chain volume. Over a recent three-week period, on-chain ETH volume surged by an incredible 288%, reaching a staggering $10.38 billion. This indicates a deep and liquid market with robust participation.
Even more compelling is the activity of large holders, colloquially known as "whales." Analysis of blockchain data reveals a sharp increase in the number of "mega whale" addresses—those holding 10,000 ETH or more. Since early July, over 170 new mega whale addresses have appeared on the network. This trend strongly suggests that the massive inflows from ETFs are not just being held by custodians but are being translated into direct, long-term accumulation by large, well-capitalized entities. These are typically "strong hands" that are less likely to sell in response to short-term market fluctuations, providing a stable base of support for the price.
Furthermore, the weekly volume of large transactions, defined as those exceeding $100,000, has hit its highest level since the peak of the 2021 bull run, totaling more than $100 billion in a single week. This explosion in whale activity, coinciding with Ethereum's price breakout into the high $3,000s, confirms that "smart money" is actively and aggressively positioning itself in the market. This is not the speculative froth of a retail-driven rally but the calculated maneuvering of institutional players.
Adding another layer to Ethereum's bullish case is a significant shift in the broader cryptocurrency market landscape: the steady decline of Bitcoin's dominance. Bitcoin dominance, which measures BTC's market capitalization as a percentage of the total crypto market cap, has been trending downwards. This indicates that capital is beginning to flow out of Bitcoin and into alternative cryptocurrencies, or "altcoins," with Ethereum being the primary beneficiary.
This phenomenon, often referred to as a "quiet takeover," signals growing confidence in Ethereum's relative strength. While Bitcoin has already set new all-time highs in the current cycle, Ethereum has yet to surpass its 2021 peak, suggesting it has more room to run. Analysts note that as Bitcoin's momentum has somewhat stalled, investors seeking higher returns are rotating into Ethereum, which offers a compelling combination of a strong narrative, institutional adoption, and significant upside potential.
The outperformance is stark when looking at recent returns. In the last 30 days, while Bitcoin posted respectable gains of around 11%, Ethereum surged by over 61%. This divergence is a classic sign of a market beginning to favor altcoins, a period often dubbed "altcoin season." Ethereum, as the leader of the altcoin pack, typically paves the way for broader rallies across the ecosystem. A rising Ethereum price and declining Bitcoin dominance create a fertile ground for other altcoins to flourish, with some analysts predicting double-digit returns for many smaller projects if Ethereum can successfully break the $4,000 barrier.
From a technical perspective, Ethereum's price chart is flashing multiple bullish signals, suggesting that the recent rally could be the start of a much larger move. Analysts are closely watching several key formations that have been developing over a long period. One of the most significant is a massive consolidation pattern. After a prolonged period of trading within a range, a breakout from such a pattern often leads to a powerful and sustained trend. Some analysts believe a breakout is imminent, with initial price targets set between $4,800 and $5,000.
Even more compelling is the challenge to a 3.7-year descending trendline. This long-term resistance has capped Ethereum's upward movements for years. A decisive weekly close above this trendline would be a major technical victory for the bulls, invalidating the long-term bearish structure and opening the door for a parabolic advance. Technical analysts often view the breach of such a long-standing trendline as a powerful signal of a major trend reversal and the beginning of a new bull market phase.
Should Ethereum successfully break out of its current consolidation and clear the $4,000 to $4,200 resistance zone, chart analysis suggests there is very little historical resistance until the $4,800 to $5,000 range. Some of the more bullish forecasts, looking at the ETH/BTC trading pair and other long-term models, even project potential targets between $7,300 and $10,000 in this market cycle.
Despite the overwhelmingly bullish picture, the path to new all-time highs is unlikely to be a straight line. The $4,000 level has proven to be a formidable barrier. Recently, Ethereum's price was firmly rejected near this psychological milestone, leading to a period of cooling volatility and raising concerns about a potential short-term selloff. The failure to break through has caused some buying pressure to weaken, and on-chain data has shown a temporary decrease in large whale transactions following the rejection.
This price action highlights the classic tug-of-war between buyers and sellers at a key resistance level. Some traders who have enjoyed the 75% run-up may be tempted to take profits, creating selling pressure. The Relative Strength Index (RSI), a momentum indicator, has also shown signs of being "overheated," suggesting that a period of consolidation or a minor correction could be healthy and necessary before the next leg up.
However, a key positive sign is that despite the rejection, buyers have not given up much ground. The price has continued to consolidate just below the resistance area, indicating that dips are being bought and that underlying demand remains strong. This type of price action, where an asset persistently hovers near a major resistance level without a significant pullback, is often a precursor to an eventual breakout.
Crucially, while retail sentiment and short-term trading metrics might show some hesitation, the institutional tide shows no sign of ebbing. Spot ETF inflows have remained consistently positive, providing a steady stream of buying pressure that counteracts short-term selling. This suggests that while there may be some turbulence in the immediate future, the larger, more powerful trend is being driven by long-term institutional accumulators who are less concerned with short-term price swings.
In conclusion, Ethereum finds itself at a historic crossroads, propelled by a perfect storm of fundamental and technical tailwinds. The narrative is no longer just about its technological promise as a world computer but about its emergence as a mature, institutional-grade asset. The vocal support of financial titans like Mike Novogratz, the verifiable flood of institutional capital through ETFs, and the strategic shift by corporations to hold ETH in their treasuries are creating a demand shock of unprecedented scale.
This is being met with a supply that is increasingly constrained, thanks to staking and the aggressive accumulation by these new, large players. On-chain data confirms this story, with volumes and whale activity reaching levels not seen since the last bull market peak. As Bitcoin's dominance wanes, Ethereum is stepping into the spotlight, ready to lead the next phase of the market cycle.
While the $4,000 resistance remains a key hurdle to overcome, and short-term volatility is to be expected, the underlying forces at play suggest a powerful current pulling Ethereum towards new horizons. The "quiet takeover" is becoming louder by the day. A breakout above $4,000 could unleash a wave of price discovery, potentially pushing Ethereum to $5,000 and beyond, and in the process, reshaping the very landscape of the digital asset ecosystem. The stage is set for Ethereum's ascent, and the world is watching.

ETH - simple chart and mega moveEthereum is currently the strongest and most stable asset in the market, especially after many had lost hope in it.
Now, Ethereum is back with strength, and it’s just a few steps away from breaking out of the current pattern.
📈A breakout above the upper boundary will likely lead to a new all-time high (ATH) for ETH.
My projection: Ethereum could surpass $7,000 before the end of 2025.
Best regards:
Ceciliones🎯
Ethereum’s $4,000 Target Alive as Historic Rally Signs EmergeBINANCE:ETHUSDT is currently trading at $3,680, just 9% away from the critical $4,000 resistance that many investors have been waiting for over the past seven months. The altcoin is expected to continue its upward momentum despite the recent consolidation, with the potential to breach the $4,000 mark soon.
Looking at broader technical indicators, the NUPL (Net Unrealized Profit/Loss) suggests that BINANCE:ETHUSDT is poised for a significant rally . The NUPL indicator, when reaching a threshold of 0.5, traditionally signals a pause in the uptrend, followed by a sharp rally.
$ BINANCE:ETHUSDT is currently nearing this threshold , which, in the past, has marked the beginning of powerful upward price action.
As long as BINANCE:ETHUSDT remains above its key support levels, the price is likely to surge toward $4,000 . If Ethereum can maintain its momentum, a breach of $4,000 could act as a catalyst for further gains.
However, should unforeseen selling pressure arise, $BINANCE:ETHUSDTprice could slip below the $3,530 support level. In such a scenario, Ethereum may fall to $3,131, invalidating the current bullish outlook. The key will be maintaining support and capitalizing on the retail-driven surge.
ETH: Eyes Resistance, But Correction Still LoomsEthereum has also seen a modest pullback since yesterday morning, but here too, it’s too soon to confirm a high for turquoise wave B. Accordingly, we anticipate further gains in this corrective rally—potentially up to resistance at $4,107—before the subsequent turquoise wave C takes over and drives the price down into the green long Target Zone ($935.82–$494.15). Within this range, we primarily expect the low of the wave- correction, which has now lasted more than four years, setting the stage for a long-term trend reversal to the upside. According to to our alternative scneario, magenta wave alt.(1) would complete with the next high. The following pullback, attributed to wave alt.(2), would then only extend into the slightly adjusted magenta Target Zone ($2,622–$1,914) before a move to new all-time highs (probability: 35%).
📈 Over 190 precise analyses, clear entry points, and defined Target Zones - that's what we do (for more: look to the right).

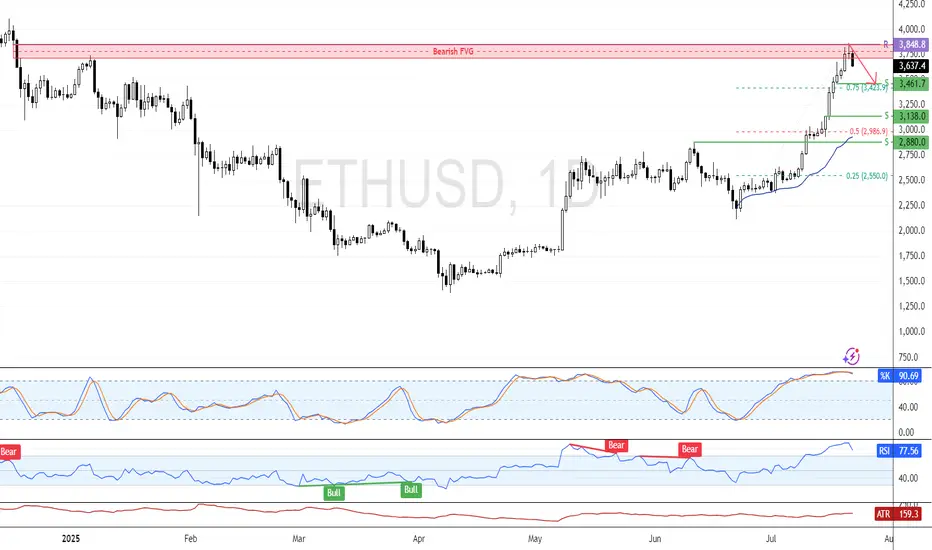
ETH Eyes Consolidation from Overbought ZoneFenzoFx—Ethereum pulled back from the daily bearish FVG. The recent candle closed with a long wick and flat body, reflecting market uncertainty. Momentum indicators remain in overbought territory, signaling a possible consolidation phase.
If resistance at $3,848.0 holds, the price may decline toward support at $3,461. However, the bullish outlook stays valid as long as ETH/USD holds above $3,848.0.
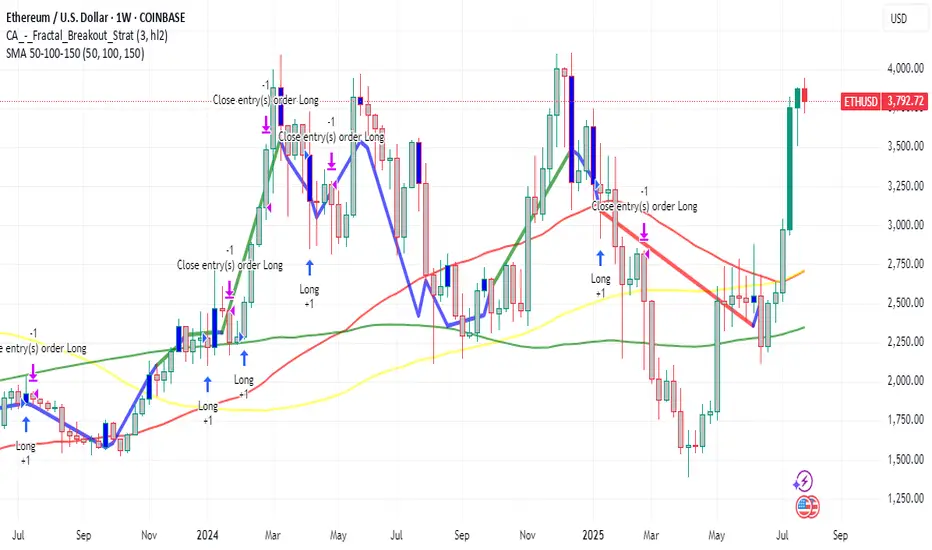
$Eth Ethereum nearing critical resistance....All Time High soon!This is a weekly candlestick chart of ETHUSD
Current price: 3800
CRYPTOCAP:ETH Ethereum recently broke out of a long-term downtrend, indicated by the red diagonal trendline. Price action has shifted from bearish to bullish. This is also a show of strong Momentum as recent candles are large and green, showing aggressive buying (strong bullish pressure).
If #eth continues in this uptrend then here are the resistance above to watch: 4000, 4800 and possibly new all time highs at 5600, 6400
Note worthy to know that the areas between 3800-4000 is very critical resistance.
Assuming a retracement from this resistance, Ethereum remain bullish above 2900
Invalidation of this idea is under 2900

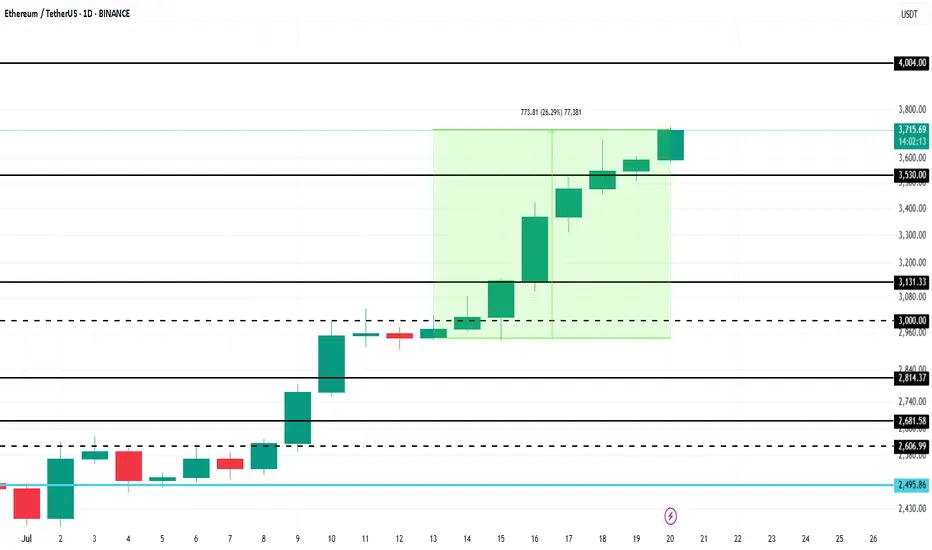
Ethereum Price Hits 6-Month High, Up Next $4,000BINANCE:ETHUSDT has managed to navigate recent market volatility with significant support from investors. As companies increasingly mirror Bitcoin’s corporate treasury use case, Ethereum is gaining traction.
BINANCE:ETHUSDT price surged 26% over the past week , reaching $3,715 and marking a 6-month high. The rally strengthened after ETH formed a Golden Cross last week. With this bullish momentum, Ethereum is now targeting $4,000 in the coming days, benefiting from investor confidence and growing institutional interest.
However, if BINANCE:ETHUSDT bullish momentum weakens and investors opt to sell, the price could decline to $3,131 . This would erase recent gains and invalidate the current bullish outlook.
Ethereum: Overbought Conditions Persist Near $3,746ETH is testing the volume point of interest at $3,417.0, while strong resistance and an order block reside at $3,746.0. Indicators remain in overbought territory, signaling short-term overpricing.
With little resistance shown in the volume profile, ETH is expected to fall back and retest the $3,404.0 support level. Traders and investors should monitor this zone closely for a potential bullish setup.

ETH/USD Setup | Thief Trading Blueprint for Profit.🔥🚨THE ETHEREUM HEIST PLAN: Thief-Style Trading Blueprint for Maximum Gains🚨🔥
💰Thief Mode: Activated | Time to Rob the Bulls 💰
📢🌍 Hello Money Makers, Crypto Crooks & Chart-Breaking Bandits! 🐱👤🤑💸
Welcome to the “Thief Trading Style” breakdown — a high-stakes, high-reward crypto market blueprint built on deep technical & fundamental intel. This isn’t your average strategy… it’s a full-blown heist on the ETH/USD market!
🧠 THE MASTER PLAN (ETH/USD – Day & Swing Trade)
🔎 Based on our Thief Mode analysis — blending market sentiment, trend psychology, and price action — Ethereum is ripe for a bullish robbery. We’re setting up shop at high-risk liquidity traps and targeting bearish overconfidence.
💥ENTRY STRATEGY – "The Vault Is Open, Time to Strike!" 💥
🟢 Go Long:
Swipe in on bullish momentum.
🕒 Set Buy Limit Orders at key pullback zones (swing highs/lows from 15m or 30m timeframes).
💼 Use DCA (Layered Orders) for multiple precision entries. The more layers, the stronger the loot stack.
🛑STOP LOSS – "Thief Rule: Don’t Get Caught"
📍Place SLs at logical swing highs/lows using the 1H timeframe
💡 Adjust according to lot size & how many entries you're stacking
Risk smart, steal smarter!
🎯TARGET – "Make the Escape at 2850.0 or Jump Early if Cops Close In!"
📌Set TP at 2960.0, or
📌Exit early if the market starts turning shady (exit before reversal signs appear)
⚔️SCALPER'S CODE – "Fast Hands Only!"
🧲Only scalp Long-side plays
🧠Use trailing SLs to protect stolen profits
💼Big wallets? Front-run the move
🪙Smaller bags? Team up with swing traders and follow the blueprint.
🚨MARKET CONTEXT – Why This Heist is Bulletproof
💥ETH/USD is showing bullish energy due to:
Macro & Fundamental Drivers
On-Chain Metrics showing accumulation
Sentiment Analysis leaning toward over-leveraged bears
Intermarket Correlation signaling rotation into altcoins
🔗Stay sharp, keep updated with: COT Reports, Macro Calendar, Crypto News Feeds
⚠️NEWS RELEASE WARNING – "Robbers Hate Surprises"
📛Avoid new entries during major news releases
📈Use Trailing Stop Losses to lock in profits
⛔Don’t leave positions unmanaged during volatility spikes
💖LOVE THE PLAN? THEN BOOST THE GANG!
🎯Tap the 🔥 Boost Button 🔥 and show support for the Thief Trading Style!
The more boosts, the more plans drop — let’s build a community of smart traders robbing the market legally (😉).
✍️DISCLAIMERS
📌This analysis is for educational purposes only — not financial advice.
📌Always trade within your own risk management rules.
📌Market conditions change fast — adapt, evolve, and don’t trade blindfolded.
🚀Stick around for more blueprints — the next heist is always just around the corner.
Until then… Lock. Load. Loot. 🐱👤🤑💰

ETH/USD ROBBERY IN PROGRESS! Long Now, Exit Before Bears Attack!🚨 ETH/USD HEIST ALERT: Bullish Loot Before the Trap! 🚨
Thief Trading Style: Steal Profits & Escape Before the Cops Arrive!
🌟 Greetings, Market Pirates & Profit Bandits! 🌟
(Hola! Oi! Bonjour! Hallo! Marhaba!)
🔥 The Ethereum vault is WIDE OPEN! Time to execute the Thief Trading Strategy—bullish momentum is primed for a heist. Long entries only! Target the highs, then vanish before the overbought trap snaps shut.
🔑 Heist Plan (Day/Swing Trade)
🎯 Entry: "The vault is unguarded—swipe bullish loot at any price!"
Pro Tip: Use buy limits within 15-30min for pullback entries (recent swing lows/highs).
🛑 Stop Loss:
Thief SL (4H): 2240.0 (Nearest swing low)
Adjust SL based on risk, lot size & multiple orders.
🏴☠️ Target: 2800.0 (or escape earlier if bears ambush!)
⚡ Scalpers’ Quick Loot:
Only scalp LONG!
Big wallets? Charge in! Small wallets? Join swing traders & rob smart.
Trailing SL = Your Escape Rope!
📢 Why Ethereum?
🐂 Bullish momentum + strong fundamentals = Perfect heist conditions!
(Check COT reports, macro trends & sentiment— check 👉🔗!)
⚠️ WARNING: Cops (Bears) Are Setting Traps!
Avoid fresh trades during news!
Trailing SL = Lock profits & run!
💥 BOOST THIS HEIST!
🔥 More boosts = Faster profits!
🚀 Daily robberies = Easy money!
Stay tuned—next heist coming soon! 🤑💎 (Like & Follow for more loot!)

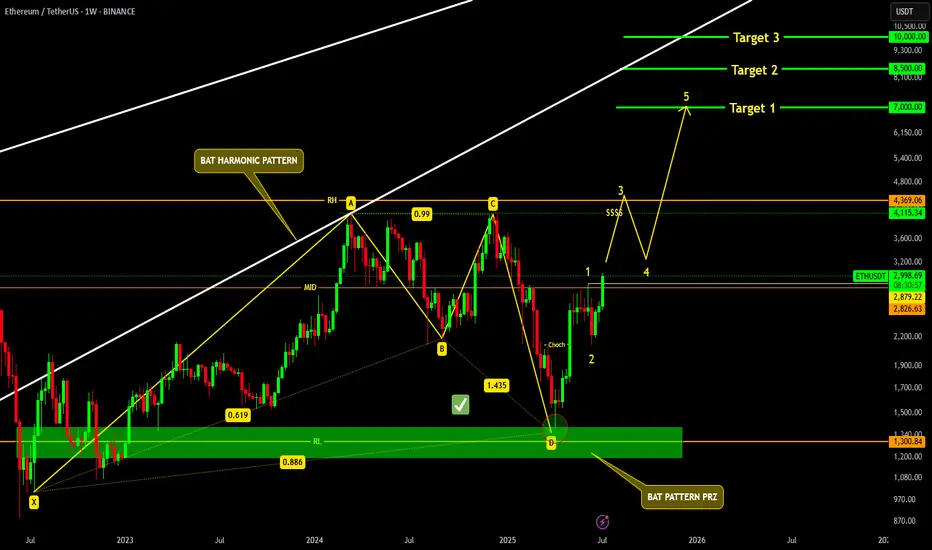
ETHEREUM READY TO SMASH 10K !!!AS per previous Ethereum update, CRYPTOCAP:ETH successfully tapped our Bat PRZ and making it's way to the top.
as per micro elliott wave count, we will see Ethereum slamming 7k, and could potentially smash 10k in coming months.
Ethereum Stalls at $3,101.0FenzoFx—Ethereum broke past $2,880.0 but stalled near a bearish fair value gap. The daily chart shows a longwick bearish candlestick, signaling increased selling pressure.
With Stochastic at 90.0, ETH is short-term overbought. Resistance is at $3,101.0—if it holds, ETH may retreat to $2,880.0 or $2,638.0.
A close above $3,101.0 would invalidate the bearish outlook and pave the way toward $3,330.0.

Trend Resumes: Ethereum Breaks Consolidation, Eyes $4050Market Structure Overview:
Markets typically move in two major phases:
🔹 Trend Phase (directional movement)
🔹 Consolidation Phase (sideways movement or accumulation/distribution)
These phases repeat as: Trend → Consolidation → Trend → Consolidation
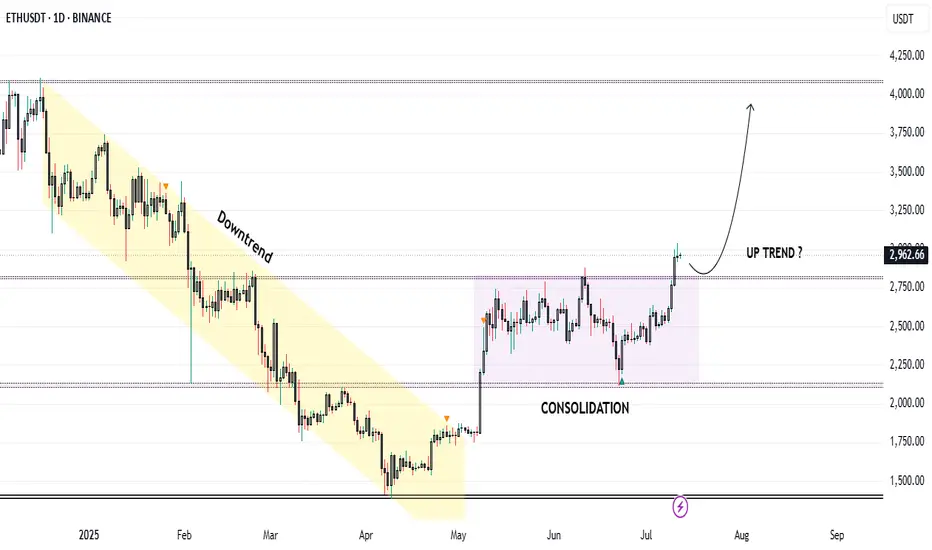
Ethereum Price Action Breakdown (Daily Timeframe):
Mid-December to End-April: Clear downtrend phase.
May to Early July: Entered a consolidation zone, forming a tight range.
Current Status (July):
🔹 Ethereum has broken out of the consolidation range.
🔹 Currently trading around $3000, confirming strength.
🔹 This breakout may potentially signal the start of Altcoin Season.
Trade Setup – Long Position Idea:
Entry (Buy Zone): Around $2850 (retest of breakout resistance).
Target:
🔹 Primary Target: $4050
🔹 This aligns with a major resistance and Fibonacci extension zone.
Stop Loss: $2600 (below key structure support).
Technical Confluences:
* Breakout above multi-week range.
* Retest of resistance turned support at \$2850.
* Psychological round level near \$3000 acting as a magnet.
* Volume confirmation on breakout (optional to mention if on chart).
Risk Note:
⚠️ Caution: The Market may turn volatile due to unexpected geopolitical or macroeconomic news. Always follow risk management and avoid overleveraging.
Conclusion:
Ethereum’s breakout from a multi-month consolidation phase indicates a potential shift in momentum. If retest levels hold, this could be the beginning of a strong upside rally, possibly leading to a broader Altcoin Season. Traders can position themselves accordingly with a well-defined risk-reward setup.
Ethereum Approaches $2,908 as Bullish Momentum FadesEthereum remains bullish, trading near $2,796 and approaching monthly resistance at $2,908. Stochastic shows an overbought reading of 81.0, suggesting short-term buying exhaustion.
Bearish Scenario : A pullback toward $2,651 is likely if $2,908 holds. Extended selling pressure could lead to a test of the anchored VWAP near $2,500.
Bullish scenario : A confirmed breakout above $2,908 would likely extend the rally toward $3,260.
