Ethereum Bullish Bias Pauses After Reaching Weekly HighF enzo F x—Ethereum rose from $2,539.5, backed by VWAP and volume profile, but momentum eased after hitting the $2,651.0 weekly high. Stochastic signals overbought conditions at 87.0, hinting at possible consolidation or downside pressure.
Bullish scenario : The bullish trend remains intact above $2,500, with upside potential toward the bearish FVG at $2,741.0.
Bearish scenario : A close below $2,500 would shift focus to the $2,383 support zone.
Ethereumforecast

Ethereum: Eyeing New Highs?Ethereum has surged recently and continues rising in turquoise wave B. The next target is a break above the June high, with potential upside to resistance at $4,107. A direct breakout above this level (27% probability) would suggest green wave alt. ended in April. However, our main scenario expects a reversal below $4,107, with turquoise wave C likely dragging ETH into the Long Target Zone between $935.82 and $494.15 to complete wave .
📈 Over 190 precise analyses, clear entry points, and defined Target Zones - that's what we do.

ETH Momentum Builds Above Key SupportFenzoFx—Ethereum bounced from the $2,397.0 support and swept liquidity below the level, backed by a bullish FVG on the 4-hour chart. ETH is currently testing resistance at $2,500.0, and a breakout could lead to a retest of $2,539.0.
The bullish setup remains valid above $2,397.0; below that, $2,317.0 becomes the next support.

Ethereum Slides Toward $2,446 SupportEthereum was rejected at the $2,539.0 resistance and is falling toward $2,446.0 support. A hold here could launch a retest of $2,539.0, while a close below $2,446.0 may spark a decline to $2,397.0.

Ethereum Faces Resistance at $2,539.0Ethereum was rejected at the $2,539.0 resistance, a high-volume supply zone. If this level holds, ETH could drop toward $2,397.0, and a break below it may trigger further downside toward $2,192.0.
The bearish outlook is invalidated if ETH/USD closes above $2,539.0.

Inverse Head and Shoulders on Ethereum: Short Opportunity ETH?I'm currently watching Ethereum , and things are starting to look interesting.
We’re seeing early signs of a potential break in structure to the downside, and I’m closely monitoring a bearish inverse head and shoulders pattern. On the 30-minute timeframe, I’m waiting for a clear break of market structure within the current range before considering a short entry.
Stop loss would be placed above the range, with the target outlined in the video.
This is not financial advice—please trade responsibly and always manage your risk.

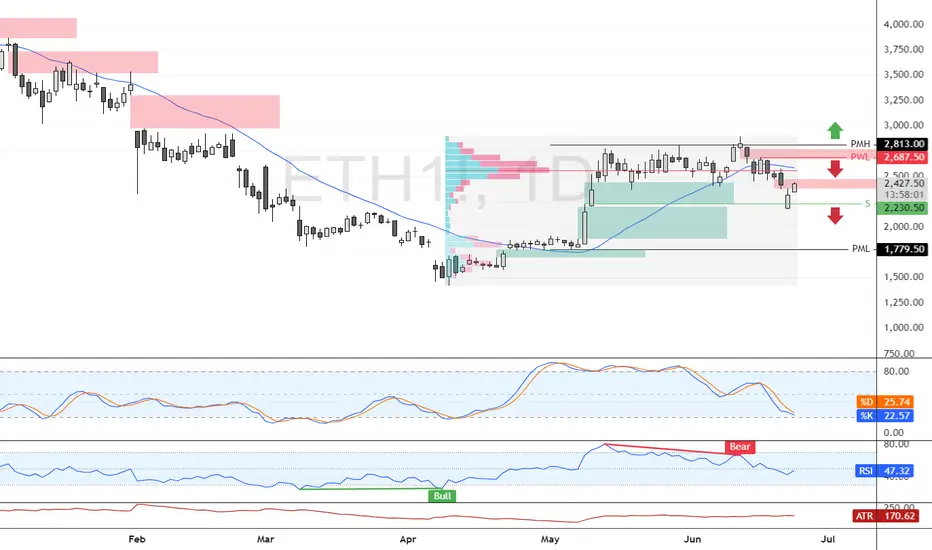
Bearish Wave Builds Below Key ETH Supply ZoneFenzoFx—Ethereum failed to break above $2,813.0 and is now trading around $2,430 after trimming nearly 5.0% of recent losses.
The $2,687.0 area, backed by the 50-period SMA, acts as a premium supply zone. A bearish wave could follow, targeting $1,779.0, supported by prior monthly lows and RSI divergence.
The bearish outlook is invalidated if ETH/USD closes above $2,813.0.
Ethereum Price Reversal ? $2100 Support & Altcoin Season OutlookAfter an extended period of consolidation, Ethereum (ETH) has finally retested the critical support level of $2,100, which aligns closely with the 0.5 Fibonacci retracement level of the bullish trend that began in April. This confluence of technical factors strengthens the validity of this level as a strong demand zone.
The price action suggests that ETH may be gearing up for a bullish reversal, as it respects both horizontal support and key Fibonacci structure. Historically, the 0.5–0.618 retracement zone acts as a high-probability reversal area in trending markets, particularly when accompanied by volume stabilization and long-tailed candles on the daily chart.
Trade Plan: Spot and Futures Positions
Given the current structure, this presents a favorable opportunity to accumulate ETH on spot for the anticipated altcoin season. In addition, leveraged long positions in futures can be considered with clearly defined risk parameters.
Entry Zone: Around \$2,100
Stop Loss: \$2,000 (below key support)
Target Levels:
Primary Target: $2,500 (previous resistance / psychological level)
Secondary Target: $2,600 (major structure high)
The risk-to-reward ratio remains attractive, particularly if the broader crypto market continues its uptrend and Bitcoin maintains stability.
Market Context
Broader macro sentiment and the dominance cycle suggest capital rotation into altcoins could be near. With Ethereum leading major Layer 1s, a recovery from this level could catalyze a wider altcoin rally**, making this an important zone to watch for both intraday traders and swing investors.
⚠️ Note: Due to ongoing geopolitical tensions between Israel, Iran, and the United States, global financial markets—including crypto—may experience heightened volatility. Traders are advised to manage risk carefully and avoid overleveraging during uncertain macro conditions.

ETH: Hardly Any Volatility Not much has happened for Ethereum since yesterday. According to our primary scenario, wave B in turquoise should imminently push higher, theoretically up to resistance at $4,107. Once these corrective rises conclude, wave C should take over, driving ETH down to complete the large green wave in the Target Zone below ($935.82 – $494.15). The low of this multi-year correction should lay the foundation for subsequent wave increases, likely causing new record highs above the $10,000 mark, as the weekly chart suggests. In our alternative scenario, ETH would embark on this bullish journey earlier. Currently at 27% probability, this alternative assumes the corrective low was already established at $1,385, which would imply a direct breakout above $4,107.
📈 Over 190 precise analyses, clear entry points, and defined Target Zones - that's what we do.

Ethereum at PRZ: Bullish Setup _ Short termEthereum ( BINANCE:ETHUSDT ) reacted from the Potential Reversal Zone (PRZ) around the confluence of key Fibonacci levels , the Important Support line and 50_SMA(Daily) .
From an Elliott Wave point of view , we can identify a Expanding Flat (ABC/3-3-5) structure ending right above the Support zone ($2,474-2,437) .
The structure also hints at the formation of a new upward leg , potentially leading ETH toward the Resistance zone ($2,564-$2,524) and the upper line of the Ascending Channel .
I expect Ethereum to test the 38.2%($2,531=First Target) - 50%($2,561) Fibonacci retracement levels on the way to a potential retest of the previous swing highs .
Note: Stop Loss (SL) = $2,451= Worst Stop Loss(SL)
Please respect each other's ideas and express them politely if you agree or disagree.
Ethereum Analyze (ETHUSDT), 15-minute time frame.
Be sure to follow the updated ideas.
Do not forget to put a Stop loss for your positions (For every position you want to open).
Please follow your strategy and updates; this is just my Idea, and I will gladly see your ideas in this post.
Please do not forget the ✅' like '✅ button 🙏😊 & Share it with your friends; thanks, and Trade safe.

Ethereum Rejected By Strong Resistance, A Bearish OutlookFenzoFx—Ethereum is consolidating around $2,525 after being rejected by the $2,813.0 resistance, a strong supply zone. Immediate support lies at $2,446.0. If ETH closes below this level, a move toward $2,080 is likely.
The bearish outlook is invalidated if ETH stabilizes above $2,813.0.

Ethereum’s 19-Day ETF Inflow Streak: What Really HappenedEthereum’s 19-Day ETF Inflow Streak: What Really Happened to Price, Structure, and Sentiment
Table of Contents
1. Executive Summary
2. ETF Backdrop: How the 19-Day Inflow Wave Took Shape
3. Chronology of Price: Day-by-Day Performance
4. Weekly Chart Anatomy: The “Pre-Tower Top” Signal Explained
5. Intraday Technicals: From $2,450 Low to the $2,620 Hurdle
6. On-Chain & Derivatives Lens: Funding, OI, CEX Balances
7. Fundamental Undercurrents: Dencun Afterglow, L2 Fees, Staking Yields
8. Risks & Catalysts: ETH vs. Macro, vs. BTC Dominance, vs. SEC Noise
9. Playbooks for Traders and Long-Term Allocators
10. Conclusion: A Pause, Not a Peak—If Key Levels Hold
________________________________________
1. Executive Summary
• Ethereum received 19 consecutive days of net inflows into spot-linked exchange-traded products (ETPs) totaling $1.37 billion, the longest positive streak since the 2021 bull-run.
• Over the same period ETH/USD rose 18.4 %, printing a local high at $2,750, but has since pulled back to $2,575 amid broad crypto risk-off and Middle-East tensions.
• The latest weekly candle morphs into a “pre-tower top” pattern—two tall green candles followed by a small-bodied doji—often a harbinger of heavy distribution if confirmed by another red week.
• Short-term structure improved Monday: price pierced a contracting-triangle ceiling at $2,550, reclaimed the 100-hour SMA, and now eyes $2,620 as the gatekeeper to renewed upside.
• Funding rates flipped neutral, exchange reserves hit a 7-year low, and staking deposits outpace withdrawals 1.7 : 1—on-chain signs that the sell-off is more leverage shakeout than top formation.
________________________________________
2. ETF Backdrop: How the 19-Day Inflow Wave Took Shape
2.1. The Players
Unlike Bitcoin’s mammoth U.S. spot ETFs, Ethereum’s inflow streak drew from Europe and Canada, where physically backed ETPs have traded since 2021. The three biggest contributors:
Product Country 19-Day Net Flow AUM Growth
21Shares Ethereum ETP (AETH) Switzerland +$502 m +38 %
CI Galaxy Ethereum ETF (ETHX) Canada +$458 m +29 %
WisdomTree Physical Ethereum EU +$227 m +24 %
Rumors of an SEC approval window “after the U.S. election” sparked pre-positioning; asset managers figured it was cheaper to accumulate now than chase later once liquidity explodes on Wall Street.
2.2. Flow Mechanics
When an ETP issues new shares, it must buy spot ETH or tap an AP that can supply coins—direct demand unmatched by equivalent selling pressure. Over the 19-day window, the net 396 k ETH of creation equaled 57 % of all new issuance from block rewards post-Dencun, creating a measurable supply squeeze.
2.3. Historical Context
The only longer stretch was January–February 2021 (27 days), which culminated in ETH exploding from $1,400 to $2,000. The key difference today: market cap is six times larger, so identical inflows exert a milder percentage impact, explaining why price “only” added ~18 %.
________________________________________
3. Chronology of Price: Day-by-Day Performance
Day Date ETF Net Flow Price Close % Δ vs. Prior Day
1 Mar 18 +$58 m $2,110 —
5 Mar 22 +$73 m $2,265 +7.3 %
10 Mar 27 +$94 m $2,430 +2.4 %
15 Apr 1 +$125 m $2,690 +3.8 %
19 Apr 5 +$81 m $2,750 +0.9 %
Across the stretch, realized volatility rose from 32 % to 46 %, but skew stayed positive, showing call demand outpaced puts until the very end, when geopolitical headlines flipped sentiment.
________________________________________
4. Weekly Chart Anatomy: The “Pre-Tower Top” Signal Explained
4.1. What Is a Tower Top?
In candlestick lore, a tower top comprises:
1. A tall green candle (strong breakout)
2. Another tall green candle (exhaustion)
3. A narrow doji or spinning top (equilibrium)
4. A large red candle (breakdown confirmation)
We currently have the first three pieces: the last two weeks of March delivered back-to-back 10 % advances; the first week of April closed as a +0.6 % doji. The pattern is not confirmed until a decisive red week engulfs the doji body (< $2,540).
4.2. Indicators
• RSI (weekly): 59 → ticking down from 68 high; still shy of overbought.
• MACD histogram: Positive but flattening.
• Bollinger bands: Price mid-point of upper band, room for one more expansion.
Conclusion: the candle warns of fatigue, but momentum hasn’t rolled over—yet.
________________________________________
5. Intraday Technicals: From $2,450 Low to the $2,620 Hurdle
5.1. Hourly Chart (Kraken Feed)
• Triangle Breakout: Price sliced through descending trend-line at $2,550, tagging $2,590.
• Moving Averages: ETH trades marginally above the 100-hour SMA ($2,575) but below the 200-hour ($2,610).
• Fibonacci Zones: $2,620 aligns with 0.5 retrace of the $2,750→$2,450 fall—classic reversal pivot.
A clean hourly close >$2,620 opens the door to $2,680 (0.618 Fib) and psychological $2,700. Failure rejects to $2,520 support cluster.
5.2. Order-Book Heat Map
Coinbase Pro data shows 1,300 ETH ask wall at $2,620 and a thinner 890 ETH bid at $2,520. Liquidity skew favors dip-buying, but bulls need market orders >1 k ETH to smash the ask block.
________________________________________
6. On-Chain & Derivatives Lens
6.1. Exchange Reserves
Centralized exchanges now hold 12.9 million ETH, lowest since July 2017. The 19-day ETF harvest accelerated an already extant down-trend of roughly 60 k ETH/week outflows, mostly into staking contracts and L2 bridges.
6.2. Staking Flows
• Beacon deposit contract: +188 k in April’s first week.
• Withdrawal queue: 11 k ETH—tiny relative to deposits.
• Effective deposit APR after Dencun: 3.2 %, still beating U.S. 2-year T-notes post-tax for many investors.
6.3. Perpetual Funding & OI
• Funding normalized to 0.007 %/8 h (≈ 3.2 % APR), down from 9 % at March highs—spec longs flushed.
• Open Interest shed $420 m in the two-day dip—liquidations, not fresh shorts, drove the wash-out.
6.4. Options Skew
• 25-delta risk reversal (1-month): flipped to –4 % (puts pricier than calls) for first time since January—hedging demand but nowhere near panic-level (–12 % in 2022 bear).
________________________________________
7. Fundamental Undercurrents
7.1. Dencun Afterglow & L2 Fees
Proto-danksharding (EIP-4844) slashed L2 data costs by 85 %, pushing average Arbitrum and Optimism transaction fees under $0.02. Cheaper blockspace fuels on-chain activity:
Metric Pre-Dencun Post-Dencun Δ
Daily L2 Txns 2.4 m 4.1 m +71 %
Bridged ETH to L2s 6.8 m 7.9 m +16 %
More usage → more gas burned → structural tailwind to ETH as a fee-burn asset.
7.2. DeFi TVL
Total value locked rebounded to $61 billion, led by EigenLayer and restaking hype. ETH comprises 68 % of TVL collateral—every lending loop pins additional demand.
7.3. Competing Narratives
• Solana season siphoned retail mind-share; SOL/ETH ratio popped 42 % YTD.
• Bitcoin L2s (Stacks, Rootstock) attempt to mirror Ethereum’s smart-contract moat, but dev tooling remains nascent.
•
Net: Ethereum retains developer supremacy (70 % of new GitHub commits among smart-contract chains) and therefore garners institutional comfort.
________________________________________
8. Risks & Catalysts
Factor Bearish Angle Bullish Rebuttal
Macro Sticky U.S. CPI halts Fed cuts → higher real yields weigh on non-yielders ETH staking yield + MEV is real cash-flow; Dencun lowers L2 costs → adoption offset
SEC Spot ETF Delay past Jan 2026 or outright denial kills U.S. inflow dream 19-day streak proves ex-U.S. capital is hungry; approval >0 is all it takes for supply shock
BTC Dominance Halving FOMO may keep Bitcoin’s share >55 %, starve ETH rotation Historical pattern: ETH rips 6-10 weeks post-halving as beta plays catch-up
Tower-Top Pattern Weekly confirmation could spark drop to $2,200 support Pattern fails if bulls recapture $2,750 quickly, turning doji into bullish flag
________________________________________
9. Playbooks for Traders and Long-Term Allocators
9.1. Short-Term Momentum (0–7 days)
• Bias: Range-trade $2,520–$2,620 until breakout.
• Instruments: ETH-perp on Bybit/Deribit, 3× leveraged tokens for reduced funding bleed.
• Trigger: 15-minute candle above $2,620 with ≥ $50 m aggregated CVD buys.
• Stop: $2,560 (triangle retest).
• Target: $2,680 then $2,700.
9.2. Swing (1–8 weeks)
• Bias: Accumulate dips as long as weekly stays >$2,350 (0.382 Fib of Oct→Mar leg).
• Tools: 1-month $2,500-$2,800 call spreads; spot with 25 % collar protection.
• Catalysts: SEC commentary May 23, FOMC June 18.
9.3. Position (6–18 months)
• Bias: Dollar-cost average into staking nodes; carry 4 % ETH on portfolio NAV.
• Thesis: EIP-4844 usage boom + probable U.S. ETF = $4–5 k fair value by 2026.
• Risk Control: Hedge 25 % notional via BTC-perp short if BTC.D >58 %.
________________________________________
10. Conclusion: A Pause, Not a Peak—If Key Levels Hold
The 19-day ETF inflow streak proves that institutional demand for Ethereum exists even without a U.S. spot vehicle. Price responded vigorously but not parabolically, reflecting the asset’s growing market-cap gravity. The nascent “pre-tower-top” weekly candle warns of exhaustion; confirmation, however, requires another bearish week that cracks $2,540 support.
Short-term order-flow shows willing dip buyers, staking metrics scream supply sink, and the macro backdrop—while shaky—fails to dent ETH’s relative value proposition versus fiat yields. Translation: Ethereum is vulnerable to headline-driven squalls but structurally sound.
If bulls recapture $2,620, the path to retest $2,750 and ultimately $3,000 reopens. Lose $2,450 and the tower top will complete, sending ETH toward $2,200 where ETF inflow buyers likely reload. For now, the balance of evidence favors consolidation with an upward skew—tower construction, perhaps, but no wrecking ball yet.

ETH Bullish Setup: Pullback to 200_SMA(D) May Launch Next Rally Ethereum ( BINANCE:ETHUSDT ) seems to have finally managed to break the Resistance lines and the 200_SMA(Daily) in the fifth attack . However, the number of Resistance lines inside the Heavy Resistance zone($2,929_$2,652) is high, and Ethereum will find it difficult to break through them.
In terms of Elliott Wave theory , it seems that Ethereum is completing microwave 4 , and we should wait for this wave to complete. Microwave 4 could act as a pullback to the resistance lines and 200_SMA(Daily) .
I expect Ethereum to start rising from the Support zone($2,745_$2,650) again and rise to at least the Potential Reversal Zone(PRZ) .
Note: If Ethereum touches $2,537 , we can expect further declines.
Please respect each other's ideas and express them politely if you agree or disagree.
Ethereum Analyze (ETHUSDT), 1-hour time frame.
Be sure to follow the updated ideas.
Do not forget to put a Stop loss for your positions (For every position you want to open).
Please follow your strategy and updates; this is just my Idea, and I will gladly see your ideas in this post.
Please do not forget the ✅' like '✅ button 🙏😊 & Share it with your friends; thanks, and Trade safe.

ETH Just Broke Out — Here’s Why $3,445 and $3,995 Are TPsEthereum is showing a strong bullish structure on the daily chart, having recently broken out of a month-long consolidation channel. After spending over 35 days trading in a narrow sideways range between approximately $2,345 and $2,780, ETH has now pushed through the upper boundary of that zone, signaling a shift in momentum.
This breakout from the accumulation zone is significant. The highlighted box on the chart indicates a period of low volatility and tight price compression—often a precursor to a sharp directional move. The breakout candle was decisive and supported by rising volume, as confirmed by the PVT (Price Volume Trend) indicator, which shows a clear uptick in accumulation. This suggests that institutional and smart money may be positioning for further upside.
The reclaimed level around $2,503, previously acting as major support, is now serving as a strong base. If ETH continues to close daily candles above this threshold, the bullish momentum is likely to continue. The immediate resistance lies around $3,445, marking the first target zone (TP1), followed by a more ambitious extension toward $3,995, which aligns with Resistance Level 2 (TP2). These targets represent gains of approximately 21% and 41% from current levels, respectively.
A measured trade setup from the current zone offers a solid risk-reward ratio of 2.4. The stop loss is reasonably placed just below the breakout structure at $2,344. If ETH falls back below this level and closes inside the previous channel, the breakout would be invalidated, and bulls would need to reassess.
This setup aligns with a classic trend continuation pattern—breakout from consolidation, volume confirmation, and a potential retest of the breakout level. As long as price remains above $2,503, bulls remain in control, and the medium-term outlook remains favorable.
In conclusion, Ethereum appears poised for a bullish continuation on the daily timeframe. The channel breakout, rising accumulation pressure, and clean technical structure support the idea that ETH may soon challenge higher resistance zones. However, price must hold above key support to maintain this bias. Traders and investors may view current levels as a favorable risk-entry opportunity with eyes on $3,445 and $3,995 as major profit zones.

ETH Price Prediction June: Don't Ignore Ethereum's Path to $3KEthereum, the second-largest cryptocurrency by market capitalization, is once again commanding significant attention across the digital asset landscape. As the broader market navigates periods of uncertainty and consolidation, Ethereum appears to be carving out a distinct path, demonstrating remarkable resilience and attracting substantial capital inflows. A confluence of factors, including a new all-time high in a critical on-chain metric, robust institutional interest, and a building technical momentum, suggests that ignoring Ethereum at this juncture would be a misstep for any serious investor. The current market dynamics are painting a compelling picture for Ether's trajectory, particularly as June unfolds, with analysts eyeing significant price levels.
The Unignorable Signal: A New All-Time High in a Major Metric
The digital asset space is often characterized by its volatility and rapid shifts in sentiment. Yet, beneath the surface of daily price fluctuations, fundamental indicators often provide the most profound insights into the health and growth of a blockchain network. For Ethereum, a recent development has sent a clear signal that cannot be overlooked: a major network metric has reached an unprecedented all-time high. While the specific metric can vary, such milestones typically point to an underlying surge in network utility, user adoption, or developer activity.
Consider, for instance, metrics like the total value locked (TVL) in decentralized finance (DeFi) protocols built on Ethereum, the number of active addresses engaging with the network, or the aggregate gas consumption, which reflects overall network demand. A new peak in any of these areas signifies a robust and expanding ecosystem. If the all-time high is in TVL, it suggests that more capital is flowing into and being utilized within Ethereum’s DeFi applications, indicating growing trust and utility in its financial primitives. An increase in active addresses points to a wider user base interacting with the network for various purposes, from transacting to engaging with decentralized applications (dApps). Similarly, sustained high gas consumption, even if it leads to higher transaction fees, underscores the immense demand for block space on the Ethereum blockchain, a testament to its indispensable role in the decentralized internet.
This surge in a key metric is not merely a statistical anomaly; it represents a fundamental validation of Ethereum's long-term vision and its ongoing evolution. It suggests that despite market corrections or periods of sideways trading, the underlying utility and adoption of the Ethereum network continue to grow unabated. This organic growth, driven by real-world use cases and an ever-expanding developer community, forms a strong bedrock for future price appreciation. Pundits are right to highlight this signal, as it separates Ethereum from purely speculative assets and firmly places it in the category of a foundational technology with increasing real-world relevance. It implies that the network's value proposition is strengthening, attracting more users, developers, and capital, thereby reinforcing its position as the leading smart contract platform.
Institutional Endorsement: $296 Million Inflows and a Historical Week
Perhaps one of the most compelling narratives surrounding Ethereum's current strength is the undeniable surge in institutional interest. In a market environment often described as a "slowdown," Ether investment products witnessed an astonishing $296 million in inflows last week. This figure is not just significant in absolute terms; it marks the best week for Ether crypto funds since the election of former US President Donald Trump, a period that dates back several years and encompasses numerous market cycles
.
This monumental inflow of capital from institutional players is a powerful vote of confidence in Ethereum. It signifies that large-scale investors, including hedge funds, asset managers, and family offices, are increasingly allocating significant portions of their portfolios to Ether. Such inflows are particularly noteworthy during a "market slowdown," as they suggest a strategic long-term positioning rather than speculative short-term trading. While retail investors might be more susceptible to market sentiment swings, institutional investors typically conduct extensive due diligence and operate with a longer investment horizon. Their willingness to deploy hundreds of millions of dollars into Ether products indicates a conviction that Ethereum represents a valuable asset with substantial growth potential, capable of delivering strong returns over time.
The context of these inflows is also crucial. Investors are currently awaiting clarity from the US Federal Reserve's June rate decision, a macroeconomic event that often casts a shadow of uncertainty over risk assets. Despite this prevailing caution, institutional money continued to flow into Ethereum, underscoring a belief in its intrinsic value and its ability to perform independently of, or even as a hedge against, traditional market volatility. This behavior suggests that institutions view Ethereum not just as a speculative digital currency, but as a critical piece of the emerging digital economy, akin to a technology stock with immense disruptive potential. The steady accumulation by these sophisticated players provides a strong floor for Ether's price and signals a maturation of the asset class, moving beyond the fringes into mainstream financial portfolios. This institutional embrace is a critical catalyst, providing liquidity, stability, and legitimacy to the Ethereum ecosystem.
Consolidation and Momentum: Setting the Stage for June's Price Action
From a technical analysis perspective, Ethereum's price action has recently been characterized by a period of consolidation. Consolidation, in market terms, refers to a phase where an asset's price trades within a relatively narrow range, often after a significant price movement. This period is typically seen as a time for the market to digest previous gains or losses, allowing for accumulation or distribution before the next major move. For Ethereum, this consolidation is occurring while momentum is visibly building.
The concept of "momentum building" implies that underlying buying pressure is gradually increasing, even if the price isn't making dramatic upward moves on a daily basis. This can manifest through higher lows, decreasing selling pressure at key support levels, and a gradual increase in trading volume during upward movements. This type of price action is often considered healthy, as it allows the market to establish a strong base from which to launch its next leg up. Rather than a parabolic and unsustainable surge, a period of consolidation followed by building momentum suggests a more organic and sustainable growth trajectory. It allows early investors to take profits, new investors to enter, and the market to find a new equilibrium before breaking out.
Ethereum June Price Prediction: Key Levels to Watch
Given the current market dynamics, including the new all-time high in a major metric, the significant institutional inflows, and the building technical momentum, analysts are increasingly bullish on Ethereum's prospects for June. A prominent analyst has explicitly stated that a target of $3,000 is "in sight" for the month. This specific price target is not arbitrary; it likely stems from a combination of technical indicators, such as Fibonacci extensions, previous resistance levels, and psychological price points, combined with the strong fundamental and institutional tailwinds.
To reach and sustain the $3,000 level, Ethereum will need to navigate several key price points. Currently, the immediate resistance levels might be found around recent local highs, perhaps in the range of $2,500 to $2,700. Breaking through these levels with conviction, ideally on increased volume, would confirm the building momentum and pave the way for further upward movement. The psychological barrier of $3,000 itself is significant; once breached, it can often act as a new support level, attracting further buying interest and reinforcing bullish sentiment.
On the downside, key support levels would be crucial to watch. These might lie around the lower bounds of the recent consolidation range, potentially in the $2,200 to $2,300 area. A strong bounce from these levels, should the price retest them, would confirm the underlying strength and the presence of buyers willing to defend these price points. A more significant support could be found around the $2,000 mark, a major psychological and technical level that has historically proven to be a strong area of interest. Maintaining above these critical support zones would be essential to keep the bullish narrative intact and to validate the analyst's $3,000 target.
Factors that could influence this trajectory include the aforementioned US Fed rate decision, which could either provide clarity and boost risk appetite or introduce further caution. Additionally, ongoing developments within the Ethereum ecosystem, such as progress on scalability solutions (Layer 2 networks) and the continued growth of its dApp ecosystem, will play a role. Any major news regarding regulatory clarity or institutional product launches could also act as significant catalysts. However, the current confluence of strong on-chain fundamentals and institutional demand provides a robust foundation for the projected price appreciation.
Ethereum's Enduring Significance and Future Outlook
Beyond the immediate price predictions and market movements, it is crucial to remember Ethereum's enduring significance in the broader cryptocurrency and blockchain landscape. Ethereum is not merely a digital currency; it is the foundational layer for the vast majority of decentralized applications, non-fungible tokens (NFTs), and the burgeoning decentralized finance (DeFi) sector. Its smart contract capabilities have enabled an explosion of innovation, creating an entirely new digital economy that continues to expand at an exponential rate.
The ongoing advancements within the Ethereum ecosystem, particularly the continuous development of its scalability solutions and the transition towards a more energy-efficient consensus mechanism, are critical for its long-term viability and growth. These technical improvements aim to address network congestion and high transaction fees, making Ethereum more accessible and efficient for a global user base. As these solutions mature and become more widely adopted, Ethereum's capacity to host and process an ever-increasing volume of transactions will only strengthen, further solidifying its position as the backbone of the decentralized web.
The "do not ignore" message resonates deeply with Ethereum's fundamental value proposition. It is a network that is constantly evolving, attracting the brightest minds in technology, and demonstrating real-world utility that extends far beyond speculative trading. The combination of a thriving developer community, a vibrant ecosystem of dApps, growing institutional acceptance, and a clear roadmap for future improvements positions Ethereum as a cornerstone of the digital future. The current market signals, from the new all-time high in a key metric to the unprecedented institutional inflows, are not just fleeting trends but indicators of a profound shift in how the financial world and broader society view and utilize this revolutionary technology.
In conclusion, Ethereum stands at a pivotal moment. The convergence of strong on-chain fundamentals, evidenced by a new all-time high in a major network metric, and a significant influx of institutional capital underscores its growing maturity and undeniable importance. Despite broader market uncertainties, Ether investment products have seen historical inflows, signaling deep-seated confidence from sophisticated investors. Technically, the asset is consolidating, building momentum that analysts believe could propel it towards the $3,000 mark in June. For those observing the digital asset space, the message is clear: Ethereum is not just surviving a market slowdown; it is thriving, evolving, and cementing its role as an indispensable pillar of the decentralized economy. Ignoring its current trajectory would be to miss a significant chapter in the ongoing digital revolution.

ETH Price Action Explained – What the Charts Are Really Saying?🔍 Taking a look at Ethereum ETH right now across multiple timeframes…
On the lower timeframes ⏱️, we’re seeing a bullish break 💥 that might spark some enthusiasm 🚀, but when you zoom out and get that macro perspective 🌐, my outlook shifts from to one of caution ⚠️.
📊 ETH is currently trading into a key resistance level 🧱, and if we step back and view the bigger picture, we can clearly see that it’s been range-bound 🔁 for quite some time.
On the lower timeframes, there might be an opportunity to squeeze a bit out of the range 🎯 by trading between the highs and lows—but keep in mind, this approach is not for the feint hearted ⚡.
📹 This video is purely analysis 🧠, not a trade idea. I’m sharing my thoughts and market view 📈, and I hope you find it helpful and insightful 💡.
🚫 Not financial advice.

ETH | New ATH on the cards | Fibonacci $7K TARGET Ethereum is gearing up towards the upside and we're seeing another resistance zone being crushed.
While BTC is trading sideways, we can expect ETH to play catch-up:
Don't miss yesterday's update on DOT:
_____________________________

Ethereum - Expecting Bullish Continuation In The Short TermH1 - We have a clean bullish trend with the price creating a series of higher highs, higher lows structure.
This strong bullish momentum is followed by a pullback.
No opposite signs.
Until the two Fibonacci support zones hold I expect the price to move higher further.
If you enjoy this idea, don’t forget to LIKE 👍, FOLLOW ✅, SHARE 🙌, and COMMENT ✍! Drop your thoughts and charts below to keep the discussion going. Your support helps keep this content free and reach more people! 🚀
--------------------------------------------------------------------------------------------------------------------
Disclosure: I am part of Trade Nation's Influencer program and receive a monthly fee for using their TradingView charts in my analysis.

ETH/USDT Trade Setup: Bullish Trend, Entry Zone & More🚀 ETH/USDT Trade Setup 💸📊
Keeping a close eye on Ethereum paired with USDT right now. 🔍📈
ETH has been holding a solid bullish trend, with healthy pullbacks into value zones that have repeatedly offered discounted long entries. 🛒⚡
I’m bullish overall, looking to trade with the trend. Looking for ETH to dip into my preferred entry zone. 🎯
🛡️ Stop-loss to go just beneath the most recent swing low to keep risk tight and controlled.
In this video, I cover:
🔹 How I apply Fibonacci tools to dial in my entry points and targets
🔹 My full ETH game plan, including the zones I'm watching and how I’m managing this setup
⚠️ Not financial advice. Always do your own due diligence and risk management.
💬 Are you trading ETH right now? What are your thoughts? Let me know in the comments below! 👇🔥

ETH/USDT At A Premium — What’s Next? Smart Entry Strategy!I'm currently analyzing ETH/USDT 🧠💹 — Ethereum has been in a strong bullish trend, recently pushing into all-time highs 🚀🔝. While the momentum remains intact, price is now trading at a premium 🏷️, and I’m cautious about entering long at these elevated levels ⚠️.
In the video, we break down the trend, market structure, and price action with precision 📊🧱. I also explore potential entry scenarios that align with low-risk, high-probability setups 🎯🔍 — ideal for those waiting for the right moment to engage without chasing the move.
You'll also get a deep dive into my Trend Continuation Strategy 🔄📈 — a powerful framework for identifying smart entries in trending markets.
🛑 This is not financial advice

ETH 2025: $3000 is Key to Escaping Ethereum's Consolidation TrapEthereum (ETH) May Remain Consolidated Throughout 2025 if it Fails to Hit $3000: Here’s Why!
May 27, 2025 – Ethereum (ETH), the world's second-largest cryptocurrency, finds itself at a critical juncture. After a period of significant volatility and notable gains, ETH's price has entered a prolonged consolidation phase. While numerous bullish signals point towards a potential surge, a formidable barrier stands at the $3000 mark. Failure to decisively conquer this level could see Ethereum locked in a sideways trading pattern throughout much of 2025, deferring hopes of a new explosive bull run. This article delves into the intricate factors dictating Ethereum's price trajectory, exploring the tug-of-war between bullish aspirations and the stubborn realities of market resistance.
Section 1: The Current State of Ethereum - A Prolonged Consolidation
As of late May 2025, Ethereum continues to trade within a defined range, struggling to make a sustained break in either direction. The price has been attempting to pierce pivotal resistance zones, with recent attempts this month failing to hold despite decent volume. Some market observers note that Ethereum is currently consolidating between the $2,400 and $2,750 range. This period of consolidation is not unusual in cryptocurrency markets, often representing a "breather" after significant price movements or a period of price discovery as market participants digest new information and sentiment.
Historical chart patterns suggest that Ethereum may have entered a crucial price range, an "accumulation zone," which could prevent a significant breakout for several months. Certain technical indicators, which help identify trends when growth rates fluctuate, show ETH price entering bands that have historically preceded consolidation periods, sometimes lasting nearly a year, before the next major bullish wave. Given that ETH has already consolidated for approximately four months, another similar period could be on the horizon if key resistance levels are not breached.
This consolidation is a focal point for investors and analysts alike. On one hand, it can be seen as a period of building strength before the next upward move. On the other, prolonged consolidation can lead to investor fatigue and a potential drift lower if bullish catalysts fail to materialize. The market is currently in a state of anticipation, closely watching for signals that could indicate the end of this sideways movement. Ethereum's price is currently hovering in the mid-$2,500s, recovering slightly after brief consolidation and respecting key support levels.
Section 2: The $3000 Hurdle - A Critical Inflection Point
The $3000 level for Ethereum is more than just a number; it represents a significant psychological and technical barrier. A decisive break above this level would likely instill strong bullish sentiment, potentially paving the way for further gains towards previous highs and beyond. Conversely, a repeated failure to surmount $3000 could confirm the strength of the resistance, leading to a loss of upward momentum and an extended period of consolidation throughout 2025.
Market sentiment often coalesces around such round numbers. A breakthrough can trigger a fear of missing out, attracting fresh capital. Failure, however, can lead to disappointment and profit-taking, reinforcing the consolidation range. As of May 2025, ETH is expected by some to trade between $2,400 and $2,900, with a monthly close above $2,750 strengthening the case for retesting $3,000 in the coming quarter. Some projections suggest ETH might hover near the $3000 resistance in the summer months, potentially seeing profit-taking before a new range is established. If ETH fails to rise above the ascending trend line it has held since mid-2022, and with technicals like a potential bearish "Death Cross" (where a shorter-term moving average crosses below a longer-term moving average on weekly charts), the price could remain restricted below $2500 for a while, making the $3000 target even more challenging in the near term.
Section 3: Bullish Signals Amidst Consolidation - The Hope for a Breakout
Despite the consolidation, several bullish signals offer hope for an eventual breakout and a more dynamic 2025 for Ethereum.
Altseason Hopes
The term "altseason" refers to a market phase where alternative cryptocurrencies (altcoins) experience significant price surges, often outperforming Bitcoin. Ethereum, as the leading altcoin, plays a crucial role in signaling or even triggering such a season.
Recent technical analysis suggests that Ethereum has reclaimed a key technical level – the mid-line of a significant channel indicator on the two-week chart. This moving average-based band tracks long-term momentum. Historically, closing above this mid-line has preceded sharp price gains for ETH and marked the start of altseasons. For instance, after surpassing this mid-line in 2020-2021, ETH rallied dramatically. A similar pattern in late 2023 saw ETH climb significantly within a year. As of May 2025, the upper band of this channel represents the next significant resistance. A breakout above this could target previous cycle highs.
The impact on the broader altcoin market has also been historically significant. The combined market cap of altcoins (excluding ETH) surged considerably over a year after Ether's close above this channel's midline in past cycles. Some analysts suggest that ETH reaching certain key levels could signal the potential onset of an alt season.
Bitcoin Dominance and Altcoin Market Cap
The prospect of a 2025 altseason is further supported by patterns related to Bitcoin dominance – Bitcoin's market share of the total crypto market capitalization. Historically, after Bitcoin halvings, Bitcoin dominance tends to drop sharply, triggering altcoin rallies. This was observed in previous post-halving periods. With the latest halving in April 2024, a similar period is approaching, and a decline in Bitcoin dominance could occur within the next few months. If this trend repeats, some market observers anticipate the altcoin market cap could surge toward substantially higher figures. A falling Bitcoin dominance implies that capital is shifting from Bitcoin to altcoins, making them the market's primary focus.
Technical Formations
Several bullish technical patterns are currently visible on Ethereum's charts:
• Ascending Triangle: Ethereum's price action has been forming an ascending triangle pattern, characterized by a horizontal resistance level and a rising support line. This pattern typically indicates that buyers are gaining strength, pushing prices to higher lows against a flat resistance. A breakout above the horizontal resistance of this pattern could lead to a significant upward move.
• Inverse Head and Shoulders: Some analysts have identified an inverse head and shoulders pattern on daily trading charts, a classic bullish reversal pattern. The neckline of this pattern is cited around the $2,700 mark. A decisive close above this level could confirm the breakout, with an immediate target of $3,000.
• Bull Flag: On the daily chart, Ethereum appears to be forming a bull flag pattern, which is a bullish continuation pattern that typically follows a strong rally. The current sideways price action forms the flag, and a breakout could lead to a significant price increase.
• Bullish Market Structure: Despite the consolidation, the broader market structure for Ethereum can still be interpreted as bullish, with the potential for consecutive higher highs and higher lows to remain intact if key support levels hold. ETH trading above its key Exponential Moving Averages (EMAs) indicates a strong technical structure.
Analyst Sentiment
Market observers are cautiously optimistic, with many eyeing the $3,000 level as the next major milestone. Some predict that if Ethereum stays above $2,550, a breakout toward higher levels is likely in the near term. Holding above $2,500 is seen as crucial. If bullish momentum persists and broader crypto sentiment remains favorable, ETH could target the $4,000–$4,500 range later in 2025. Institutional interest, evidenced by spot Ether ETFs attracting inflows and Ethereum's growing market capitalization, also underpins a positive outlook.
Section 4: The Bearish Undertones - Risks and Fragility
Despite the array of bullish signals, Ethereum's path is not without significant obstacles and inherent fragilities.
Substantial Supply Near Cost Basis
A concerning factor highlighted by on-chain data is the substantial amount of Ethereum supply acquired near the current price levels. Analysis of blockchain data indicates that a very large volume of ETH supply, valued in the tens of billions of dollars, is near its cost basis and at risk of flipping into a loss if prices dip. This creates a precarious situation. If ETH's price were to fall below these investors' average acquisition price, it could trigger a wave of selling as holders try to minimize losses or break even. This sell-side pressure could exacerbate any downward trend or prolong the consolidation phase. There is also a significant cluster of investor cost-basis distribution around the $2,800 price level, implying potential sell-side pressure as ETH approaches this zone from investors looking to offload assets near breakeven.
Stubborn Resistance Levels
Ethereum is currently coiling under significant resistance. The $2,700 level has proven to be a formidable barrier, with ETH facing rejections multiple times in May. This level represents a key hurdle for bulls. Failure to convincingly break above $2,700, and subsequently $2,800 and the ultimate $3,000 target, could see selling pressure intensify. Each failed attempt can strengthen the perception of these levels as a ceiling, encouraging more traders to sell at these points.
Macroeconomic and Market-Wide Factors
The broader cryptocurrency market is susceptible to macroeconomic headwinds. Factors such as interest rate policies from central banks, regulatory developments, and global economic stability can significantly impact investor sentiment and capital flows into riskier assets like cryptocurrencies. While some anticipate potential interest rate cuts later in 2025 which could be bullish, ongoing quantitative tightening could pose a challenge. Bitcoin's dominance, while potentially set to fall, has also surged in early 2025, overshadowing altcoins for a period and reflecting a "risk-off" environment at times. Any negative shifts in these broader conditions could dampen Ethereum's breakout prospects, regardless of its specific technical or on-chain signals.
Section 5: Why Failure to Hit $3000 Could Mean Extended Consolidation in 2025
The $3000 mark is a critical psychological and technical threshold for Ethereum. Should the cryptocurrency fail to breach this level decisively in the coming months, several factors could contribute to an extended period of consolidation throughout 2025.
• Loss of Upward Momentum: A failure to achieve a widely anticipated price target like $3000 can significantly dampen investor enthusiasm. Bullish momentum is often self-reinforcing; when it stalls at a major resistance, the energy can dissipate, leading to a more cautious or bearish sentiment. Traders who bought in anticipation of a breakout might exit their positions, adding to selling pressure.
• Strengthening of Resistance: Each time a price level like $3000 (or even preceding levels like $2,700-$2,800) successfully repels an upward advance, it becomes a more established and psychologically potent resistance zone. More market participants will view it as a ceiling, placing sell orders around it, thus making future breakouts even more difficult.
• Capital Rotation: If Ethereum's price remains stagnant while other cryptocurrencies or asset classes show more promising returns, capital may flow out of ETH. Investors are constantly seeking the best risk-adjusted returns, and a prolonged consolidation in ETH could lead them to look for opportunities elsewhere in the dynamic crypto space or even in traditional markets.
• Investor Fatigue and Profit-Taking: Extended periods of sideways movement can lead to investor fatigue. Those who have been holding ETH through the consolidation might become impatient and decide to sell, either to lock in existing profits (if any) or to free up capital for other ventures. This is particularly true for the significant portion of supply bought near current price levels, where the desire to break even can lead to selling pressure if upward momentum wanes.
• Confirmation of Historical Patterns: As mentioned earlier, historical chart patterns suggest that Ethereum can enter extended consolidation phases before major bull runs. A failure to break $3000 would align with these historical precedents, suggesting that the market might indeed be settling in for a longer period of range-bound trading.
• Impact on "Altseason" Narrative: Ethereum's performance is often seen as a bellwether for the broader altcoin market. If ETH struggles to break key resistance and enter a clear uptrend, it could delay or diminish the prospects of a widespread "altseason," further contributing to a more subdued market environment for ETH itself.
Essentially, a failure at $3000 would signal that the current buying pressure is insufficient to overcome the selling interest at that level. This equilibrium could persist for an extended period, leading to the price oscillating within a defined range as bulls and bears remain in a deadlock. Until a significant catalyst emerges – be it a major network upgrade with immediate perceived value, a shift in macroeconomic conditions, or a surge in institutional demand that overwhelms sellers – Ethereum could find itself tracing a path of consolidation through 2025.
Section 6: Scenarios for 2025
Looking ahead, Ethereum's trajectory in 2025 largely hinges on its ability to overcome the current consolidation and the critical $3000 resistance. Several scenarios could unfold:
Scenario 1: Breaching $3000 and Igniting a Bull Run
This is the optimistic scenario favored by many ETH proponents.
• The Breakout: Ethereum successfully smashes through the $2,700-$2,800 resistance zone and then decisively conquers the $3000 psychological barrier. This breakout would likely be accompanied by a surge in trading volume, confirming strong buying interest.
• Targets: Once $3000 is overcome, analysts eye targets such as $3,200, $3,500-$3,600, and previous cycle highs around $4,100. Some even more bullish long-term predictions based on chart patterns suggest significantly higher targets if momentum is sustained.
• Altseason Trigger: A strong ETH rally, particularly one driven by reclaiming key technical levels, could indeed trigger a wider altseason. This would see significant capital flow into other altcoins, potentially leading to a massive altcoin market cap surge if Bitcoin dominance concurrently falls.
• Market Sentiment: Overall market sentiment would turn decisively bullish, fueled by positive price action and the realization of long-awaited breakouts. Institutional interest would likely further increase.
Scenario 2: Failure at $3000 and Continued Consolidation Throughout 2025
This scenario represents the central thesis of this article – a prolonged period of sideways trading.
• The Rejection: Ethereum makes attempts to break $3000 (or even struggles to consistently hold above $2700-$2800) but is repeatedly met with strong selling pressure. The price fails to establish a sustained uptrend above these key levels.
• Trading Range: ETH would likely continue to trade within a familiar range, potentially bounded by support levels around $2,300-$2,500 and resistance capping gains below $3000. This range could persist for a significant portion of 2025.
• Investor Sentiment: Investor sentiment would likely become mixed and potentially frustrated. While long-term believers might continue to accumulate, shorter-term traders could become disengaged due to a lack of volatility and clear direction. The "wait-and-see" approach would dominate.
• Impact on Altcoins: A stagnant Ethereum could dampen enthusiasm for a broad altseason, leading to more selective and narrative-driven gains in the altcoin market rather than a widespread euphoric rally.
Scenario 3: A Bearish Breakdown
While many signals are bullish or neutral (consolidating), a bearish breakdown remains a possibility, especially if broader market conditions deteriorate or if key supports fail.
• Support Failure: Key support levels, such as $2,450, $2,300, or even the psychological $2,000 mark, are breached decisively. This could be triggered by the large supply near cost basis flipping into loss and causing a cascade of selling.
• Negative Catalysts: This scenario could be exacerbated by negative macroeconomic news, stringent regulatory actions, or unforeseen issues within the Ethereum ecosystem.
• Price Action: A bearish breakdown would see Ethereum enter a downtrend, potentially revisiting lower support levels from previous market cycles. Technical indicators like a "Death Cross" on weekly charts, if confirmed, would add to bearish sentiment.
• Market Sentiment: Fear and uncertainty would grip the market, leading to a flight to safety, possibly increasing Bitcoin dominance or a move towards stablecoins.
•
The most probable outcome will depend on a confluence of technical breakouts, fundamental developments within the Ethereum ecosystem (like the impact of future upgrades), institutional adoption trends, and the overarching macroeconomic environment.
Section 7: Conclusion
Ethereum stands at a pivotal moment in May 2025. The allure of a significant rally towards $4,000 and beyond, potentially heralding a new altseason, is palpable, supported by historical precedents and bullish chart patterns. However, the path is fraught with challenges, most notably the formidable psychological and technical resistance clustered around the $2,700 to $3,000 levels.
The current consolidation phase, while potentially a healthy accumulation period, also carries the risk of morphing into prolonged stagnation if upward momentum cannot be decisively seized. The significant volume of ETH supply hovering near its cost basis presents a tangible threat, where a dip could trigger further selling pressure, reinforcing the consolidation or even leading to a decline.
Therefore, the central thesis holds considerable weight: should Ethereum fail to convincingly breach the $3000 mark in the coming months, it is highly plausible that the cryptocurrency could remain locked in a consolidative pattern for much of 2025. This would test the patience of investors and potentially delay the much-anticipated fireworks of a full-blown altseason.
The cryptocurrency market is notoriously dynamic and influenced by a myriad of unpredictable factors. While technical analysis and on-chain data provide valuable insights, they are not infallible crystal balls. Investors and traders must remain vigilant, continuously reassessing the evolving landscape, managing risk, and preparing for various potential outcomes as Ethereum navigates this critical juncture. The battle for $3000 will likely define ETH's narrative for the remainder of the year.

Ethereum Golden Cross: ETH Eyes $3,000 BreakoutEthereum Flashes Golden Cross: A Bullish Beacon or a Fleeting Glimmer for the $3,000 Target?
The cryptocurrency market is once again abuzz with technical signals, and this time, Ethereum (ETH), the second-largest cryptocurrency by market capitalization, is in the spotlight. Traders and analysts are keenly observing a "Golden Cross" that has recently manifested on Ethereum's price charts. This classic bullish indicator has historically been associated with potential upward momentum, igniting discussions and hopes among investors: could this be the catalyst that propels ETH bulls to conquer the coveted $3,000 price level?
Understanding the Golden Cross: A Primer
Before diving into Ethereum's specific prospects, it's crucial to understand what a Golden Cross signifies. In technical analysis, a Golden Cross occurs when a shorter-term moving average (MA) of an asset's price crosses above a longer-term moving average. Most commonly, this involves the 50-day moving average (50-MA) moving above the 200-day moving average (200-MA).
The rationale behind its bullish interpretation is straightforward: the 50-MA reflects the average price over the last 50 trading days, representing recent momentum. The 200-MA, on the other hand, represents the longer-term trend. When the shorter-term momentum (50-MA) surpasses the longer-term trend (200-MA) from below, it suggests that the recent buying pressure and positive price action are strong enough to potentially shift the overall market sentiment and initiate a more sustained uptrend.
However, it's vital to approach this signal with a degree of caution. The Golden Cross is a lagging indicator, meaning it confirms a trend that has already been underway for some time, rather than predicting a future one with certainty. By the time a Golden Cross appears, a significant portion of the initial upward move might have already occurred. Furthermore, like all technical indicators, it's not infallible. False signals can happen, where a Golden Cross appears but fails to lead to a sustained rally, sometimes even preceding a market downturn. Therefore, while a Golden Cross is a positive sign, it’s best used in conjunction with other indicators and a broader market analysis.
Ethereum's Current Landscape and the Significance of the Signal
For Ethereum, the appearance of a Golden Cross is a noteworthy development, especially considering its price action in recent months. After periods of consolidation and navigating broader market uncertainties, such a signal can inject a fresh wave of optimism. It often attracts trend-following traders and algorithms programmed to react to such patterns, potentially increasing buying pressure.
The journey towards $3,000 for Ethereum is not just a numerical target; it represents a significant psychological level. Reclaiming this mark would signify a strong recovery and could pave the way for further exploration of higher price territories. The Golden Cross, in this context, acts as a technical validation for bulls who believe in Ethereum's underlying fundamentals and its potential for growth.
Factors Fueling the Bullish Case for ETH to $3,000
Several factors, beyond the Golden Cross itself, could support a bullish push for Ethereum towards the $3,000 milestone:
1. Strong Network Fundamentals: Ethereum continues to be the dominant smart contract platform, hosting the vast majority of decentralized finance (DeFi) applications, non-fungible tokens (NFTs), and a burgeoning ecosystem of Layer 2 scaling solutions. Ongoing development, such as progress on future upgrades aimed at enhancing scalability and efficiency (like proto-danksharding with EIP-4844), bolsters long-term confidence.
2. The Impact of "The Merge" and Staking: The transition to a Proof-of-Stake (PoS) consensus mechanism (The Merge) has fundamentally changed Ethereum's tokenomics. It significantly reduced new ETH issuance and, coupled with the EIP-1559 fee-burning mechanism, has often made ETH deflationary during periods of high network activity. The growth in staked ETH, which secures the network and earns rewards for stakers, also reduces the liquid supply available on exchanges, potentially creating upward price pressure.
3. Layer 2 Scaling Solutions Gaining Traction: Solutions like Arbitrum, Optimism, zkSync, and StarkNet are increasingly handling a significant portion of Ethereum's transaction load. This alleviates congestion on the mainnet, reduces gas fees for users interacting with these Layer 2s, and improves the overall user experience, making the Ethereum ecosystem more attractive and scalable. As these solutions mature and gain wider adoption, they enhance Ethereum's value proposition.
4. Renewed Institutional Interest: While institutional adoption of crypto can be cyclical, a clear bullish signal like a Golden Cross, combined with improving macroeconomic conditions or regulatory clarity, could reignite interest from larger financial players looking for exposure to digital assets beyond Bitcoin. Ethereum's utility and its role as a platform for decentralized applications make it an attractive candidate for institutional portfolios.
5. Positive Market Sentiment: The cryptocurrency market is heavily influenced by sentiment. A Golden Cross can contribute to a positive feedback loop: the signal encourages buying, which pushes prices up, further reinforcing bullish sentiment and attracting more participants. If Bitcoin, the market leader, also shows strength, it often creates a favorable environment for altcoins like Ethereum to rally.
6. Growing NFT and DeFi Ecosystems: Despite market fluctuations, innovation within the NFT and DeFi sectors on Ethereum continues. New use cases, improved user interfaces, and greater mainstream adoption of these technologies can drive demand for ETH, which is used to pay for transactions and interact with these applications.
Potential Headwinds and Obstacles on the Path to $3,000
Despite the optimism generated by the Golden Cross, several challenges could hinder Ethereum's ascent to $3,000:
1. Macroeconomic Uncertainty: Broader economic factors, such as inflation rates, interest rate policies by central banks, and geopolitical events, can significantly impact risk assets, including cryptocurrencies. A deteriorating macroeconomic outlook could dampen investor appetite and stall any potential rally.
2. Regulatory Scrutiny: The regulatory landscape for cryptocurrencies remains a significant unknown in many jurisdictions. Unfavorable regulations or enforcement actions targeting Ethereum, DeFi, or staking could negatively impact its price.
3. Technical Resistance Levels: The path to $3,000 is likely to encounter several technical resistance levels where selling pressure might increase. Traders will be closely watching these zones, and failure to break through them decisively could lead to pullbacks.
4. Profit-Taking: As the price of ETH rises, especially after a significant signal like a Golden Cross, traders who bought at lower levels may decide to take profits, creating selling pressure that needs to be absorbed by new buyers for the uptrend to continue.
5. Competition: While Ethereum is the dominant player, it faces ongoing competition from other Layer 1 blockchains (e.g., Solana, Avalanche, BNB Chain) that also aim to offer scalable smart contract platforms. Significant advancements or adoption shifts towards competitors could impact Ethereum's market share and sentiment.
6. The "False Signal" Risk: As mentioned earlier, no technical indicator is perfect. The Golden Cross could prove to be a false signal if broader market conditions turn bearish or if unforeseen negative catalysts emerge.
Conclusion: A Promising Signal, But Prudence is Key
The appearance of a Golden Cross on Ethereum's charts is undeniably a positive development that warrants attention. It provides a technical basis for bullish optimism and could indeed be a contributing factor if ETH is to make a sustained push towards the $3,000 mark. The combination of this signal with Ethereum's strong network fundamentals, ongoing technological advancements, and the deflationary pressures from its tokenomics paints a compelling picture for potential price appreciation.
However, investors should approach this scenario with a balanced perspective. The Golden Cross is a piece of the puzzle, not the entire picture. Its predictive power is enhanced when considered alongside other market indicators, fundamental analysis, and the overall macroeconomic environment. While bulls may feel emboldened by this signal, the path to $3,000 will likely involve navigating volatility, overcoming resistance levels, and contending with potential external shocks.
Ultimately, whether Ethereum can leverage this Golden Cross to reach $3,000 will depend on a confluence of factors: sustained buying momentum, continued positive developments within the Ethereum ecosystem, a favorable broader market sentiment, and the absence of significant negative catalysts. For now, the Golden Cross serves as a beacon of hope for ETH holders, but diligent research, risk management, and an awareness of the inherent uncertainties in the crypto market remain paramount.

Ethereum - Short Term Buy IdeaH1 - Strong bullish move.
No opposite signs.
Currently it looks like a pullback is happening.
Expecting further continuation higher until the two Fibonacci support zones hold.
If you enjoy this idea, don’t forget to LIKE 👍, FOLLOW ✅, SHARE 🙌, and COMMENT ✍! Drop your thoughts and charts below to keep the discussion going. Your support helps keep this content free and reach more people! 🚀
--------------------------------------------------------------------------------------------------------------------
Disclosure: I am part of Trade Nation's Influencer program and receive a monthly fee for using their TradingView charts in my analysis.
