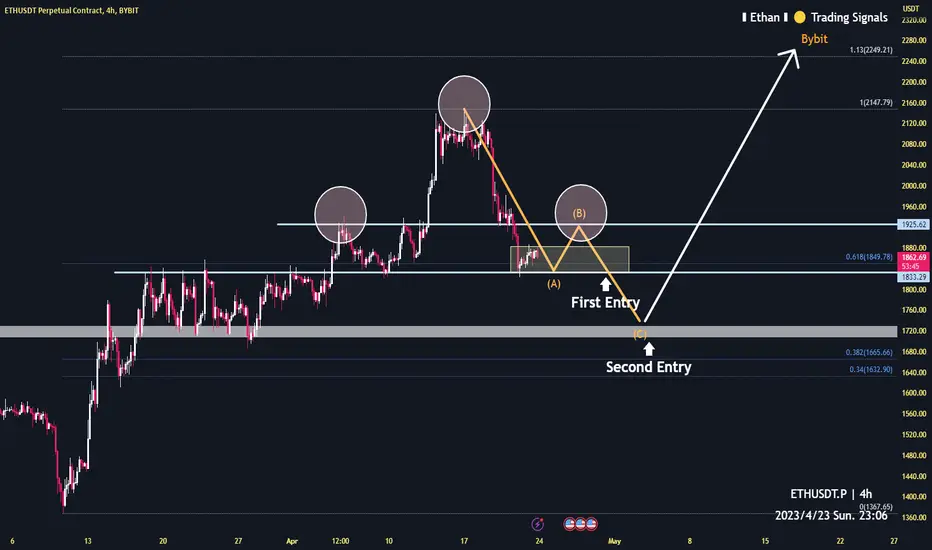
Ethereum potential reversed price is 22002h time frame
-
Refer to the previous structure from Mar 27 to April 17
We can easily predict the next trend of ETH
Still have the potential to create harmonic pattern in near future.
With this analysis, timing to open short will be around 2200
Get ready for it!
Ethereumforecast

Ethereum ETH Price Targets after the FOMC meeting this weekThe upcoming FED meeting on May 3rd could cause a further decline in the crypto market due to the potential rate hike and ongoing unease around banking system developments.
The outlook for the crypto market after the upcoming FED meeting on May 3rd is bleak.
Fears of a deep credit crunch caused by Silicon Valley Bank's collapse have not yet materialized, and the financial situation is much steadier.
Additionally, inflation remains elevated, and with evidence of stubbornness in underlying inflation, it could be in the 4% to 5% range, far above the 2% inflation target. The markets are pricing in a 25bp Fed Funds rate hike to 5.25% at the May FOMC meeting, and given the steadiness in financial markets, persistence in price pressures, and continued decent activity, this could contribute to a further downturn in the crypto market.
ETH/USDT short
Entry Range: 1800 - 1950 usd
Take Profit 1: 1710 usd
Take Profit 2: 1620 usd
Take Profit 3: 1480 usd
Stop Loss: 2150 usd

Ethereum ETH Price Targets after the FOMC meeting this weekThe upcoming FED meeting on May 3rd could cause a further decline in the crypto market due to the potential rate hike and ongoing unease around banking system developments.
The outlook for the crypto market after the upcoming FED meeting on May 3rd is bleak.
Fears of a deep credit crunch caused by Silicon Valley Bank's collapse have not yet materialized, and the financial situation is much steadier.
Additionally, inflation remains elevated, and with evidence of stubbornness in underlying inflation, it could be in the 4% to 5% range, far above the 2% inflation target. The markets are pricing in a 25bp Fed Funds rate hike to 5.25% at the May FOMC meeting, and given the steadiness in financial markets, persistence in price pressures, and continued decent activity, this could contribute to a further downturn in the crypto market.
ETH/USDT short
Entry Range: HKEX:1800 - 1950
Take Profit 1: HKEX:1710
Take Profit 2: TSE:1620
Take Profit 3: TSE:1480
Stop Loss: TADAWUL:2150

Ethereum Best Short timing2h time frame
-
Ethereum still creating a potential harmonic pattern as previous analysis
We might go to 2190 soon, and there will be a potential reversed price as marked.

Ethereum -> Wait For The BreakHello Traders,
welcome to this free and educational multi-timeframe technical analysis .
On the weekly timeframe you can see that Ethereum just recenly broke above a major previous weekly support/resistance area exactly at the HKEX:1900 level which is now turned strong support.
You can also see that weekly market structure and also weekly moving averages are bullish and therefore pointing towards more upside potential, so I am now just waiting for some bullish rejection at the zone before I then do expect a next weekl rally towards the upside.
On the daily timeframe however you can see that we have the potential to actually create a regular head a shoulders, generally speaking a bearish pattern, so I am now just waiting for some bullish market structure before I then also do expect a next bullish impulse on the daily timeframe.
Thank you for watching and I will see you tomorrow!
You can also check out my previous analysis of this asset:

ETHUSD - Layering ChannelsAn idea for ETH supporting some of my previous posts, with a reversal at around ~1800
I have drawn channels against all of the trend lines available
Linking related posts below

ETH - Key Levels To Watch 👀What's up traders! In today's market breakdown, we're mapping out our latest levels to watch for on the ETH hourly chart.
No need to beat around the bush, let's dive right in...
Ticker: ETHUSDT
Date: 04/26/23
T imeframe: 1H
Key Levels:
Supply: 1935-1965 (1st red zone), 1990-2005 (2nd red zone)
Demand: 1800-1825 (green zone)
Other key levels: 1875-1890 (1st grey zone)
Commentary:
First Republic drama had cryptocurrency bulls gain back control of the market yesterday. However, Ethereum has come back to retest demand at 1800 today.
Ethereum pretty much satisfied the Bearish Scenario 2 from our last analysis on 04/23/23, except it found demand at 1800 rather than ~1770 - a big psychological level.
Currently, we are trading just under ~1875-1890 key zone and supply from the earlier this week that is being respected well. Here are a few trades we could target from here:
✅ Bullish Scenario 1: you want to see price pull back into the demand zone ~1800-1825 and buyers to emerge again for an upside move, possibly into ~1935-1965 supply or higher. Be cautious of the key zone around ~1875-1890 in this scenario. This is the safer upside play.
✅ Bullish Scenario 2: you want to see price trade above this ~1875-1890 zone, retest this zone and turn it into demand to catch a break and retest for an upside move, potentially into supply at ~1935-1965.
✅ Bullish Scenario 3: you want to see price rally and break supply at ~1935-1965, pull back into it to turn it into demand and find strength again for a move into next supply at ~1990-2005.
------
🟥 Bearish Scenario 1: you want to see price approach supply at ~1935-1965, sellers to regain control and possibly catch a break and retest of this supply zone into the key zone ~1875-1890 or demand at ~1800-1825. This will be the safer downside play.
🟥 Bearish Scenario 2: you want to see price reject here at ~1875-1890 for a move into ~1800-1825 demand.
🟥 Bearish Scenario 3: you want to see price break demand at ~1800-1825, retest and turn this zone into supply for a further downside move into ~1770.
That's all we got for you in this one.
So what do you think? Are you bullish or bearish on ETH?
Let us know in the comments below!
We'll see you in the next one.
-The AlgoBuddy Team

Ethereum can aim 1950 at least2h time frame
-
Ethereum creating a potential inverse head and shoulders.
Best entry will show once break above 1883
Targets will be 1950 and 2145

Is Investing in Ethereum During the Dip a Wise Decision?Since the start of this year, the cryptocurrency market has experienced a remarkable resurgence, surpassing the $1.25 trillion mark after starting at approximately HKEX:800 billion. This market rebound follows a period where investors gravitated towards safer assets, leading to a significant decline in the cryptocurrency market. However, the tables have turned, and many cryptocurrencies still hold appealing long-term prospects, despite their recent recovery. Take Ethereum, for example. Its value has declined in recent days, making it reasonably priced. So, the question is, should you invest now? Let's delve into it.
To provide some context, Ethereum is presently the world's second-largest cryptocurrency, with its native token and blockchain that hosts thousands of decentralized applications (dApps). Ethereum dominates the worlds of dApps and non-fungible tokens (NFTs), which is significant because it suggests that Ethereum could play a pivotal role in transforming businesses and even entertainment in the future. Another vital point is that Ethereum attracts more developers to build on its blockchain than any other platform, with over 5,800 monthly active developers using the platform as of April 1, compared to its closest competitor Polkadot's approximately 1,900. This implies that Ethereum could potentially become a world leader in the cryptocurrency industry.
Although Ethereum has some flaws, such as its intensive energy usage, slow transaction speed, and high costs, the platform is actively addressing these issues through updates. For instance, the proof-of-stake method of verifying transactions has reduced Ethereum's energy usage by 99%, eliminating the need for excessive computer power to validate blocks of data.
Presently, Ethereum is taking steps to enhance its speed and lower costs. It has implemented rollups that bundle transactions together off the mainnet and execute them, resulting in 3 to 8 times lower costs than transactions made directly on Ethereum. However, Ethereum is still working to improve rollup efficiency and aims to achieve transaction costs of under $0.001. Furthermore, Ethereum intends to launch an upgrade later this year that should reduce data storage costs, which account for around 90% of overall transaction costs. Ethereum's shift to proof of stake also has the potential to attract a new category of investors seeking passive income from their investments.
The question now is whether investing in Ethereum during its dip is a good idea. The answer depends on your comfort level with risk. If you are an extremely cautious investor, cryptocurrency may not be the best fit for you. The cryptocurrency industry is relatively new, and it is challenging to predict its future five or ten years from now with certainty.
However, if you are willing to take on some risk, investing in Ethereum could be a wise decision. It has demonstrated its capabilities and attracted users, indicating that it has a strong chance of leading the pack if cryptocurrency takes off. Moreover, Ethereum is currently addressing its most significant problems, which should make it an even better player in the future.
As for the price, Ethereum has dropped significantly from its 2021 peak, with its current price being less than HKEX:2 ,000 compared to over HKEX:4 ,500 at its peak. Nevertheless, momentum has returned, with Ethereum increasing by 55% since the start of the year. Although Ethereum has recently experienced a 10% decline, it remains a solid long-term investment considering the factors mentioned above. Therefore, buying during the dip is a sound idea.

Eth 1850 Hold or Back to Prev Daily Lows 1824 ⚔️Never Sell into Support! We can observe due to candle closures that we may return to previous day's lows at 1842 and ultimately 1824. The 8Hr and the 4Hr timeframes have just closed bearish after some rather large engulfing candles have printed on the Daily TF's and the weekly candle is closing in 7 hours. We may drop further on the Daily to somewhere around 1809 but we must see volume and maybe a break and retest below 1850 on the 30m TF if we can get that far. Selling into to support can be hazardous. Price may respect 1850 and continue to range. Always maintain a good risk/reward. At least 3:1 R walking into the trade. Also the RR changes throughout a trade.

What price could Ethereum reach in this miniuptrend?Hey guys, I suppose that now is time to stop making new buy orders and focus on taking profits from your current positions. Similar to BTC's Elliott waves, ETH is running in wave 5 of this miniuptrend.
So easy to see ETH's 5th wave is a kind of wave extension. To this kind, the length of wave 5 is expected to be 1.618 times the length from the start of wave 1 to the end of wave 3. Based on this, we can expect the price of ETh in the mini-uptrend is around 2400 USD.
Besides, there are two things which support this view:
1. 2400USD is the price just below the major resistance area that runs from Jan 2022 to May 2022.
2. ETH's previous mini-uptrend lasted about 194 days from December 14, 2018 to January 26, 2019 and the current mini-uptrend has been lasting 147 days so far.
Don't forget to like, share and follow me. Many attractive things ahead!

Ethereum - Are the bears fighting back?What's up, traders! In today's breakdown, we're taking a look at some possible scenarios for Ethereum in the coming days/weeks.
Let's dive right in...
Ticker: ETHUSDT
Date: 04/23/23
Timeframe: 1H
Supply: 1920-1950 (1st red zone), 2040-2065 (2nd red zone)
Demand: 1820-1850 (1st green zone), 1685-1720 (2nd green zone)
Other key levels: 1880-1890 (grey zone)
Commentary:
Ethereum has satisfied the Bearish Scenario 1 from our analysis on 04/19/23. We noted how volume was accumulating on the downside and mentioned that a break and retest for further downside would be a great short play which did end up playing out.
We have now held demand at ~1820-1850 and continue to respect the key zone ~1880-1890 as supply at the moment. This is a channel that was respected a couple weeks ago for a few days after which we rallied into the highs of ~2150. There are a few trades we could target from here:
✅ Bullish Scenario 1: you want to see price hold this ~1820-1850 demand, find strength to move upwards and possibly give us a retest of this demand zone for a possible move back into supply around ~1920-1950. This is potentially a scalp setup.
✅ Bullish Scenario 2: you want to see price hold this ~1820-1850 demand, find strength to break the key level of ~1880-1890 and possibly give us a retest of this key zone for a possible move back into supply around ~1920-1950. This will also be a potential scalp setup.
✅ Bullish Scenario 3: you want to see price rally and break supply at ~1920-1950, pull back into it and hold to turn it into demand and possibly rallying back into ~2040-2065, our next supply zone. Day or swing trade setup.
🟥 Bearish Scenario 1: you want to see price approach supply at ~1920-1950, sellers starting to accumulate and possibly catch a break and retest of this supply zone into demand at ~1820-1850 again. This will be the safer downside play - potentially a scalp.
🟥 Bearish Scenario 2: you want to see price break this ~1820-1850 demand, pull back into it and resist to turn it into supply, and find weakness again to possibly move into late March lows around ~1770 or ~1720. Day or swing trade setup.

Ethereum will pump over 2100 in near future!4h time frame
-
Ethereum initially stop falling here and start consolidating.
We need another rejection from 1930 to clear leveraged positions.
At that time, a potential inverse head and shoulders will create, which target is around 1730.
Further, a huge pump may move on 5/B.
So, there are two entries to long, 1830 and 1730.
Get ready for it!
Ethereum -> Just A Classic ShakeoutHello Traders,
welcome to this free and educational multi-timeframe technical analysis .
On the weekly timeframe you can see that Ethereum already broke above a major previous weekly support/resistance area at the HKEX:1900 level.
You can also see that as we are speaking, Ethereum is retesting this previous resistance which is now turned support, market structure is still bullish and we already created the bottom of the bear market in my opinion, so I simply do expect more continuation towards the upside from the current levels.
On the daily timeframe you can see that Ethereum is also retesting previous daily support/resistance which could act as support so I am just waiting for some more bullish rejection inside of this area and then I do expect a next rally towards the upside.
Thank you for watching and I will see you tomorrow!
You can also check out my previous analysis of this asset:

ETHUSD - Why I Think The Bull Market Is Still On (Higher High)Higher highs are indicative of a market that wants more, higher prices
The bear market we have experienced is not comparable to that of the one seen following 2017, both in length and severity.
We also haven't experienced the peak bull market, which is now taking its turn to come through.

ETHUSD - Inverted H&S An inverted H&S structure with the suggestion that the right shoulder is yet to form
I would expect a recovery for the shoulder somewhere in the lower half of this channel
(1) is the shoulders
(3) is the head
(2) are also a key part of the pattern, id call them the arms

ETHUSD - Key Areas To Watch Key areas to watch are labelled with the price point tool
If we break down this middle line and support is not found there is still one lower band for support to be found
The curve channel is overall bullish until the larger curve structure is broken
Lets see what happens

random eth setup planMy fibb "sharkfin" pattern.
1600$ ETH looks possible for sure, expecting bounce there.

ETH/USDT Buy Area ethereum broke a strong resistance area and rally to upside in last week
now market is going to test the strong demand zone
we are aiming for a buy on that demand zone
as we mentioned as area of interest
only buy ethereum and apply your own DCA or money management
always remember discipline is the key to success in financial world
and always be bullish on crypto
HamaitiFx

Ethereum Long Term AnalysisSince we are coming to the end of February in 4 days, I felt the need to do this analysis. I think the critical level for Ethereum in the monthly timeframe is $1828. This is because the moving average is at that level. I think that Ethereum, which has always followed this moving average in history, will follow this moving average again this time. The monthly close of Ethereum above this level may also mean the beginning of the bull market. For this reason, it seems that for those who have not bought Ethereum yet or for investors who want to lower their risks as much as they can, following this level and buying when a monthly closing is made will minimize the risks.
A second scenario will occur if Ethereum is rejected at this level. If Ethereum is rejected from this level, the support levels of the Fibonacci retracement will be seen. The target for the bear scenario will be $771 if there is no return from $1177 first and then $771.
I don't think there will be more of a bear scenario for cryptos in this situation. I would also like to say that when the moving average is broken, I will personally add to the Ethereums in my pocket.

ETHUSD - Curve ETH has started to take off above the parabola that can be plotted.
Previous points along this line are in green and show the bullish potential right above the trend line.
The trend lines strength is shown with the dump during COVID (early 2020), rejected right on the line.

My 2300 Ethereum idea remains unchangedA few days ago I've written that EthUsd is ready to break above 1930 resistance and fly above 2k zone.
Indeed, Ethereum has broken above both resistances and now is trading comfortably at 2100.
On Friday we have a very short-lived sell-off, but bulls quickly took control, reinforcing my bullish outlook.
I expect a break above the recent consolidation and, as the title says, 2300 is my target.

📈ETH analysis above 1900 level📉BINANCE:ETHUSDT
COINBASE:ETHUSD
Hey everyone, first take a look at my previous analysis and positions.
As previously analyzed, Ethereum continued its upward trend and reached above the HKEX:1903 level.
In order to continue the upward trend, Ethereum needs to stay above 1850.
Don't forget to risk-free your position.
Consider the impact of the Shanghai update.
Please share ideas and leave a comment,
let me know what's your idea.
CrazyS✌
