Ethereum Idea | ETHUSDEthereum Idea |ETHUSDT Analysis | ETHUSD
Three Targets : 1st $ 1700.00 and 2nd $ 1750.00 and the last one $ 1800.00
✅ ✅ Risk warning, disclaimer: the above is a personal market judgment and analysis based on published information and historical chart data on The trading view,
And only some of these analyzes are my actual real trades.
I hope Traders consider I am Not responsible for your trades and investment decision.
Ethereumforecast

ETH USDT BINANCEHeading toward large resistance in uptrend (white line).
Sell orders around 2k and could bleed down imo.
RSI near support.
But will need a push because 50 MA crossed below 100 MA.
Might bounce before continuing the uptrend tho.
This isn't financial advice and you should always DYOR.
Thanks for following.
Like, comment, share any ideas you have as well.

Ethereum -> The Beginning Of The Next BullrunHello Traders,
welcome to this free and educational multi-timeframe technical analysis.
From a weekly perspective Ethereum and the whole crypto market is looking like it is potentially slowly starting the beginning of the next crypto-cycle.
On Ethereum specifically it seems like the market just wants to head higher and create a very bullish long term double bottom, before then eventually starting a short term correction to the downside.
On the daily timeframe I am now just waiting for an opportunity to enter a long postition, however the market is currently testing previous resistance which is turned resistance once again, so I am just waiting for a break above the zone, followed by a retest and then there is a high probability that we will actually see the continuation towards the upside.
Thank you for watching and I will see you tomorrow!
You can also check out my previous analysis of this asset:

Ethereum's game changer moment 1.1.2023March 2020 to Jan 2023 support trend-line confirmed recently with another bounce of higher lows.
Highlighted on chart previous times we've had the support tested since March 2020, rally which followed was aggressive and substantial.
1) August 2020 to April 2021 - $4,054 gain per coin, 1012% increase.
2) June to August 2022 - $1,100 gain per coin, 120% increase.
3) October to November 2022 - $588 gain per coin, 53% increase.
Most recently support was tested December 20th and since gained about $50 per coin from the low, confirming the big picture support to be relevant.
Connecting highs since the ATH November 2021 at $4,800 per coin show resistance to be around $1,426.
Connecting lows since the low of $93 per coin back March 2020 show support to be around $1,050.
The pattern which is formed is a big triangle consolidation of 3 years - Price currently trades very close to the apex and there could be a breakout above or below mentioned levels within the next quarter.
In my opinion, there's higher potential is for a break up considering higher lows were kept for the entire 3 year period, even through the panic selling caused by FTX and other industry shacking events.
-------------------------------------------------------------------------------------------------------------------
I encourage you to do your own research, make your own judgement and take cautious decisions keeping in mind trading is speculative and can be unpredictable.
-------------------------------------------------------------------------------------------------------------------

Trend Ethereum Is Getting Weaker Ethereum's uptrend is weakening. This is not unexpected given that we are already at a key point in the cycles of both Ethereum and Bitcoin. The previous two tops were discovered after 58 and 43 days, respectively, while Ethereum's local top was discovered after 61 days.
Not only do we notice a daily cycle pattern, but Ethereum has also found resistance at the first critical point of 1700 USD. As the trend weakens, we're seeing a lower high.
Why is the trend weakening? This is represented not just in the rsi, but also in our indicator Fetch Trends, which utilizes the rsi to calculate its colors.
On top of that, our other indicator "moving average sequential strat" is firing off a sell signal, giving me us plenty of reasons to think the local top for Ethereum is either close or in.


ethusdt - a triangle before the last wave of growth.- The wave triangle is drawn before the final rise.
- We're down to 1680.
And more info on the video
If you like the idea, please "Like" it. This is the best "Thanks!" for the author 😊 P.S. Always do your own analysis before a trade. Put a stop loss. Fix profits in installments. Withdraw profits in fiat and please yourself and your friends.

Ethereum ETH is crashing right now!Hello, my dear friends!
Today I am crazy man because there is a third analysis today. I know that a lot of traders suppose that Ethereum is the strong asset, but I want to tell you that current crash is still not over and we can see today the massive triggering of the short signals. First of all I want to warn you that I am not going to open short on ETH using the setup above because I have the short trade on Bitcoin.
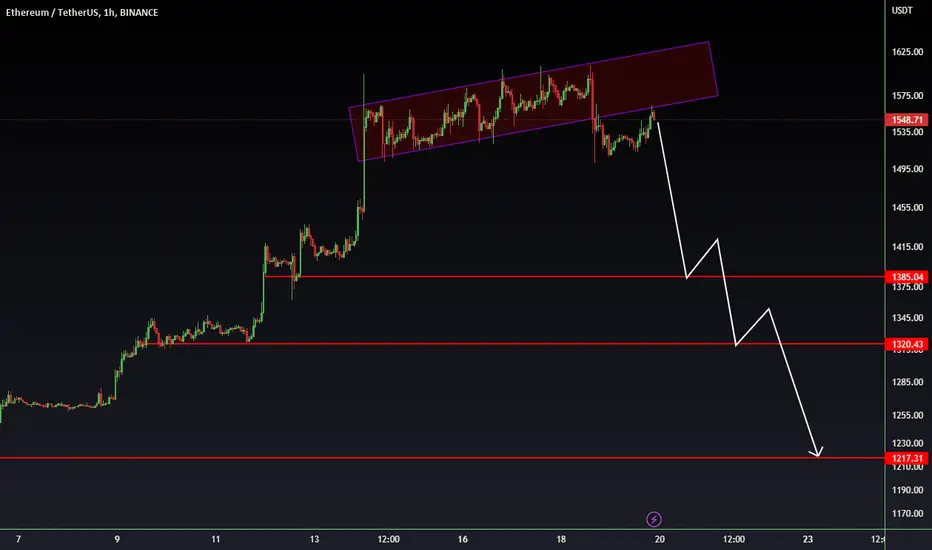
4h time frame of the BINANCE:ETHUSDT chart is showing us that the key down fractal has been broken below the Williams Alligator indicator’s red line. The price was $1554 . If you have already executed the short trade your stop loss should be placed at $1663 .
I consider the potential target inside the Fibonacci golden pocket zone at $1380 . When the price will reach this price I am going to watch out the market carefully to execute the long trade on the potential reversal setup.
Best regards, Ivan
________________________________________________________________________________________________
If you like my trade ideas, please smash the boost button to stimulate me make more quality analytics!

Ethereum Mercury Line ResistanceAs we can see Ethereum is facing major resistance upon the Mercury planetary speed line, and therefor having made lower highest and reversing, there is a high change that the reversal area is upon us.
If for some reason Ethereum manages to break through the Mercury resistance lines, then it will make its way to the higher planetary line eventually. As for now, the odds are for a reversal happening soon unless we see some crazy reversal price action.
We also observe the point in the rectangle upon which it touched resistance, as it happening late into the rectangle, that shows us the speed or velocity of price is weak, giving us a greater idea of what is likely to happen.
"Planetary Lines" Indicator by @NasserHumood

Ethereum Analysis 27.01.2023Hello Traders,
welcome to this free and educational analysis.
I am going to explain where I think this asset is going to go over the next few days and weeks and where I would look for trading opportunities.
If you have any questions or suggestions which asset I should analyse tomorrow, please leave a comment below.
I will personally reply to every single comment!
If you enjoyed this analysis, I would definitely appreciate it, if you smash that like button and maybe consider following my channel.
Thank you for watching and I will see you tomorrow!
You can also check out my previous analysis of this asset:

ETH USDT BINANCEETH ranging from 2000-800.
Sell around 2000 level.
ETH following Bitcoin rally.
Plus FOMO and retail we could have a relief rally then correct heavy for one last true bottom near 800.
These are just my opinions and isn't financial advice.
DYOR
Thanks Like Comment Follow for more ideas.

ETH/USDT BinanceETH/USDT Binance
1D hollow candlesticks
As the bear market is over, we can say a few things for the price movement of altcoins.
A descending triangle has been formed, as the price already breakout this triangle.
Also, a parallel uptrend channel has been formed since the beginning of June 2022.
A first resistance area occurred from the extension of the first Fibonacci retracement.
A second main resistance area is a result of the extension of a second Fibonacci retracement.
A forecast indicator shows a possible price movement for the next months.
Ethereum Price (ETH) = $1,600.92 +2.85%
= 0.06945 BTC +1.25%
Market Cap: $1,048,131,057,077
24h Vol: $65,909,497,233
Dominance: BTC: 42.4%
ETH: 18.7%
Good Luck
#CryptoHellas Team

Ethereum Confirming or New Bottom?Ethereum is possible in the process of retesting or making a new bottom because there is still a little room to go down in the fib area. At any rate this will likely be confirmation to all in the community that a new Bull Run has begun and we are off to the races...............

Ethereum to extend it's loses?Ethereum - 24h expiry - We look to Sell a break of 1508 (stop at 1551)
Short term momentum is bearish.
Short term bias has turned negative.
A break of the recent low at 1519 should result in a further move lower.
There is no clear indication that the downward move is coming to an end.
Our profit targets will be 1401 and 1381
Resistance: 1560 / 1585 / 1600
Support: 1520 / 1500 / 1450
Please be advised that the information presented on TradingView is provided to Vantage (‘Vantage Global Limited’, ‘we’) by a third-party provider (‘Signal Centre’). Please be reminded that you are solely responsible for the trading decisions on your account. There is a very high degree of risk involved in trading. Any information and/or content is intended entirely for research, educational and informational purposes only and does not constitute investment or consultation advice or investment strategy. The information is not tailored to the investment needs of any specific person and therefore does not involve a consideration of any of the investment objectives, financial situation or needs of any viewer that may receive it. Kindly also note that past performance is not a reliable indicator of future results. Actual results may differ materially from those anticipated in forward-looking or past performance statements. We assume no liability as to the accuracy or completeness of any of the information and/or content provided herein and the Company cannot be held responsible for any omission, mistake nor for any loss or damage including without limitation to any loss of profit which may arise from reliance on any information supplied by Signal Centre.

ETH ETHEREUM 4 HOUR CHART Price Analysis Hello! Here's my eye on Ethereum on the 4-hour chart.
ETH MUST hold the support zone #1 if It wants to go up
IF ETH loses Support ZONE #1 and the current trendline, It will most likely go DOWN and test SUPPORT ZONE #2 1374-1437.
IF ETH can hold this SUPPORT ZONE It will go back up and test the top end of RESISTANCE ZONE#1 1607.
From here the next Resistance zone target would be around the 1669 LVL Then 1713 LVL from here.
I'm Neither Bullish nor Bearish on this COIN. Just showing some possibilities on the outcome of ETH in my opinion in the next coming days!
Please Comment or Like if you enjoyed this guys :)
Have an amazing day!

ETH - Tighten your belts! Reversal incoming!Hello dear Investors, Traders and of course Beez!
Quick TA update on ETHUSDT coming up right away. Make sure to take notes and comment below if you are having any question! So stay tuned!
First things first, as we can clearly observe, today price rejected at the Ultimate Resistance - 4hr Bearish Orderblock area around 1670$ and as we forecasted on previous post on ETH, that could possibly be the peak of the relief rally, indicating us, reversal.
Technicals that are being utilized in this chart analysis for us, to determine the next moves of ETH are the following:
Volume
RSI
MACD
So without more noise, lets cut to the chase:
When it comes to Volume in correlation to price activity, we observe that, price is keep rising while volume steadily decreases, indicating us Bearish Divergence.
Moreover, MACD waves seems weaker, compare that, to strongest price buying power
Last but not least, RSI is in the overbought area and has formed Bearish Divergence, as it recedes while price keep rising!
Consequently, we can clearly see that this relief rally is more likely a liquidity grab in order to create a lower low, rather than a healthy recovery! After all, what burst up, without consolidation, it has to go down eventually!
IMPORTANT: This is strictly a Technical Analysis and Fundamentals CAN affect our Analysis!
DISCLAIMER: This analysis is not intended to encourage any buying or selling activity of any particular securities. In addition, it should not be considered as ground for taking any trade action. Hence, your own diligence is highly recommended before entering any trade.
If you liked the idea, make sure to support with a like, follow and a comment!
Best Regards, CryptoQueens.

ETH - Price Target $1279ETH is showing signs of not being able to find support above the $1552.36 Price Level and we're expecting an additional consolidation back to the $1279.65 for another potential opportunity to load up for Crypto Bulls and Enthusiast.

ETHEREUM UPDATES
Congrats who trade this. pretty Good look here!
Thanks to all
Base on your own decissions.
Follow for more, I posted daily analysis.

ETHUSD💥1H-TIMEFRAME ANALYSISETHUSD💥1H-TIMEFRAME ANALYSIS
💗Hello ladies and gentlemen
This is my new idea for 💥ETHUSD
I hope my idea is clear
Support me by like and share thank you
Stay Safe💯💲💲💲
Good luck💰😍
ETH Technical analysis & Next moves 1st Quarter!Greetings and Happy new Year fellow Investors Traders and ofcourse beez!
In our today's post we will analyze ETH next moves in the upcoming months (Q1), taking into account all technical factors that may affect the price behavior and consequently price volatility . As we can observe on the chart, there are 3 possible scenarios that might play out based on our analysis. Since Mid-July, there is a HUGE Bullish Orderblock, around the area 1090$ - 1035$. As long as we stay above these levels, everything looks positive and we are safe and sound.
IMPORTANT: Keep in mind though, Orderblocks tend to act as a magnet, therefore, sooner or later we WILL visit this area.
In the case of breaching 1090$ support area, that holded well so far, we will test the lower threshold level of OB at 1030$, which is the least possible scenario (2) based on our plan.
At the time of the writing, after price tested the upper OB, that was created on 20th of December, it acted as a resistance, and bulls took over. It is also important to mention that, price and volume has been forming a bullish divergence, indicating us a buy signal and that Scenario 1 and 3 are more likely to occur. At this point it is important to mention, that based on the price behavior the last months, there has been a huge liquidity area (FVG), that hasn't been explored since then, and MUST be, the one way or the another.
Consequently, after today's leg up and after being rejected of the nearest support zone, we strongly believe, that the next moves involve, bullish action.
SCENARIO 1: Indicates, retest of the lower level of the Fair Value Gap, having our TPs at the level of 1340$, that acted as resistance. and then sharply correct to the lowest Resistance area, at 1080$-1100$.
SCENARIO 3(HOT): After retesting the lower level of the local FVG, break through, and close the Gap, leading us to the ultimate Resistance area indicating on the chart, at the area of 1660$. Make no mistake though, market sentiment is still bearish, and according to this plan, price eventually, WILL test the lower levels around 1080$.
Consequently, after analyzing all 3 possible scenarios, and taking under consideration that the correlation between price and volume, we undoubtedly suggest that a good Long entry price is:
Entry Price: 1230 - 1250
TP1: 1340$ (Liquidity Pool)
TP2: 1425$ (Mid-range of FVG)
TP3: 1660$ (Ultimate Resistance Area - Reversal point)
SL: 1180$
IMPORTANT: This is strictly a Technical Analysis and Fundamentals CAN affect our Analysis!
Not a Financial Advise!
Trade with Caution!
Best Regards, CryptoQueens

ETHEREUM UPDATES
Looks good on previous wave analysis, but price still ranging/flat. I see volume need to reach the previous break.
Im expecting the price to fall
Please Trade base on your own decissions.
CHeck me out I posted daily analysis.

Ethereum ETH: 1D Chart UpdateToday you can review the technical analysis idea on a 1D linear scale chart for Ethereum (ETHUSD).
Ethereum price has been pumping recently and there is potential for it to keep moving higher, but ETH price and the RSI just made a lower low. If price keeps heading lower, it may come back down to where the recent pump started which is about a 30-35% correction, similar to my recent BTC price chart. The area of support is in the $1K region. RSI may be cooling down as well. Volume doesn't look strong.
If you enjoy my ideas, feel free to like it and drop in a comment. I love reading your comments below.
Disclosure: This is just my opinion and not any type of financial advice. I enjoy charting and discussing technical analysis . Don't trade based on my advice. Do your own research! #millionaireeconomics

Ethereum (ETH) formed a bullish Gartley | A good buy opportunityHi dear friends , hope you are well and welcome to the new trade setup of Ethereum coin.
Previously after crossing the 1st target the price moved down:
Now on a daily time frame, Ethereum with BTC pair has formed a bullish Gartley move for another pump.
Note: Above idea is for educational purpose only. It is advised to diversify and strictly follow the stop loss, and don't get stuck with trade
