Ethereum forecast Update 🧐🌸 Risk warning, disclaimer: the above is a personal market judgment based on published information and historical chart data on trading-view, And only a few of these analyzes are my actual trades. I hope Traders consider I am not responsible for your trades and investment decision.
------------------------------
🌸 Please write any advice or suggestions.
Dear friends, request any cryptocurrency pair, currencies pair for forex, and any index that you want to be analyzed and ask any questions.
Thanks for your attention
Ethereumforecast

ETHUSDT 4h ETH Merge countdown, where price will go ?Taking into account the information hype surrounding the Ethereum Merges transition from PoW to PoS in 16 hours it is difficult to predict where the ETHUSDT price will start to move after the transition.
It is predicted that the annual emission of ETH will amount to only 0.3%, and a significant decrease in the market supply affects the growth of the price according to the laws of economics.
On the other hand, we have the original, historically 1st created Ethereum Classic, to which miners are increasingly switching. Investors' attention may switch from ETH to ETC, because the hashrate has grown by more than 500% since the beginning of the year, and the ETCUSDT price has increased 3 times in just 3 months, and this is in the current sluggish market.
For us, two options are likely, which we have shown on the chart, we can only wait and watch.
And to make this time pass more productively, we are announcing a contest:
In the comments under the idea, share your graphs with an analysis of where the ETHUSDT price will go in the near future.
The contest will end in an hour before The Merge (we marked it on the chart)
In addition to gratitude and likes from Tradingview users, you will from us:
1st place - 300 coins
2nd place - 200 coins
3rd place - 100 coins
_______________________________
Since 2016 , we have been analyzing and trading the cryptocurrency market.
We transform our knowledge, trading moods and experience into ideas. Each "like under the idea" boosts the level of our happiness by 0.05%. If we help you to be calmer and richer — help us to be happier :)

Ethereum Forecast & analysisPlease write any advice or suggestions.
Dear friends, request any cryptocurrency pair, currencies pair for forex, and any index that you want to be analyzed and ask any questions.
Thanks for your attention

ETH getting readyHello everyone, I mainly updated you on BTC lately.
So here is a quick update on ETH the prince.
With the merge coming eth has now painted a very well-known pattern. We can see we have now almost fully formed a Cup and Handle pattern. Although this pattern is more often than not a continuation pattern it can also be found at the tops and bottoms. We can see the volume has dried throughout the formation and we now have formed the handle. 52 ma is confirming the pattern sustaining this last push with price breaking above.
The target would be 4k+.
I will wait for the breakout before entering and will use strict stop losses rules.
We are close to a possible bottom for Crypto...get ready either way.
FOLLOW ME, SHARE. LIKE AND COMMENT.

ETH Daily TA Cautiously BullishETHUSD Daily cautiously bullish. Recommended ratio: 70% ETH, 30% Cash.
* CPI WATCH . The Merge is currently scheduled to launch on Ethereum's Mainnet on 09/14/22 at ~9:40pm . Cryptos, Equities, Futures, VIX, Commodities, US Treasuries and the Euro are all slightly up while DXY is down today. All eyes are on the BLS August CPI report due tomorrow at 830am; July CPI came in lower than expectations and markets rallied, it's reasonable to infer that the same may happen if CPI comes in on par or lower than the 8.1% consensus. The 11th GDPNow Q3 US GDP estimate was 1.3% on 09/09/22 compared to 1.4% on 09/07/22, the next estimate is on 09/15/22. Microstrategy recently (09/09) filed a report disclosing a plan to sell $500m in Class A shares to reinvest it into the purchase of more Bitcoin. Key Upcoming Dates: August CPI at 830am EST 09/13 ; The Merge (Ethereum) at ~10pm EST 09/14; US August Retail Sales at 830am EST 09/15; 12th GDPNow US Q3 US GDP estimate 09/15; UofM Consumer Sentiment Index at 10am EST 09/16; FOMC meeting 09/20-09/21 (Statement Released at 2pm EST on 09/21).*
Price is currently testing $1711 minor support for the third consecutive session. Volume is currently Moderate (high) but has decreased in the past few sessions and is on track to favor sellers for a second consecutive session if it closes today in the red. Parabolic SAR flips bearish at $1528, this margin is neutral at the moment. RSI is currently trending down at 56 as it approaches a test of 55.31 support. Stochastic crossed over bearish in today's session and is currently trending down at 90 as it approaches a test of 81 support. MACD remains bullish and is currently forming a soft peak as it trends up slightly at 22 and approaches a test of 27.77 resistance. ADX is currently trending up slightly at 16 as Price continues to push higher, this is mildly bullish.
If Price is able to bounce off of $1711 minor support then the next likely target is a retest of $1941 resistance . However, if Price breaks down below $1711 minor support, it will likely retest the 50 MA at ~$1675 as support before potentially retesting the uptrend line from 06/18/22 at ~$1650 as support . Mental Stop Loss: (two consecutive closes below) $1625.

ETH - Long here and Short thereBYBIT:ETHUSDT
4H time frame
-
ETH formed an inverse HS after breaking out 1686, it is on the path of retest, so we can long it if retest the downtrend line and support confirm(~1655).
Also, we use XABCD to judge the trend since previous high point 2029.4, then predict the potential reverse area around 1950~1990.
So just be careful or try to open short if ETH can keep climbing until 1950 after the retest works.

Ethereum have to fall more than BitcoinHello, everyone!
Bitcoin is staying at the same level because now it’s weekend, it’s no reason to make the update on it. The short is still actual. Today let’s take a look at Ethereum, I know you want to know my opinion about it. Let’s go.
Of course ETH is fully depends on BTC movements. If we assume short for Bitcoin, Ethereum will also probably fall. ETH has it’s own wave structure. When I told you about insane short on BTC at $24500 ETH have also started it’s dump. We can clearly see the 12345 Elliott waves cycle which as usually confirmed with the divergence with Awesome oscillator. It is the wave 1 of the higher order. Now the price as I suppose have completed ABC correction – wave 2 of the higher order. It reached Fibonacci golden pocket and now it’s time to start bearish wave 3. Also I want you to notice the decreasing volume during the wave c. It means that the current pump does not have enough strength to maintain the uptrend.
You also can check the last idea on Bitcoin to be sure that ETH analysis takes into account the potential BTC move.

Ethereum forecast and signalPlease write any advice or suggestions.
Dear friends, request any cryptocurrency pair, currencies pair for forex, and any index that you want to be analyzed and ask any questions.
Thanks for your attention
Ethereum vs Tether ETHUSD/ ETHUSDT
#ETH next target and support#ETH Long term 2,000 is a strong resistance and 1400 is a good support. There is more support in the short term but not much resistance. If the market is bullish, it can hit 2800.
1D candlestick chart. So nothing will hit fast. It will take time.

ETH Daily TA Cautiously BullishETH Daily cautiously bullish. Recommended ratio: 65% ETH, 35% Cash.
* The Merge is set to launch on Ethereum's Mainnet at around 6pm on 09/14/22 . With the ECB raising central bank rates by 75bps and committing to more rate hikes in the near term, FFR futures traders are still betting on a 75bps rate hike by the Fed on 09/21. St. Louis Fed President James Bullard said today that he's leaning more strongly into a 75bps rate hike at the next FOMC meeting and that money markets are underestimating prolonged higher rates in 2023. Fed Governor Christopher Waller mentioned today that fears of a recession in Q1 and Q2 have faded and that the economy can support more significant rate hikes . Key Upcoming Dates: August CPI at 830am EST 09/13; The Merge (Ethereum) at ~6pm EST 09/14; FOMC meeting 09/20-09/21 (Statement Released at 2pm EST on 09/21).*
Price is currently trending up at $1737 and is still technically testing $1711 minor resistance. Volume is on track to both be High and favor buyers for a fourth consecutive session if it can close today's session a bit higher and in the green. Parabolic SAR flips bearish at $1476, this margin is mildly bearish at the moment. RSI is currently trending up slightly at 58 and is still technically testing the descending trendline from February 2020 and 55.31 resistance. Stochastic remains bullish and is currently testing max top. MACD remains bullish and is currently trending up at 6 as it approaches 27.77 resistance. ADX is currently trending sideways at 14 as Price is pushing higher, this is neutral at the moment.
If Price is able to turn $1711 minor resistance to support, the next likely target is a retest of $1941 resistance . However, if Price breaks back down below $1711 minor resistance, it will likely retest the 50 MA at ~$1667 as support . Mental Stop Loss: (one close below) $1660.

Ethereum analysis and ideaPlease write any advice or suggestions.
Dear friends, request any cryptocurrency pair, currencies pair for forex, and any index that you want to be analyzed and ask any questions.
Thanks for your attention
Ethereum - Pump and dump on a horizonSeptember 2022 brings many exciting events for the stock and cryptocurrency markets alike. However, we will pay close attention mainly to two events in particular. The first event we will pay attention to is the “merge” with the soft deadline on the 19th of September 2022; the merge will see the current execution layer being combined with a new consensus layer. As a result, Ethereum will transit from proof-of-work to proof-of-stake. That, in turn, will eliminate the need for energy-intensive mining and give Ethereum a competitive edge against other cryptocurrencies.
While the transition is significant from an environmental and technological point of view, it is less significant from a trading perspective. It does not change the fact that the FED will continue to increase interest rates to battle inflation (which will subsequently weigh on the economy and lead to risk aversion). Additionally, the distribution of ETHW tokens (Ethereum on the old proof-of-work protocol) raises our concerns. Because of these “out of the thin air” tokens, we think there might be an initial increase in the price of Ethereum (especially before the merge). However, we expect a potential bounce to be temporary and newly created tokens to be dumped on the market together with Ethereum (after the merge).
Our bearish view is also supported by technical factors, which show very low liquidity in the market. Simultaneously, several technical indicators point to the downside for ETHUSD. Because of that, we stick to our price target at 1 000 USD and 900 USD
Illustration 1.01
Illustration 1.01 shows the daily chart of ETHUSD. The green arrow indicates a price increase. The red arrow indicates a volume decrease. These developments, occurring simultaneously, often foreshadow a trend reversal (in this case, a trend of a lesser degree).
Technical analysis - daily time frame
RSI and Stochastic are bullish. MACD is neutral; however, if it breaks above 0 points, it will bolster the bullish case in the short term. DM+ and DM- perform whipsaws, while ADX contains a relatively low value. Overall, the daily time frame is mixed.
Illustration 1.02
The image above displays the daily chart of ETHUSD and simple support/resistance levels. Ideally, we would like to see a breakout below the short-term support; that will bolster the bearish case for Ethereum.
Technical analysis - weekly time frame
RSI and Stochastic are slightly bullish. MACD is neutral. DM+ and DM- stay bearish. Overall, the weekly time frame is less bearish than a week ago.
Illustration 1.03
Illustration 1.03 shows the weekly chart of ETHUSD and two moving averages. The yellow arrow indicates the natural retracement toward the 20-week SMA. Ideally, we would like to see the price stay below this average.
Please feel free to express your ideas and thoughts in the comment section.
DISCLAIMER: This analysis is not intended to encourage any buying or selling of any particular securities. Furthermore, it should not be a basis for taking any trade action by an individual investor. Therefore, your own due diligence is highly advised before entering a trade.

#ethereumclassic #etc #ETC #EthereumClassic is still on the retest zone. 51.9 #USDT is very strong resistance if #ETCUSDT decides to go upside (by minor impulse). 78 usd level must be the top, if #btc allows to pump so hard. Losing 31 #usd is very critical for $etc Not financial advice. I'm neutral for ETC because of market conditions.

ETH Daily TA Neutral BullishETHUSD Daily neutral with a bullish bias. Recommended ratio: 55% ETH, 45% Cash.
* The Merge is scheduled for launch on Ethereum's Mainnet at ~1pm EST 09/14/22 . The Sixth Beige Book (of 2022) confirmed what has already been the theme for Fed speakers this quarter ; that we are likely to see slower economic growth in the near to medium term, the labor market is getting tighter, and that even though inflation is showing signs of moderating, it still has a long way to go before we are to see any rate cuts. The 10th GDPNow Q3 US GDP came in today at 1.4% , down from 2.6% on 09/01/22. Key Upcoming Dates: August CPI at 830am EST 09/13; The Merge (Ethereum) at 8am EST 09/14; FOMC meeting 09/20-09/21 (Statement Released at 2pm EST on 09/21).*
Price is currently attempting to form a Morning Doji Star Pattern as it defends $1500 in preparation for The Merge next week; if tomorrow's session PA results in a Bullish Engulfing Candle this would be bullish. I have also revised the uptrend line from 06/18/22 and it now reflects support at ~$1550. Volume is Moderate and is on track to favor buyers if it closes today's session in the green; this would also make three of the past four sessions buyer dominant. Parabolic SAR flips bearish at $1427 support, this margin is mildly bearish at the moment. Stochastic remains bullish and is currently trending sideways at 81 resistance. MACD remains barely bullish for the second consecutive sesision and is currently trending sideways at -26. ADX is currently trending down at 14 as Price is attempting to defend $1500, this is neutral at the moment.
If Price is able to close today's session above ~$1520 and then follow that with a Bullish Engulfing Candle in tomorrow's session, this would be indicative of a bullish continuation that would likely have it retest the 50 MA at ~$1655 as resistance leading up to The Merge. However, if Price breaks down out of the uptrend line from 06/18/22 (~$1550) then it will likely retest $1427 support . Mental Stop Loss: (two consecutive closes below) $1500.

Why Ethereum Merge Is A Big Deal for CryptosEthereum has long been known as the second-largest cryptocurrency by market cap. That will soon change, as Ethereum is poised to overtake Bitcoin in that regard. There are many reasons for this shift, including the explosive growth of investable digital tokens built on top of the Ethereum blockchain. There are now so many of these ERC-20 tokens that even Google cannot track them all. As a result, this Tradingview Idea will explain what Ethereum merge is and why it’s important for investors interested in the world of cryptos.
What Is Ethereum Merge?
The Ethereum merge is a significant change in the structure of the Ethereum blockchain. The merge will combine two separate chains into a single blockchain. This means that Ethereum tokens that are currently traded on two separate chains will be accessible on a single chain in the future. This means that any Ethereum-based tokens that have been trading on two separate chains will be available on a single chain in the future. The wallet functionality will also allow the tracking of both types of tokens in a single interface. This will reduce confusion for investors and make things more convenient for users. It will also make it easier for centralized exchanges to add more tokens. The Ethereum merge can lead to a significant shift in investor interest away from Bitcoin and towards Ether. This will have a major impact on the market capitalization of these two coins.
What Does The Future Hold for Ether?
The Ether coin is the native asset of the Ethereum blockchain. This coin has seen significant volatility in recent months and is often compared to Bitcoin. Some investors are looking to Ether as an alternative to Bitcoin due to its cheaper price. Ether has seen steady growth over the past year and has been on par with Bitcoin in terms of market capitalization. This shift in investor sentiment could result in Ether overtaking Bitcoin as the number one cryptocurrency by market cap. The Ethereum merge will make Ether more accessible to investors. It will also make it easier for centralized exchanges to add Ether to their listings. This means that interested parties will have an easier time buying and selling Ether. This is a positive sign for the future of the Ethereum blockchain and the Ether token.
Coin Based on Ethereum Merge: Etherum Dark
Investors who are looking to capitalize on the Ethereum merge can do so by purchasing Etherum Dark. Etherum Dark is a token that has been trading on the Ethereum blockchain since 2017. This coin is a great choice for those who want exposure to the Ethereum blockchain without buying Ether. Etherum Dark is based on the Ethereum blockchain. This coin is not currently available on Coinbase or other major centralized exchanges. Investors who want to purchase Etherum Dark will have to use a decentralized exchange.
How to Trade Ethereum Mergers
Ethereum mergers can be traded in the same way as other ERC-20 tokens. Investors who want to buy Ethereum mergers simply need to find a wallet that supports these mergers. They then need to send the required amount of Ether to the wallet address and wait for the transaction to be completed. Ethereum mergers can be traded in the same way as other ERC-20 tokens.
How to Benefit from the Ethereum Merge
Investors who want to benefit from the Ethereum merge should keep an eye on the price movement of Ether. If this coin sees a significant price increase, it may lead to a surge in investor interest in Ether. This would cause the price of Ether to rise even higher. Ethereum mergers will also increase in price during this time. This will provide an excellent opportunity for investors to profit from the Ethereum merge.
Which Coin Will Be Top Dog After the Merge?
There has been a lot of speculation about which coin will be top dog after the Ethereum merge. Some people say that Bitcoin Cash will win, while others believe that Ether will be the dominant coin. Ethereum mergers are very new, which means that there is still plenty of time for investors to decide which coin will be top dog after the merge. The strength of each coin is determined by various factors that are unique to each token. These include the volume traded on each chain as well as the number of wallets that hold each asset. These factors change on a daily basis and can be very volatile. This means that it is too early to determine which coin will be top dog after the merge.
A Transition from PoW to PoS
It’s also the go-to platform for developers looking to create blockchain applications — from games to smart contracts — that run on decentralized networks. The Merge, though, will change the way Ethereum works to make it a much more efficient network. The new system is called Casper, and it’s designed to make Ethereum faster and more scalable than ever before. It will also make the network significantly less energy-intensive.
"The Merge will reduce Ethereum's energy consumption by ~99.95%." Official quote from Ethereum project website.
Source: Twitter Handel: trent_vanepps
ETHUSD DAILY CHART
ETHUSD Volume Metrics
ETHUSD H4 Chart
The Event is scheduled and will take place between 13-15 September
conclusion
The Ethereum merge will result in a significant shift in investor sentiment towards Ether. This will likely lead to Ether overtaking Bitcoin as the most valuable cryptocurrency by market cap. The Ethereum merge is a significant change in the structure of the Ethereum blockchain. The merge will combine two separate chains into a single blockchain. This means that Ethereum tokens that are currently traded on two separate chains will be accessible on a single chain in the future. Ethereum mergers can be traded in the same way as other ERC-20 tokens. Investors who want to benefit from the Ethereum merge should keep an eye on the price movement of Ether. If this coin sees a significant price increase, it may lead to a surge in investor interest in Ether. This would cause the price of Ether to rise even higher.

Ethereum - "Uber-bullish merge" narrative is nonsense In our previous article, we dismissed nonsense about the “uber” bullish effect of the Merge on Ethereum. However, we also stated that we would not rule out a temporary bounce in the price while expecting it to have little to no effect on the overall trend direction. Today, we again stick to this narrative and remain bearish on ETHUSD.
We have no reason to change our bias as fundamental factors will continue to weigh on risk assets in the coming months. Additionally, technical indicators are worsening, which suggests more trouble ahead. Finally, as if it was not enough, a slowing global economy will lead to more risk aversion among assets like cryptocurrencies.
Due to that, we maintain our price targets for ETHUSD at 1 000 USD and 900 USD. Though, we have to note that we are growing increasingly bearish on the pair and expect it to drift below our price targets over time.
Illustration 1.01
Illustration 1.01 shows the most recent developments on the daily chart of ETHUSD. Yellow arrows indicate three bearish breakouts and one bullish retracement.
Technical analysis - daily time frame
RSI, Stochastic, DM+, and DM- are all bearish. MACD is neutral. Overall, the daily time frame is bearish.
Illustration 1.02
Illustration 1.02 shows the daily chart of ETHUSD and two simple moving averages. Yellow arrows indicate bullish and bearish crossovers. The current constellation of moving averages is bearish.
Technical analysis - weekly time frame
RSI, Stochastic, MACD, DM+, and DM- are all bearish. Overall, the weekly time frame is bearish.
Please feel free to express your ideas and thoughts in the comment section.
DISCLAIMER: This analysis is not intended to encourage any buying or selling of any particular securities. Furthermore, it should not be a basis for taking any trade action by an individual investor. Therefore, your own due diligence is highly advised before entering a trade.

Ethereum forecast and analysisPlease write any advice or suggestions.
Dear friends, request any cryptocurrency pair, currencies pair for forex, and any index that you want to be analyzed and ask any questions.
Thanks for your attention
---------------------------------------------------------
Ethereum | ETHUSD and ETHUSDT

ETH/USD - TRIPLE TOP INCOMINGI believe we will have another go towards the ATH and reject from there.
If not then I was wrong hahahahahahiahaihiiheaiai

Ethereum forecast Please write any advice or suggestions.
Dear friends, request any cryptocurrency pair, currencies pair for forex, and any index that you want to be analyzed and ask any questions.
Thanks for your attention
---------------------------------------------------------
Ethereum

Ethereum forecast and signalPlease write any advice or suggestions.
Dear friends, request any cryptocurrency pair, currencies pair for forex, and any index that you want to be analyzed and ask any questions.
Thanks for your attention
---------------------------------------------------------
Ethereum vs Tether

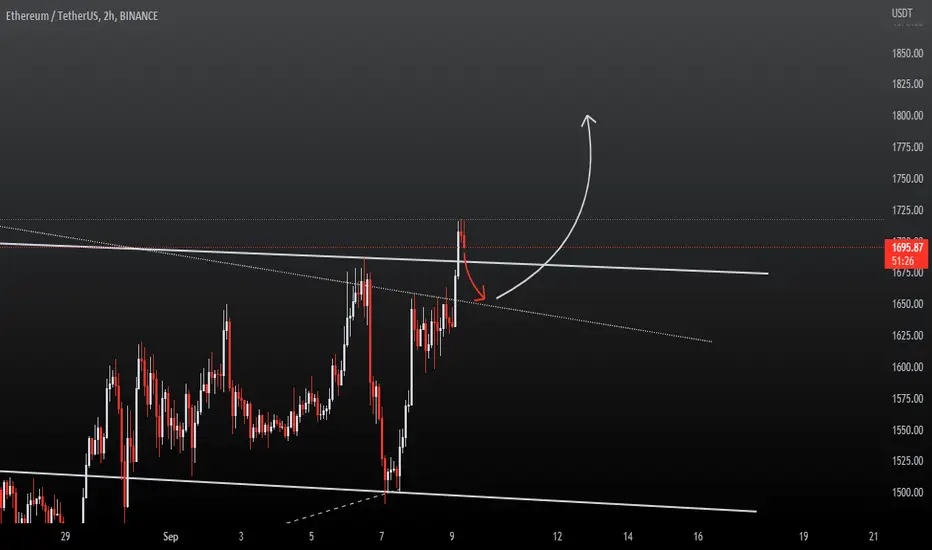
$ETH SIGNAL +500 PIPS & RUNNING!$ETH has been in a bear market since last year in NOV. we will see a big drop after the merge but until then it could retrace and test the 1750 area before the merge> we are still bearish and will continue to look for sells only!

ETHERUEM for a 1 way TICKET DOWN SOUTH!The Narrative for Ethereum goes like this:
The ADR for Etheruem flucuates between 100-180pioints.
Crypto is volatile and really doesn't abide by any rules thus the fluctuation with the ADR. Nevertheless with some detective work going back about a good 7 to 10 days you can get a lock in on the ADR.
Ethereum likes to throw a 30-50 point MZ then break to for minimum 50 points before a major pullback. Catch her on the right day and she will give you 90-100 points. Weekends she's a little lazy but still should give you 50 points after she breaks north or south of the MZ border.
This Saturday Sept 3, 2022 she has broken south looking like a 1 one way ticket to Miami ; with a strong possibility of leaving the country for the southern islands.:)
A big clue was that gap made at 5PM EST yesterday evening which was filled completely with the 2AM EST 15 min Candle indicating the trip south was eminent.
After that gap was filled a slight retrace to liquidate the shorts out of their fortunes then another order block. Then the last move to liquidate the rest of the shorts out of their fortune before the main move to Miami with all of us who are prepared to hold for the adventure south. ( #SniperMarketMechanics )
As always never over leverage.
Trust your set up-give the script a chance to manifest; and crypto likes to improvise so the right leverage will allow you to comfortably watch the show.
It's the weekend- HAVE FUN!
I AM Pro Trading made Simple. Master Jedi & Sensi of #SniperGang
EVERYBODY EAT$

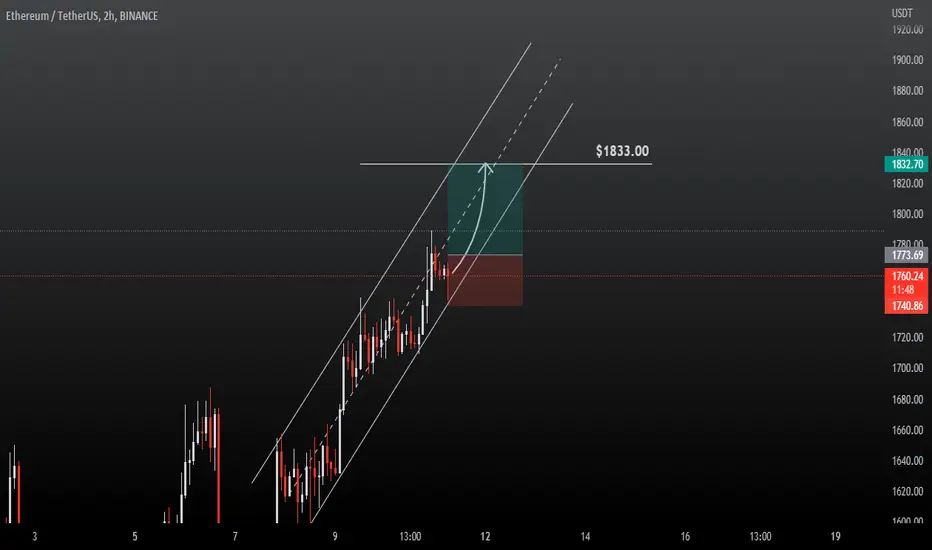
A short term movement prediction for ethereumMarkets are in choppy mode. Future contracts dominated, very little volume for the spot. Elliot's fifth corrective wave not yet on the play but i expect very soon. Now it's the play time. #ETH may enter in the box and if rejected from 1700 - 1750 area, then a double top will be confirmed. First retrace will the trend support but if #btc plays 5th corrective wave, the correction will be deeper for both #ethereum and #bitcoin .This is not a financial advice. Always do your decisions by yourself.
