#Ethereum! - You beauty! This can be bought till 2250!ETHEREUM to BREAK 2250 soon and its going to be a blast!, buying from 1850's was recommended but today if it breaks 1950 you can see that much momentum in a day!!!!! 1850 on targets if it retraces you can buy!
Ethereumforecast

Ethereum forecast and signalthis signal can activate again. the setup is complete.
-------------------------------------------------
Please write any advice or suggestions.
Dear friends, request any cryptocurrency pair, currencies pair for forex, and any index that you want to be analyzed and ask any questions.
Thanks for your attention

ETH IS IN A RISING WEDGE | BEARISHWe are hitting a fib level and rejecting nicely. We are also trading in a rising wedge which is also bearish. Ethereum is ready to fall down to lows and we can see some nice bullish action when we find support and push up to ATHs.
Please leave your thoughts about this in the comments!

ETH Daily TA Cautiously BullishETHUSD Daily cautiously bullish. Recommended ratio: 75% ETH, 25% Cash . * All US CPI numbers beat estimates this morning and Overall CPI stayed flat at 8.5%, causing Cryptos, Equities, Commodities and the 30yr Treasury Bond to go up. Meanwhile the VIX, DXY and all other Treasuries are falling. Markets are continuing to push the narrative of 'Peak Inflation' and 'Incoming Fed Pivot' as we near US midterm elections, this is driving investors to become more Risk-On. Overall CPI staying flat can be largely attributed to the White House finally deciding to tap in to the Strategic Oil Reserve (in addition to OPEC+ increasing output) last month, bringing gas prices down 19% from their ATH in July. Core CPI (which excludes energy and food) was still up 0.3% (compared to 0.5% estimated). The fourth GDPNow US Q3 GDP estimate released this morning is +2.5%, up from the previous estimate (08/04/22) of +1.4%; this likely added bullishness to today's session. Coinbase missed on earnings and revenue in Q2 and posted a $1b loss due to the ongoing 'Crypto Winter'. Chicago Fed President Charles Evans said that he supports a 4% FFR in 2023 and EOY FFR of 3.25%-3.5% for 2022, and that today's CPI reading was encouraging but that the next Employment Situation and PCE numbers will help determine whether or not inflation is really slowing. The Merge is currently scheduled for launch on Ethereum's Mainnet on 09/13/22 . Key dates this week: Disney Q3 earnings today at 430pm EST; PPI at 830am EST 08/11.* Price is currently breaking out above $1711 minor resistance and will look to retest $1941 resistance in the coming sessions if it can flip $1711 minor resistance to support. Volume is Moderate (high) and favoring buyers which indicates that this breakout has some momentum. Parabolic SAR flips bearish at $1477, this margin is mildly bearish. RSI is currently testing the uptrend line from 06/18/22 as resistance at ~66, if it can reclaim support here this would be bullish. Stochastic is currently crossing over bullish at 61 after bouncing abruptly at 53, the next resistance is at 81. MACD is currently crossing over bullish at 96 after trading sideways for 6 consecutive sessions, if it holds then the next resistance is the upper trendline of the descending channel from August 2021 at ~137 (just below 155 resistance). ADX is currently trending up slightly at 29 as Price is pushing higher, this is bullish. If Price is able to establish support at $1711 minor resistance then the next likely target is a retest of $1941 resistance . However, if Price breaks back below $1711 minor resistance , it will likely retest ~$1600 before potentially retesting $1427 support . Mental Stop Loss: (one close below) $1692 .

It´s ETH time! Looks bullish as it getsEthereum now clearly on the way up leaving behind the 12may disaster.
If you are of the spot type of investor, I say this is it.
My prior $3,500 target for January 2023 has been brought forward.

Ethereum ETH: 1D Chart UpdateHello friends, today you can review the technical analysis idea on a 1D linear scale chart for Ethereum (ETHUSD).
Ethereum price has been rising since the July lows. The chart shows a variety of signals with potential for upward movement around the resistance areas at the top of the Keltner Channel (KC) near the 0.382 Fibonacci level. A major concern is Volume dropping off.
Also Included: Fibonacci Retracement, RSI, MACD, Stochastic RSI, Ichimoku Cloud, and VPVR.
If you enjoy my ideas, feel free to like it and drop in a comment. I love reading your comments below.
Disclosure: This is just my opinion and not any type of financial advice. I enjoy charting and discussing technical analysis . Don't trade based on my advice. Do your own research! #cryptopickk

ETHUSD - Breakout StructureThe red downtrend has been broken (4Hour timeframe)
A break out structure above this trend line is also evident (rising wedge or ascending triangle)

ETH#ETH $ETH
- ALT BAT 🦇
- Daily Frame
#This is my technical opinion and not a recommendation to buy or sell

Ethereum January 2023 @$3,500 and beyondProjections for Ethereum point towards reaching $3,500 in January 2023.
The expected $10,000 would have to wait a little more. However, the future is foggy and we never know.
Let´s stayed tuned and adjust this targets often.

ETH IS Slowly Melting... Slowly...This chart breaks down a SHORT set up.
Eth likes to liquidate both long and shorts AS she makes the main move south.
It's the weekend. Put something light on her and let her run the course to Miami (SOUTH aka SHORT)
There is genius in simplicity. This simple chart expresses That Fact.
Bitcoin is buying and these two often are Ying and Yang.... to add to your confluence check list.
Never Over Leverage.
Trust your Trade Set Up.
Have Fun!
I Am Pro trading Made Simple.
We are #SniperGang

ETH/USDT Breakout Zone we going to have a breakout and going towards the 2k$ mark , if we held our current ascending line and broke our resistant resistant .
other wise we going to have the price going back to the 1520$ support , to find a buying pressure and retest this Level again .


Ethereum - watching support levelEthereum
Intraday
We look to Buy at 1571 (stop at 1524)
We look to buy dips. The previous swing low is located at 1560. Bespoke support is located at 1550. Daily signals are mildly bullish.
Our profit targets will be 1688 and 1728
Resistance: 1700 / 1750 / 1780
Support: 1600 / 1550 / 1500
Disclaimer – Saxo Bank Group. Please be reminded – you alone are responsible for your trading – both gains and losses. There is a very high degree of risk involved in trading. The technical analysis, like any and all indicators, strategies, columns, articles and other features accessible on/though this site (including those from Signal Centre) are for informational purposes only and should not be construed as investment advice by you. Such technical analysis are believed to be obtained from sources believed to be reliable, but not warrant their respective completeness or accuracy, or warrant any results from the use of the information. Your use of the technical analysis, as would also your use of any and all mentioned indicators, strategies, columns, articles and all other features, is entirely at your own risk and it is your sole responsibility to evaluate the accuracy, completeness and usefulness (including suitability) of the information. You should assess the risk of any trade with your financial adviser and make your own independent decision(s) regarding any tradable products which may be the subject matter of the technical analysis or any of the said indicators, strategies, columns, articles and all other features.
Please also be reminded that if despite the above, any of the said technical analysis (or any of the said indicators, strategies, columns, articles and other features accessible on/through this site) is found to be advisory or a recommendation; and not merely informational in nature, the same is in any event provided with the intention of being for general circulation and availability only. As such it is not intended to and does not form part of any offer or recommendation directed at you specifically, or have any regard to the investment objectives, financial situation or needs of yourself or any other specific person. Before committing to a trade or investment therefore, please seek advice from a financial or other professional adviser regarding the suitability of the product for you and (where available) read the relevant product offer/description documents, including the risk disclosures. If you do not wish to seek such financial advice, please still exercise your mind and consider carefully whether the product is suitable for you because you alone remain responsible for your trading – both gains and losses.

Jamie Gun2Head Idea - Selling EthereumTrade Idea: Selling Ethereum
Reasoning: At resistance level, price is still, looking to drive lower within the channel
Entry Level: 1665
Take Profit Level: 1567
Stop Loss: 1692
Risk/Reward: 3.63:1
Disclaimer – Signal Centre. Please be reminded – you alone are responsible for your trading – both gains and losses. There is a very high degree of risk involved in trading. The technical analysis , like all indicators, strategies, columns, articles and other features accessible on/though this site is for informational purposes only and should not be construed as investment advice by you. Your use of the technical analysis , as would also your use of all mentioned indicators, strategies, columns, articles and all other features, is entirely at your own risk and it is your sole responsibility to evaluate the accuracy, completeness and usefulness (including suitability) of the information. You should assess the risk of any trade with your financial adviser and make your own independent decision(s) regarding any tradable products which may be the subject matter of the technical analysis or any of the said indicators, strategies, columns, articles and all other features.

Ethereum: ChillaxingEthereum has been chillaxing in a sidewards movement for a while now. However, it should start to take some action soon! We expect it to climb into the orange zone between $1902 and $2207, where it should finish wave (i) in blue. Afterwards, Ethereum should drop into the blue zone between $1475 and $1017 to complete wave (ii) in blue. There is a 40% chance, though, that Ethereum could continue to fall below the support line at $883.

Still long opportunities in EthereumEthereum
Intraday
We look to Buy at 1571 (stop at 1524)
We look to buy dips. The previous swing low is located at 1560. Bespoke support is located at 1550. Daily signals are mildly bullish.
Our profit targets will be 1688 and 1728
Resistance: 1700 / 1750 / 1780
Support: 1600 / 1550 / 1500
Disclaimer – Saxo Bank Group. Please be reminded – you alone are responsible for your trading – both gains and losses. There is a very high degree of risk involved in trading. The technical analysis, like any and all indicators, strategies, columns, articles and other features accessible on/though this site (including those from Signal Centre) are for informational purposes only and should not be construed as investment advice by you. Such technical analysis are believed to be obtained from sources believed to be reliable, but not warrant their respective completeness or accuracy, or warrant any results from the use of the information. Your use of the technical analysis, as would also your use of any and all mentioned indicators, strategies, columns, articles and all other features, is entirely at your own risk and it is your sole responsibility to evaluate the accuracy, completeness and usefulness (including suitability) of the information. You should assess the risk of any trade with your financial adviser and make your own independent decision(s) regarding any tradable products which may be the subject matter of the technical analysis or any of the said indicators, strategies, columns, articles and all other features.
Please also be reminded that if despite the above, any of the said technical analysis (or any of the said indicators, strategies, columns, articles and other features accessible on/through this site) is found to be advisory or a recommendation; and not merely informational in nature, the same is in any event provided with the intention of being for general circulation and availability only. As such it is not intended to and does not form part of any offer or recommendation directed at you specifically, or have any regard to the investment objectives, financial situation or needs of yourself or any other specific person. Before committing to a trade or investment therefore, please seek advice from a financial or other professional adviser regarding the suitability of the product for you and (where available) read the relevant product offer/description documents, including the risk disclosures. If you do not wish to seek such financial advice, please still exercise your mind and consider carefully whether the product is suitable for you because you alone remain responsible for your trading – both gains and losses.

Next Expected Moves of Ethereum Looks like ETH is correcting in short time frame like ABC, I had already completed its AB waves now time to complete C wave and C is completing in 5 moves of Terminal Impulse pattern. Which should be ended atleast 2k. It's overall B wave of long term downward A wave.

Is Crypto the Next Sub-Prime Crisis? ETHUSD (Ethereum) POVMore on this later...
For now, if you consider the very real possibility that a recession can quickly become catastrophic with: a war in Europe, seemingly enhanced instability in Asia, Record Inflation, and among other things - the current unwinding of a crypto currency bubble.
I'm not totally certain on this, but never in history has there ever been something with such little use, valued so highly (relatively speaking). Okay, tulips, calm down.
Even the diehard crypto philosophers (aka #cryptosophers) will concede ideas like: "Meeehh... It's very volatile at times"... granted they only say stuff like that on positive price action; otherwise it's some defensive narrative about what is actually just overcooked libertarianism.
The point I want to make is: things remain very volatile post-covid. Interest rates are one off-hand example. Commodities pulling back. Things can get weird real quick. And not only does crypto still looks dangerous, you have to really ask yourself: can this useless digital ledger token do anything? Like can it be spent anywhere other than an arcade?
Lol - I bet "subprime" just drives them cray.
Take care!


ETH 5th wave Eth going doing with btc to form the fifth and final wave maybe next month targer 700 minimum - 300 max bear
Good luck

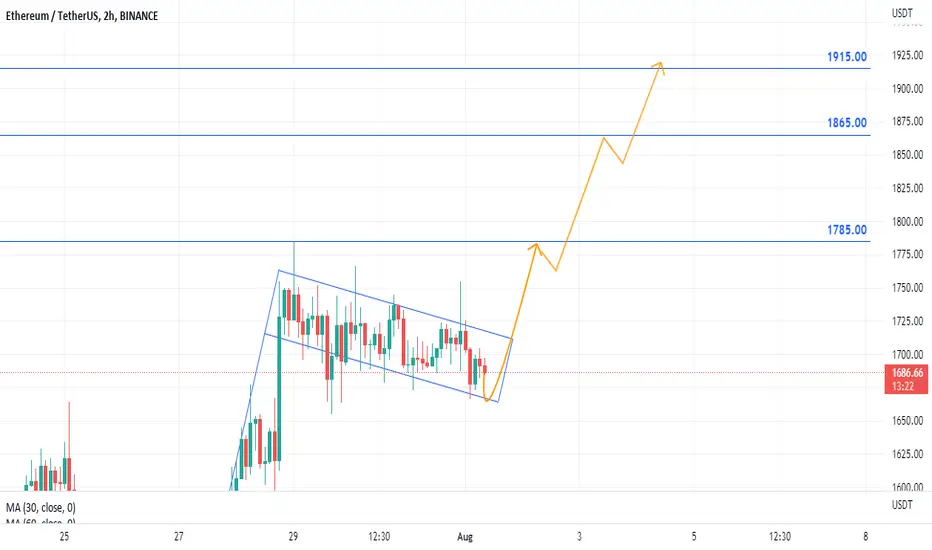
Ethereum Usdt idea/ forecast | simple signalA simple bullish trend after breaking the flag resistance line
Technical Bounce Plausible?The market is ultra bearish, but perhaps we're about to establish a sideways trend? The market has been hinting it for weeks and has not set lower lows. Fundamentals are bearish, but conditions are reasonably oversold for now in the short term. It makes sense for a reflexive bounce as shorters cover their positions, but alas I do not think it will be enough to turn the market around, so I do not forsee a larger rally yet.
If we break below 1000 there is a clear violation of structure and the idea is invalid. Maybe there will be another drop yet. I would prepare for that also incase some really really bad news breaks.
Banks are putting cash aside to prepare for loan defaults. If that's not some sort of leading signal for more bearishness, I don't know what is.
Be prepared either way.
What do you think? Let me know!
Cheers and don't forget to hedge your bets!

ETH (the most important key level)ETH / USDT
Since 1 year and half , ETH is trading around 1700$ area Up and Down
Why i call it the most important key level
Look at chart, the violet color rectangle
Every time price touch this area it either an indicator for shift of trend to real bullmarket (2 times 182% in AVG) or bear which happened once ETH brokedown 1700$ in last June . as a result price dumped by 50%
Today we test this area again
The price action will indicate the long run either this a real local bottom for altcoins or we still need more crashes !
My vote is for bulls, august is likely a green month
Whats your vote ? Bulls or bears
Don’t forget to like this idea for more analysis and signals
best wishes
