ETHUSDT, long to strong and maximum daily level 1253.Hi friends.I mark all important levels on the ETHUSDT chart window. Like you can see we have big volume of solds (traders close they loses) that was bought by exchange. Now close target 1253 (maximum daily X-Lines Level) in respect. Follow me.
Ethereumlong

ETHEREUM TO BREAK THE LAST HIGHEthusd is set to break above the last price high, all eye son 1400 and above, stay tuned

etherium Long - eth I have 3 different targets. If we can stay above the grey top line when the 4 hour crosses we will hit our first target in 24 hours, 2nd target in 48 hours. Make sure to take profits and setup your stop loss. My stop loss is at the first bottom grey line.

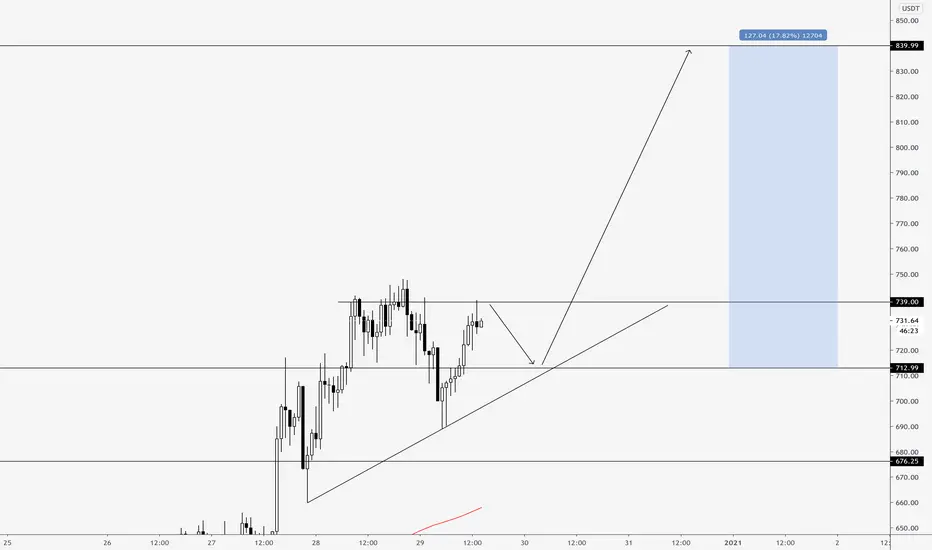
13% Ethereum Opportunity Presents Itself After Triangle BreakoutIn this technical analysis I share my current views on ETH/USD. I tried to make the chart as self-explanatory as possible, but feel free to reach out or drop a comment if you have any questions.

Next Stop for Eth ?Nothing much to add. IT is forming a bullish structure similar to the previous one that got us above $700!
Trade with caution
ETH Has Formed A Massive Cup & Handle - Possible $2K TargetSo after the ascending triangle breakdown we still have hope for a spectacular move up for ETH. If you zoom out to the weekly time frame you will notice that a GIANT cup and handle pattern has formed. We just experienced a classic 30% correction forming the handle portion.
Macro target for profit taking is just above $2K as this will be a quick move over the coming days, as I see a $450B-$470B market cap for Alts incoming. Of course we will have to monitor BTC just to make sure it doesn't spoil the fun; however I see BTC hitting $46-$47K over the next 4-5 days.
Remember this is only my formed analysis outlook. This is not an endorsement or recommendation to buy or sell.

ETH Right On Track For $2500ETH looks like its playing out a classic head and shoulders , my target would be close to the local top we put just under ATH .
ETH pullback was clear as when BTC approached its all time high we also pulled back and consolidated for a while. We are in a raging bull market but dont forget, nothing just keeps going up. Low leverage and you should be able to sleep through these drops.
BTC ATH pullback (-20%):
ETH ATH pullback (-33%)
Notice how ETH reacted with the major support after that large drop, can it drop more? Sure can, but I took some positions and I am ready for it to go lower and will add! When BTC broke its ATH in 2017 and just recently we did over 100% move. If ETH follows suit, I will be cashing out.... I mean we are in a bull market. This aint financial advice

ETH - Potential Cup & Handle FormingHope you enjoy my analysis.
I believe we are seeing a multi-week cup & handle forming on the weekly chart.
There's a chance for more downside (forming on the handle, to complete the continuation pattern), before moving upwards towards 1400 (previous All time High and resistance area).
Next area of interest would be ~1700$
"As a stock forming this pattern tests old highs, it is likely to incur selling pressure from investors who previously bought at those levels; selling pressure is likely to make price consolidate with a tendency toward a downtrend trend for a period of four days to four weeks, before advancing higher. A cup and handle is considered a bullish continuation pattern and is used to identify buying opportunities."

ETH price TARGET revision + where to GET INEthereum is going down like crazy. Yeah, it was overbought, and yes, the previous rise was massive, but I understand that many buyers just wanted to be IN. So if you bought it higher, and now you need to dilute your position, I can show you some levels to enter into ETH.
Despite this massive fall, we are still bullish, but... It does not mean that we can't go lower. If you are prepared to BUY, save some cash for lover levels.
Here you have levels for LONG positions:
$939
$905
$853
$831
$805

Ethereum Screaming "Catch Me" - Seeking Some Sort of Support Ethereum has been rattled by the ongoing sell-off at the crypto market. Just failing to make new ATHs it crashed already to a hard rocky -30% bottom @ $950.
As all crypto assets it is desperately to to cling to a support line.
The $900 level seems to be the best hope right now. Mid-February 2018 this was a resistance level and could now turn into support.
Also the $900 level is a 0.618 fib. retracement level considering the rise from end of November 2020.
Ethereum may also "only" retrace to the -30% bottom at $950 for building support.
There of course potential Bitcoins selling pressure will push Ethereum down lower to $750.
If Ethereum manages to close this week at above $1k that would be a good starting level to continue the bull run.
That level is the upper Bollinger Band.
Short-term these next couple of days rather short / bearish, but beyond that if Ethereum conquers back the upper Bollinger Band bullish again.
This may just be the best buy-in opportunity available before the parabolic rise of Ethereum t0 20k.
More on that later.

ETH ASCENDING TRIANGLE BREAK TO $1,515 ETH has broken out of it's ascending triangle and looks to be heading north of $1,500
It will likely head much higher over the coming weeks, so this is just a first area for profit taking.
Remember this is only my formed analysis outlook. This is not an endorsement or recommendation to buy or sell.

Are you prepared for the next Ethereum bull run soon? Check outAt the moment, the best chart to analyze Ethereum it's the H4 timeframe and well, we see that Ethereum it's still bullish in H4 timeframe, but if you look in Daily we are bullish, but looking in H4 it's more bullish and soon, we could see a next movement so volatil in Ethereum that I considered to large my long position toward the $2,000 dollars,that will be my next target to reach up because Ethereum it's so near to touch the $1,400, the maximum price that Ethereum make higher. So, for that, I have this plan becuase when Ethereum was around of $400 USD, the volatil was grow up a lot and well, the volatil above of $1,000 dollars it's so hard and compared with Bitcoinn, Bitcoin have a so volatil market in he history!!!
At the moment, I put a buy order limit at $1,990 USD and the SL it's around of $1,025 dollars.

ETH to $1800 Short termIf we breakout of the running triangle, we might retest its top (if you are still not in it, this is the add zone). If that happens, we will then rally to ATH, breakout, retest and go to $1800. Its gonna happen. I know I said no more ETH posts but I had way too many DMs asking me about a short term play - so here you go. Enjoy and dont sleep. Jocko was awake when you were drooling and snuggling with your teddy bear

ETH Buy a break setup.Ethereum - Intraday - We look to Buy a break of 1244 (stop at 1196)
This over-extended move shows no sign of slowing.
Daily signals are bullish.
We look for gains to be extended today.
There is no indication that the rally is coming to an end.
Short term RSI is moving higher.
Our outlook is bullish.
Trading volume is increasing.
Our profit targets will be 1388 and 1444
Resistance: 1225 / 1250 / 1300
Support: 1180 / 1100 / 1080


ETHUSDT - I told you buy...H ow many times have I told you to buy.
1
2
3
4
5
Who bought?
Now I think that ether has the potential to move up to $ 780-800 ( entry point looking local)

ETH Long : ClosedETH broke its ascending triangle and reached all targets .
If you like the analysis, express your opinion in the comments and send it to your friends 🙏🏻
goodluck !
TP 1 ✅
TP 2 ✅✅
TP 3 ✅✅✅
TP 4 ✅✅✅✅
TP 5 ✅✅✅✅✅
16 % Spot Profit ✅🔥🔥🔥🔥🔥
80 % Furture Profit with 5x ✅🔥🔥🔥🔥🔥

Ethereum to $9000 then $18,000As crazy as it sounds, ETH is going to at least $9000, then possibly $18,000 from there. This current chart will be dwarfed. You may think I am crazy but its happening. I will not do any other ETH posts until it gets there and when it does, I will tag this post in it for you to sit and watch back and ask yourself "How did I miss it?". Answer is simple - You were trading 30 min, 45 mn, 1 hr, 2hr charts that simply do not matter.
Here is a simple truth for you to digest: In a few weeks they will unleash another trillion dollar beast into the market and that money will go places. You either prepare and accept that money like the 1% assholes do (through asset price inflation because thats exactly where that money is going to) or sit back, relax, watch some Netflix and wait for your $600 or $2000 stimulus check like 99% do. Make a choice.
EVERYTHING will go up and it will go up so fast you won't even remember how it happened. It doesnt matter if it solves any world problems.
and please don't make me say "I told you so"
Good luck!

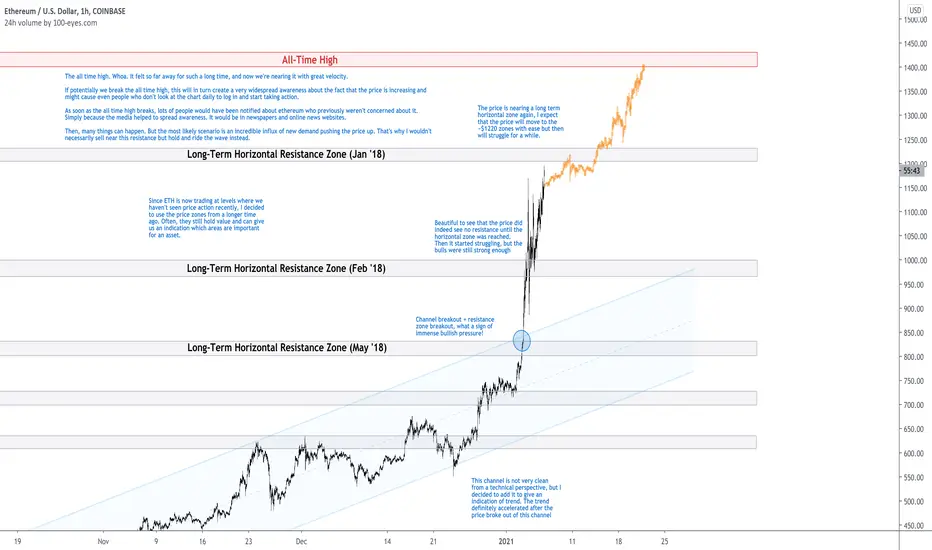
Ethereum On The Way To $1400 🚀In this technical analysis I will walk you through my expectations for ETH on the short term. The price is nearing a long term horizontal zone again, so I expect that the price will move to the ~$1220 horizontal zone with ease but then will struggle for a while.
You might be wondering where I get these horizontal zones from as you can see they are not directly linked to price behavior on the chart.
Since ETH is now trading at levels where we haven't seen price action recently, I decided to use the price zones from a longer time ago. Often, they still hold value and can give us an indication which areas are important for an asset.
I believe that the uptrend is incredibly strong, and we are looking at a test of the all time high very soon.
The all time high. Whoa. It felt so far away for such a long time, and now we're nearing it with great velocity.
If potentially we break the all time high, this will in turn create a very widespread awareness about the fact that the price is increasing and might cause even people who don't look at the chart daily to log in and start taking action.
I decided not to chart beyond it for now, as I want to keep a close look at the shorter timeframe action first.
As soon as the all time high breaks, lots of people would have been notified about ethereum who previously weren't concerned about it. Simply because the media helped to spread awareness. It would be in newspapers and online news websites.
Then, many things can happen. But the most likely scenario is an incredible influx of new demand pushing the price up. That's why I wouldn't necessarily sell near this resistance but hold and ride the wave instead.
Follow me for consistent high quality updates, with clear explanations and charts.
Please like this post to support me.
- Trading Guru
--------------------------------------------------------------
Disclaimer!
This post does not provide financial advice. It is for educational purposes only!
ETHUSDT (Ascending Triangle Breakout)#ETHUSDT(Weekly chart) Technical Analysis Update
Ascending Triangle Breakout
ETH/USDT currently trading at $1175
Long Entry-level: $ 1160 to 1180
STOP LOSS: Below 1085
Target 1:$1255
Target 2: $1350
Max leverage: 4X
ALWAYS KEEP STOP LOSS...
Follow our Tradingview Account for more Technical Analysis Update, | Like, Share and Comment your thoughts.

ETHEREUM POSITIONED TO BREAK ATH BETWEEN JAN 11-17 - EYEING $2K+Sup winners.
Latest update on ETHUSD - looking at price ranges for when ETHBTC will be reaching the top of its channel (between Jan 17 & Feb 8).
In that time period, we should see ETHBTC arrive between 0.05 and 0.06.
Based on the current channel it's in, we can presume that Ethereum will break its previous ATH within a ~week of today (1/6/21).
Beyond that, Bitcoin's performance will indicate how long and how high ETHUSD will reach.
See my golden dorito.
I am looking at $1740 on the low end and (hold onto your undies) $3415 on the high end.
Is $3415 likely? No.
That would require Bitcoin to rally up to ~~ $57K. Impossible no, unlikely very.
Somewhere above $2K is where my eyes are set. Again, assuming Bitcoin remains flat around $35K we can project our Ether price points:
.06 x $35K = $2100
.05 x $35K = $1750
However, we have a few bullish checkpoints coming up:
- Layer 2 Phase 1 launch onto mainnet January 15th, which should greatly help reduce gas fees and bring more activity to the network should it go smoothly.
- CME launching Ether Futures on Feb 8th -- more visibility and action for institutional cash
- Blue wave in the Senate with GA outcomes, and with that, any additional exorbitant federal stimulus plans emerging could very well also boost the crypto market as the dollar weakens, inflation ramps up, and investors look for assets to defeat said ramping inflation
Hodl your bag it's only going to get heavier.
- EK69420

ETH Buy a break setup.Ethereum - Intraday - We look to Buy a break of 1061.3 (stop at 1018.8)
The trend of higher highs is located at 1190.
Daily signals are bullish.
We look for gains to be extended today.
There is no indication that the rally is coming to an end.
Bullish divergence can be seen on the 4 hour chart (the chart makes a lower low while the oscillator makes a higher low), often a signal of exhausted bearish momentum, or at least a correction higher.
Our outlook is bullish.
Trading volume is increasing.
Our profit targets will be 1188.8 and 1274.4
Resistance: 1060.0 / 1100.0 / 1150.0
Support: 1000.0 / 980.0 / 950.0

ETH-4h. Buyers are preparing to update the historic high!ETH investors received a nice gift over the weekend. Raising the price by almost 60% , buyers easily broke the critical range, which we wrote about in the previous idea - $800-840 .
Having set a new local high of $1162 , buyers felt resistance in the range of $1123-1156. In the 15-minute timeframe, you can clearly see how the volumes started to increase in this range and the sellers easily turned the price.
Thus, the ETH price went beyond the growth channel and is preparing for the main sale - the $1260-1350 range test . Breaking this range, ETH will update its historic high.
The critical point for this growth scenario is the $840 mark . After breaking it, sellers will quickly lower the price to $750.
our ETHBTC idea:
________________________________
We create both short-term ideas (for a local understanding of the market situation) and medium-term forecasts of price movements.
Subscribe to us and get daily concise analytics!
