Ethereum Eyes $8K After Bullish BreakoutEthereum (ETH) is setting up for a powerful move. After hitting a multi-month high last week, ETH pulled back into a higher-low formation—strengthening the newly established bullish trend.
Money flow is shifting: with recent crypto legislation, Ethereum is now benefiting even more than Bitcoin, marking a notable change in market dynamics.
📈 Technical Highlights:
✅ Short-term target: $4,800–$5,000 (new all-time highs)
✅ Long-term potential: $7,000–$8,000
🛡️ Key support: $2,800–$3,000 (bullish as long as this holds)
📣 Takeaway:
Ethereum’s trend is firmly bullish. As long as support holds, pullbacks could offer strong entry opportunities for both swing traders and long-term investors.
#Ethereum #ETHUSD #Crypto #Trading #TechnicalAnalysis #CryptoTrading #EthereumPrice #Altcoins #Bullish #Breakout
Ethereumprice

Ethereum: Breakout Holds Strong | Next Targets $4K, $7K+Last week, three major crypto bills cleared the U.S. House of Representatives—and Ethereum (ETH) is emerging as the biggest winner from this legislative momentum.
ETH recently broke out of a rounding bottom pattern and hasn’t looked back. Momentum continues to build, and it’s now outperforming most other major assets.
📈 Technical Highlights:
✅ Short-term target: $4,000
✅ Long-term potential: $7,000–$8,000
🛡️ Key support: $2,700–$2,800 (bullish as long as this holds)
📣 Takeaway:
Ethereum’s breakout remains intact. Pullbacks into support could offer high-probability setups for swing traders and long-term investors.
#Ethereum #ETHUSD #Crypto #Trading #TechnicalAnalysis #CryptoTrading #EthereumPrice #Altcoins #Bullish #Breakout

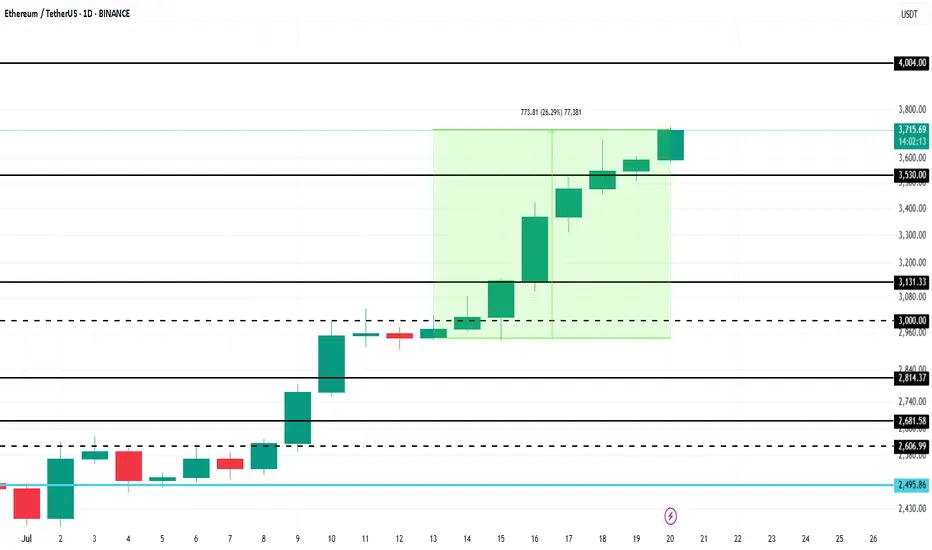
Ethereum Price Hits 6-Month High, Up Next $4,000BINANCE:ETHUSDT has managed to navigate recent market volatility with significant support from investors. As companies increasingly mirror Bitcoin’s corporate treasury use case, Ethereum is gaining traction.
BINANCE:ETHUSDT price surged 26% over the past week , reaching $3,715 and marking a 6-month high. The rally strengthened after ETH formed a Golden Cross last week. With this bullish momentum, Ethereum is now targeting $4,000 in the coming days, benefiting from investor confidence and growing institutional interest.
However, if BINANCE:ETHUSDT bullish momentum weakens and investors opt to sell, the price could decline to $3,131 . This would erase recent gains and invalidate the current bullish outlook.
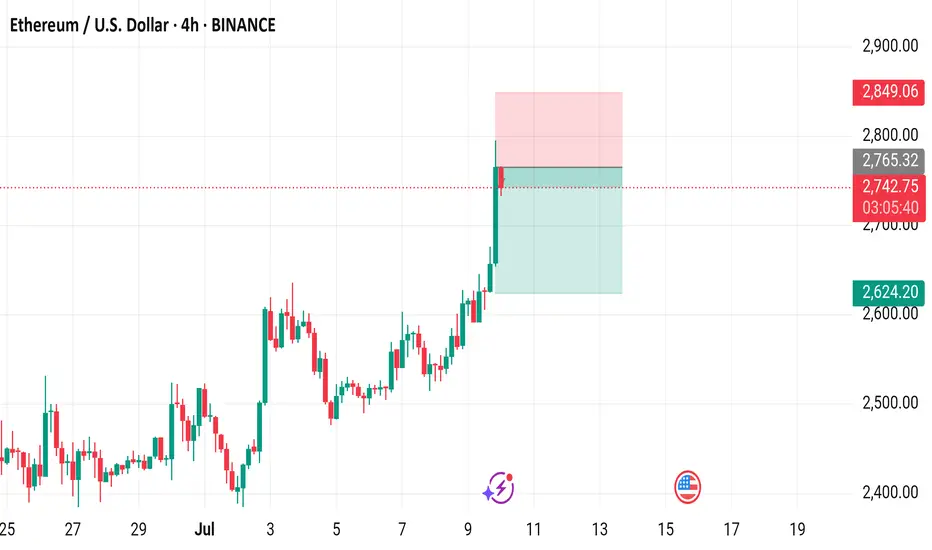
Ethereum / U.S. Dollar 4-Hour Chart (BINANCE)4-hour candlestick chart displays the price movement of Ethereum (ETH) against the U.S. Dollar (USD) on the BINANCE exchange. The current price is $2,740.99, reflecting a +$124.74 increase (+4.77%) in the last period. The chart includes a buy/sell indicator with no current activity (0.00), a resistance zone highlighted in pink, and a support zone in light green. The price has recently surged, breaking through the $2,740.99 level, with additional price points ranging from $2,400.00 to $2,949.06 shown on the right axis. The time frame spans from late June to July 10, 2025.
Ethereum: Eyeing New Highs?Ethereum has surged recently and continues rising in turquoise wave B. The next target is a break above the June high, with potential upside to resistance at $4,107. A direct breakout above this level (27% probability) would suggest green wave alt. ended in April. However, our main scenario expects a reversal below $4,107, with turquoise wave C likely dragging ETH into the Long Target Zone between $935.82 and $494.15 to complete wave .
📈 Over 190 precise analyses, clear entry points, and defined Target Zones - that's what we do.

ETH/USDT Price Action Analysis — Bullish Continuation Expected 📊 ETH/USDT Price Action Analysis — Bullish Continuation Expected 🚀
🔍 Chart Overview (as of June 9, 2025):
This chart of ETH/USDT highlights a well-defined support and resistance structure, projecting a potential bullish move toward a main resistance target at $2,788.00.
🧱 Key Zones:
🔵 Support Zone: $2,440 – $2,480
Price rebounded strongly from this area, showing buyer interest and liquidity absorption.
🟠 Resistance Zone: $2,660 – $2,690
Previously rejected zone where supply overtook demand. Price must break and hold above this for further upside.
🔺 Main Resistance Target: $2,788.00
If resistance is cleared, this is the next major supply area, acting as a potential take-profit level.
📈 Price Action Insight:
Price is currently hovering near $2,538.37, approaching resistance.
The chart suggests a potential breakout scenario after a short consolidation.
A bullish breakout above $2,690 could trigger a sharp rally toward the $2,788 target.
The chart projects a pullback-retest pattern (break, retest, and continuation) before the final leg up.
⚠️ Risk Management:
Invalidation Level: $2,381.49
A break below this level would invalidate the bullish setup and could lead to further downside.
✅ Summary:
Bias: Bullish 📈
Entry Area: Break and retest above resistance zone ($2,660–2,690) 🔓
Target: $2,788 🎯
Invalidation: Below $2,381.49 🚫
📌 Note: Always use proper risk management and confirm breakouts with volume or momentum indicators (e.g., RSI, MACD).

ETH Breakout Setup: Eyeing $2,550 Target!"Key Observations:
Strong Support Level: ETH has bounced from a strong support zone around $1,792 - $1,905.
Retest & Buy Zone: Price has broken above a key level and is now retesting it, indicating a potential buy opportunity.
Resistance Zone: A key resistance zone is marked near $2,557.71.
Target Levels: The first target is set at $2,557.71, with a possible further extension to $2,854.38.
Bullish Confirmation: If ETH maintains support above $1,981, the uptrend towards the target is likely.
Trading Idea:
Entry: Buy on successful retest.
Stop Loss: Below the strong level at $1,905 - $1,792.
Take Profit: First target at $2,557.71, extended target at $2,854.38.
This setup follows a classic breakout and retest strategy, suggesting bullish momentum if Ethereum sustains above key levels.

Ethereum Analysis Ethereum Analysis
Ethereum is currently exhibiting a pattern similar to the one observed in Shiba Inu, with a clear downtrend that has led to the breakdown of a key support level. As of now, it seems to be retesting this broken support, though confirmation will only be possible once the current candle closes.
In my opinion, patience is critical in this scenario, and it would be wise to wait for the candle to close before considering any short positions. The broader trend still appears to be bearish, suggesting that Ethereum may not have exhausted its downward momentum just yet. However, market dynamics can shift rapidly, and it is important to remain vigilant and adapt to new information as it unfolds.
I would appreciate your thoughts on Ethereum's current price action and whether you agree with the assessment of a potential continuation of the downtrend. As always, thorough analysis, risk management, and due diligence are essential before making any trading decisions.
Cheers!

ETHEREUMUSDT | Risky Hedge ShortIn our previous ETHUSDT analysis, we mentioned the importance of the $4102 level and the possibility that our rapid entry into the range with its manipulation could lead to bad possibilities.
The price has entered the range again and continues to fall, but it is not nice that the liquidity remaining above is very open. Still, taking a short hedge is not a bad trade by taking the possibility of a losing 1R from here.
I keep my charts clean and simple because I believe clarity leads to better decisions.
My approach is built on years of experience and a solid track record. I don’t claim to know it all, but I’m confident in my ability to spot high-probability setups.
My Previous Analysis
🐶 DOGEUSDT.P: Next Move
🎨 RENDERUSDT.P: Opportunity of the Month
💎 ETHUSDT.P: Where to Retrace
🟢 BNBUSDT.P: Potential Surge
📊 BTC Dominance: Reaction Zone
🌊 WAVESUSDT.P: Demand Zone Potential
🟣 UNIUSDT.P: Long-Term Trade
🔵 XRPUSDT.P: Entry Zones
🔗 LINKUSDT.P: Follow The River
📈 BTCUSDT.P: Two Key Demand Zones
🟩 POLUSDT: Bullish Momentum
🌟 PENDLEUSDT.P: Where Opportunity Meets Precision
🔥 BTCUSDT.P: Liquidation of Highly Leveraged Longs
🌊 SOLUSDT.P: SOL's Dip - Your Opportunity
🐸 1000PEPEUSDT.P: Prime Bounce Zone Unlocked
🚀 ETHUSDT.P: Set to Explode - Don't Miss This Game Changer
🤖 IQUSDT: Smart Plan
⚡️ PONDUSDT: A Trade Not Taken Is Better Than a Losing One
💼 STMXUSDT: 2 Buying Areas
🐢 TURBOUSDT: Buy Zones and Buyer Presence
🌍 ICPUSDT.P: Massive Upside Potential | Check the Trade Update For Seeing Results
🟠 IDEXUSDT: Spot Buy Area | %26 Profit if You Trade with MSB
📌 USUALUSDT: Buyers Are Active

ETH/USD "ETHEREUM" Crypto Market Heist Plan on Bullish SideHi there! Dear Money Makers & Robbers, 🤑 💰
Based on Thief Trading style technical analysis, here is our master plan to heist the ETH/USD "ETHEREUM" Cryptocurrency market. Please adhere to the strategy I've outlined in the chart, which emphasizes long entry. Our aim is the high-risk Red Zone. Risky level, overbought market, consolidation, trend reversal, trap at the level where traders and bearish robbers are stronger. So Be Careful, wealthy and safe trade.
Entry 📈: Acceptable anywhere; I advise placing buy limit orders within a 15-minute Chart. The entry for the Recent/Nearest Low Point should be in pullback.
Stop Loss 🛑: Using the 4H period, the recent swing low
Goal 🎯: 4600.0
Scalpers, take note: only scalp on the long side. If you have a lot of money, you can go straight away; if not, you can join swing traders and carry out the robbery plan. Use trailing SL to safeguard your money 💰.
Warning : Our heist strategy is incompatible with Fundamental Analysis news 📰 🗞️. We'll wreck our plan by smashing the Stop Loss 🚫🚏. Avoid entering the market right after the news release.
Take advantage of the target and get away 🎯 Swing Traders Please reserve the half amount of money and watch for the next dynamic level or order block breakout. Once it is resolved, we can go on to the next new target in our heist plan.
💖Supporting our robbery plan will enable us to effortlessly make and steal money 💰💵 Tell your friends and family to follow, like, and share. Boost the strength of our robbery team. Every day in this market make money with ease by using the Thief Trading Style.
I'll see you soon with another heist plan, so stay tuned 🫂

Like altseason arrived: ETH follows bullish chart patternsHello,
Like altseason arrived, Ethereum established a bullish trend in the green channel. Furthermore, the price has been in the consolidation of a symmetrical triangle (green triangle), which seemingly broke upward. The bullish channel and the symmetrical triangle indicate the optimal risk-reward ratio for a long position. If the break isn't a bull trap, ETH might continue going up until the $4500 psychological resistance, which aligns with the top of the channel. Breaking the channel upward could send ETH to $5300.
Following a bearish scenario, ETH might be rejected from the current price (top of the triangle), in which case, it might find support at $3400 - the middle of the channel.
Regards,
Ely

Healthy growth on EthereumEthereum is in an uptrend according to the Exponential Moving Averages (EMAs), but more importantly, the current price ($3700) is about EMA 20. Buying Ethereum at an average price has a positive risk-reward ratio. In a bearish scenario, ETH could bounce from EMA 200 ($3350) at the latest and still maintain a bullish trend. Anything below EMA 200 would have a bearish indication. If the current bullish trend persists, Ethereum eyes the $4000 psychological resistance.

ETH will push to demand zoneEthereum will push to demand zone soon around 2800-2850$.
Then we have a fuel to run to 4000$ in first push.
Then 5200$.
Be ready and don't get shaken out.
PS: Don't worry, ethereum is not dead. Many L1 altcoins are sleeping right now for example AVAX and BNB.

Is there hope for ETH to recover?ETH trades around $2.3k, just below 4HR 50MA, after facing resistance around $2.4k. Failing to create HHs could signal lower prices with the first bearish target being $2k - $2.1k. Closing above $2.4k would signal a shift in sentiment or momentum.

ETH target over 100001D time frame
-
TP: $7306 / $10,000
-
(1) $2100 is the best entry if fell again
(2) ETH is running Elliott Impulse Wave, and just completed the 1st and 2nd wave
(3) 3rd wave will come around 9/E, and reach its high in Jan ~ March 2025
(4) The low of 4th wave can be seen in April ~ June 2025
(5) The high of 5th wave can be seen in Oct ~ Nov 2025
(6) Keep being patient

Cryptolean Ethereum ETH UpdateDaily Chart
Ethereum is trading in the bearish territory in the daily chart.
It is having a rangebound price action between the key resistance zone around $3,409 (marked in grey) and a minor support at $3,200.
Below $3,409 resistance, there is a high probability for a dip towards the key daily support zone of $2,781-$2,956.
The price action with this zone will be very important and, most likely, will result in a bullish rejection of this zone.
A bullish break-out of $3,409 will push ETH price into the daily range zone where we will see slow and choppy price action, first towards $3,600 and, likely, higher to $3,793.
Ethereum will become bullish in the daily chart only upon a sustained price action above $3,793.
In this case, bulls will take control of the daily chart and send price higher towards $4,246-$4,421, the next daily target .
Boost once read!
Thank you.

ETHUSDPair : ETHUSD ( Ethereum / U.S Dollar )
Description :
Completed " 1234 " Impulsive Waves and Rejecting from Daily Demand Zone or Fibonacci Level - 38.20%. Break of Structure and Completed the Retracement. Break out of Upper Trend Line of Consolidation Phase to make Fake Breakout. Strong Divergence in RSI

ETH → Ethereum Reversal? This Trade Setup Takes Advantage.Ethereum has shown great signs of bull strength as Bitcoin and the crypto market burn hot into this bull run. The time for entering longs on the higher timeframes has likely come to an end. So is it time to short?
How do we trade this? 🤔
ETH does not have any sell signals yet, but we did just break into a major resistance area at $2,500. With four pushes up, Bitcoin near a strong resistance area as well ($46,000-$48,000), it's reasonable to start looking for counter-trend trades. I believe there is a short opportunity just below $2,500 down to the Daily 30EMA or the previous Support Zone.
To justify this trade, we need a strong sell signal in the current price range around $2,600. Once the $2,500 price area is broken, a potential test of that area should once again fail and give us a confirmation bar closing on or near its low. At this time, It will be reasonable to short scalp ETH at a 1:1 Risk/Reward Ratio.
💡 Trade Idea 💡
Short Entry: $2,500
🟥 Stop Loss: $2,740
✅ Take Profit: $2,300
⚖️ Risk/Reward Ratio: 1:1
🔑 Key Takeaways 🔑
1. Four Pushes up from Breakout.
2. Entered Major Resistance Level.
3. Short Resistance Level with Proper Bear Signal.
4. RSI at 70.00 and above Moving Average, Supports Short.
5. Watch Bitcoins Response to Current Price Area.
💰 Trading Tip 💰
Never enter a counter-trend trade without the proper signal *and* confirmation. A signal bar will usually have a long wick, and a confirmation bar will follow shortly after the signal bar and have a strong body closing on or near its low or high (bear or bull).
⚠️ Risk Warning! ⚠️
Past performance is not necessarily indicative of future results. You are solely responsible for your trades. Trade at your own risk!
Like 👍 and comment if you found this analysis useful!

ETH → Ascending Wedge, Double Top, About to Drop!? Let's Answer.Ethereum has a string of reversal indications that give us a picture of bearish price action. Are these data points enough to enter a short?
How do we trade this? 🤔
Three pushes up, an ascending wedge, and strong resistance alone is not enough justification to enter a reversal trade unless you fade your position (small entries until the reversal happens). It's better to wait for a strong bear bar closing on or near its low below the 30EMA to provide enough probability to justify a reversal trade. If the price breaks below the Daily 30EMA and closes a candle with followthrough or a re-test of the 30EMA as resistance, a short entry is justified.
Alternatively, if we find support at the 30EMA or get a strong bull bar closing near it's high, it's reasonable to think the price will hit the next resistance target of $2520.00. I would trade small on any long position this late in the trend as it's more likely we're about to enter a trading range or major pullback.
💡 Trade Ideas 💡
Short Entry: $2,150.00
🟥 Stop Loss: $2,250.00
✅ Take Profit: $1,950.00
⚖️ Risk/Reward Ratio: 1:2
Long Entry: $2,250.00
🟥 Stop Loss: $2,150.00
✅ Take Profit: $2,450.00
⚖️ Risk/Reward Ratio: 1:2
🔑 Key Takeaways 🔑
1. Three Pushes up in Bull Trend.
2. Formed Ascending Wedge, Price Fell Out.
3. Potential Double Top, Wait for Break Below 30EMA to Short.
4. If Bounce at Support, Reasonable to Long to Next Resistance.
5. RSI at 55.00 below Moving Average, Indecision.
💰 Trading Tip 💰
Three pushes up, an ascending wedge, and strong resistance alone is not enough justification to enter a reversal trade unless you fade your position (small entries until the reversal happens). It's better to wait for a strong bear bar closing on or near its low below the 30EMA to provide enough probability to justify a reversal trade. Your probability is still inherently low, but catching a trend when it starts gives you more room for reward, that's the tradeoff.
⚠️ Risk Warning! ⚠️
Past performance is not necessarily indicative of future results. You are solely responsible for your trades. Trade at your own risk!
Like 👍 and comment if you found this analysis useful!

3day stophunt currently on ETHETHUSD is currently flipping back and forth with a 3-day stop hunt. Could see some pullbacks in the near term.
I had mentioned looking for new 3-day dips for opportunities.
Would want to watch 1H and 4H moving averages to hold up for continuation—mainly the 100 and 200 Moving averages.
$2312 and $2275 Could be potential BUYS (Risky knife catch buys); want to see strong reversals from these areas for continuation.
I'm still BULLISH on the near-term, Santa rally:)
Thanks for your time please follow me here for more ideas. Feel free to message me with specific chart requests.
**Not financial advice, just my 2cents

Bullish Surge: BTC and ETH Soar with Inverse Head and Shoulders!Bitcoin (BTC) is looking positive today, thanks to the emergence of an inverse head and shoulders pattern. The successful rebound from the 29,500 USD resistance level indicates a robust pattern in full swing, setting the technical target at approximately 30,630 USD.
Remarkably, Ethereum (ETH) is also displaying a similar pattern on its chart, signaling a potential boost for ETH in the short term. This bullish setup suggests favorable price movements for both BTC and ETH, creating enticing opportunities for traders and investors. The target for the inverse head and shoulders pattern in ETH is expected to be around the 1954 mark.

Ethereum is Almost Bullish
ETH is lagging behind Bitcoin. However, there is some room for optimism, especially if ETH can push up above the 50D EMA and provide a ChoCh.
ATM, ETH is oversold on the 1-4 Hour timeframes, but the HTF still have ample capacity for price appreciation.
Also, there is no bearish divergence that I can see.
Presently, ETH’s price is at 1812 USD close to the 50D EMA and the Fixed Range Volume PoC.
My best case for ETH is another push up and then a pullback.
The most likely outcome, IMO is that will pullback without any significant PA, and shoot for higher when Bitcoin does. However, if BTC keeps blasting through the levels, ETH will most likely follow.
Personally, I don’t see a long trade yet. If anything, I am tempted to short.

#Ethereum Uptrend Remains but Price Must Break Above $1,950Past Performance of Ethereum
Ethereum prices, like BTC, are firm at spot rates. Notably, there is a sharp reversion from critical reaction levels, marking resistance levels of March 2023 and September 2022. For now, whether ETH buyers will build on yesterday's gains remains to be seen. However, any attempt to unwind losses will be massively bullish for ETH, that's overly in an uptrend formation.
#Ethereum Technical Analysis
ETH remains bullish, up 36% from March lows and 72% from December 2022 lows. Despite the contraction from April peaks, the uptrend remains and will be confirmed if ETH floats above $2.1k in the days ahead. Ideally, a break above the high of the anchor bear bar of April 21 at HKEX:1 ,950 is critical. This will cancel out bears that are currently in control from an effort-versus-result perspective. On the other hand, traders can wait for a deep below HKEX:1 ,800. In that case, ETH may drop to HKEX:1 ,700 in continuation of April 19 and 21 bear bars.
What to Expect from #ETH?
Technically, ETH buyers have the upper hand. All the same, the coin is trading at below critical reaction levels, especially $2k. The middle BB, or the 20-day moving average, is also an important resistance level. Losses below HKEX:1 ,800 in the near term may trigger more losses in the days ahead.
Resistance level to watch out for: HKEX:1 ,950
Support level to watch out for: HKEX:1 ,800
Disclaimer: Opinions expressed are not investment advice. Do your research.
