Ethereum idea and signalhi dear traders, I'm sorry, I wasn't with you for a while!
Internet problems in my country have also caused problems in my job.
In any case, I'm here now!
Ethereum has a sinusoidal movement, with a return price to the price range late the previous week.
------------------------------
✅ ✅ Risk warning, disclaimer: the above is a personal market judgment and analysis based on published information and historical chart data on The trading view,
And only some of these analyzes are my actual real trades.
I hope Traders consider I am Not responsible for your trades and investment decision.
------------------------------
✅ Please write any advice or suggestions.
Dear friends request any cryptocurrency pair, currencies pair for forex, and any index you want to be analyzed, and ask any questions about chart analysis.
Thanks for your attention
Ethereumsignals

Ethereum ( ETHUSDT ) forecast and idea.Hi crypto traders!
My view for Ethereum is, With or Without correction, we have a bullish trend.
------------------------------
✅ ✅ Risk warning, disclaimer: the above is a personal market judgment and analysis based on published information and historical chart data on The trading view,
And only some of these analyzes are my actual real trades.
I hope Traders consider I am Not responsible for your trades and investment decision.
------------------------------
✅ Please write any advice or suggestions.
Dear friends, request any cryptocurrency pair, currencies pair for forex, and any index that you want to be analyzed, and ask any questions about chart analysis.
Thanks for your attention

Ethereum held support, new leg up is probable (2.5k in mid term)As I said several times in my recent Eth analysis, the 1250-1300 zone is a very important support for this coin and, in order for bulls to hope for a reversal, this level is imperative to hold.
So far, so good...after a few days of flirting with this zone, the price reversed strongly and now is trading close to the 1400 figure which can be an indication that indeed, support held, a higher low is in place and bulls can soon take control.
I expect a continuation to the upside from Eth and 1750 and 2k could be reasonable targets in the next weeks.
Going further, a break above the recent 2k high could lead to more gains towards the very important 2.5k zone.
Buy dips as long as 1250 is intact can be a good strategy with great R: R

Ethereum forecast and idea 🧐Hi traders,
⭐ This one without explanation! 🤓
------------------------------
✅ ✅ Risk warning, disclaimer: the above is a personal market judgment and analysis based on published information and historical chart data on The trading view,
And only some of these analyzes are my actual real trades.
I hope Traders consider I am Not responsible for your trades and investment decision.
------------------------------
✅ Please write any advice or suggestions.
Dear friends, request any cryptocurrency pair, currencies pair for forex, and any index that you want to be analyzed, and ask any questions about chart analysis.
Thanks for your attention

Ethereum Options Idea for 23rd September 2022Since Ethereum has a immediate resistance level at 1580-1600 and immediate support level at 1300-1350, I thought of taking a trade in options by selling Call and Put at 1580 and 1350 levels respectively for an expiry on 23rd September.
I would keep a close eye on the FOMC meeting on the 21st, If i manage to get enough premium before the FOMC meeting, then I might as well cut my position.
Note: Options can be used when Ethereum is not moving in either direction.

Ethereum forecast and signalPlease write any advice or suggestions.
Dear friends, request any cryptocurrency pair, currencies pair for forex, and any index that you want to be analyzed and ask any questions.
Thanks for your attention
Ethereum vs Tether ETHUSD/ ETHUSDT
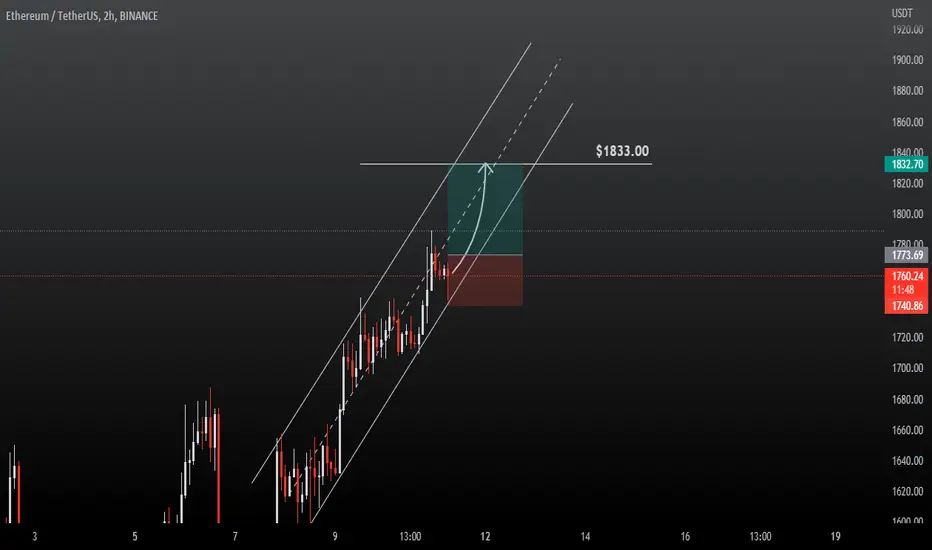
Ethereum analysis and signal!Hey dear traders!
A simple and easy trade signal for Ethereum, in short term.
I will let you know the opening and closing times of my Trade.
in case of canceling this setup, I will quickly inform you in the comments.
---------------------------------------------------------
Ethereum.
Please write any advice or suggestions.
Dear friends, request any cryptocurrency pair, currencies pair for forex, and any index that you want to be analyzed and ask any questions.
Thanks for your attention

ETHEREUM is on to something. 1D & 4H analysis on KuCoin exchange*** ***
For this particular analysis on Ethereum we are using the ETHUSDT symbol on the KuCoin exchange.
*** ***
The idea is on both the 1D and 4H time-frames where ETH recently broke above a 3 week bearish pattern and turned sideways. This consolidation is more accurately depicted on the 1D time-frame (chart on the left) where you can see the price trading sideways within the 1D MA50 (blue trend-line) and the 1D MA100 (green trend-line) since August 30. Both got successfully tested once so far as Resistance and Support respectively. A break and candle close above the 1D MA50 should be taken as a break-out buy signal towards the 2030 Resistance and possibly the 1D MA200 (orange trend-line) at the time. A break below the 1D MA100, should be taken as a short-term sell signal towards the lower Fibonacci level (0), practically the Higher Lows trend-line since the June 18 Low.
The 4H time-frame (chart on the right) shows more clearly the break-out from the Bearish trend since the August 14 High into the recent consolidation. Once the price broke above the Lower Highs trend-line it broke also above the 4H MA100 (green trend-line) and turned the 4H MA50 (blue trend-line) into the Support, which is significant. What's left, is a break and closing above the 4H MA200 (orange trend-line), which has been the rejection point on August 25 and also has a Lower Highs trend-line (dotted one) involved that needs to break.
We have to give the bullish sentiment on edge at the moment as the MACD on the 1D time-frame just did a Bullish Cross. A few more days into it so it clearly forms and then we can have more on ETH but the last fully formed 1D MACD Bullish Cross was on June 23, straight after the Low, at the beginning of this 2-month rally.
--------------------------------------------------------------------------------------------------------
** Please support this idea with your likes and comments, it is the best way to keep it relevant and support me. **
--------------------------------------------------------------------------------------------------------

Ethereum forecast and signalPlease write any advice or suggestions.
Dear friends, request any cryptocurrency pair, currencies pair for forex, and any index that you want to be analyzed and ask any questions.
Thanks for your attention
---------------------------------------------------------
Ethereum vs Tether

Ethereum forecast and ideaPlease write any advice or suggestions.
Dear friends, request any cryptocurrency pair, currencies pair for forex, and any index that you want to be analyzed and ask any questions.
Thanks for your attention

Ethereum shortEthereum broke trough the support level. Asset broke trough the ascending trendline. Bearish movement to support level at 1500 is possible.

ETHUSD Needs to break above this level otherwise dump possibleEthereum (ETHUSD) has been trading within a long-term Channel Down since the November 10 2021 High. In recent weeks though, since the July 13 2022 Low, the price has made an aggressive run of +100%, pushed by the late bullish fundamentals. We clearly showed that bullish potential on our last ETH analysis a month ago:
That rise is starting to show some indicators that the rally may be over. It is not just the fact that it hit the 0.786 Fibonacci retracement level and started pulling back (same was done on 0.618 and 0.6 anyway) or the 1D MA200 (orange trend-line) being just above near the Channel's Lower Highs (top) trend-line, but more importantly the 1D RSI trading sideways sine July 18 and being rejected inside the overbought Resistance Zone on August 13. The other three times that this has happened in the last 12 months, lower values followed. Especially within the Channel Down, that marked the start of selling sequences to new Lower Lows.
Last time in particular (April 03 2022), ETH was also rejected on the 1D MA200, exactly on the Lower Highs trend-line of the Channel Down. As a result, breaking this shouldn't be enough to restore the long-term bullish trend. What may be enough on the other hand is a break above the 1D MA500 (yellow trend-line), which has been acting as a pivot through these past years, first supporting the price from January to March 2022 and now posing as the Resistance.
As a result, for long-term ETHUSD traders, it may be a good idea to take the huge profit if you opened the buy on time as we suggested and either go for the price that a new potential sell-off may lead to or buy when the 1D MA500 breaks.
--------------------------------------------------------------------------------------------------------
** Please support this idea with your likes and comments, it is the best way to keep it relevant and support me. **
--------------------------------------------------------------------------------------------------------

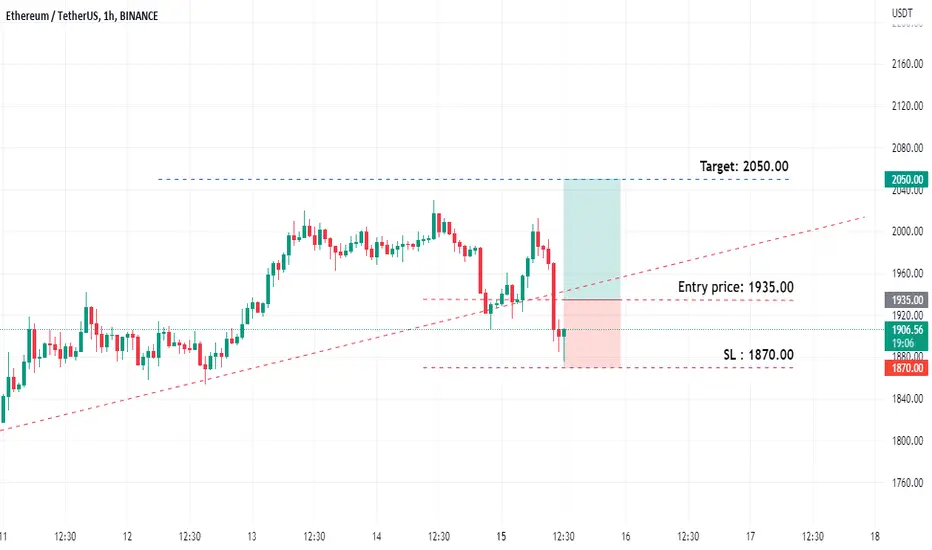
Ethereum forecast and signalPlease pay attention!
First: Trades have a time term , and in this case, it's from now until the next 11 hours. (You can also see it in the diagram)
Second: You can see the entry price in the chart.
So for this one, the trade is activated when the price reaches and crosses $1935 (USDT)
Before the price crosses the mentioned place, the trade position is not active
----------------------------------------------
Please write any advice or suggestions.
Dear friends, request any cryptocurrency pair, currencies pair for forex, and any index that you want to be analyzed and ask any questions.
Thanks for your attention
Ethereum Forecast update | signalPlease write any advice or suggestions.
Dear friends, request any cryptocurrency pair, currencies pair for forex, and any index that you want to be analyzed and ask any questions.
Thanks for your attention

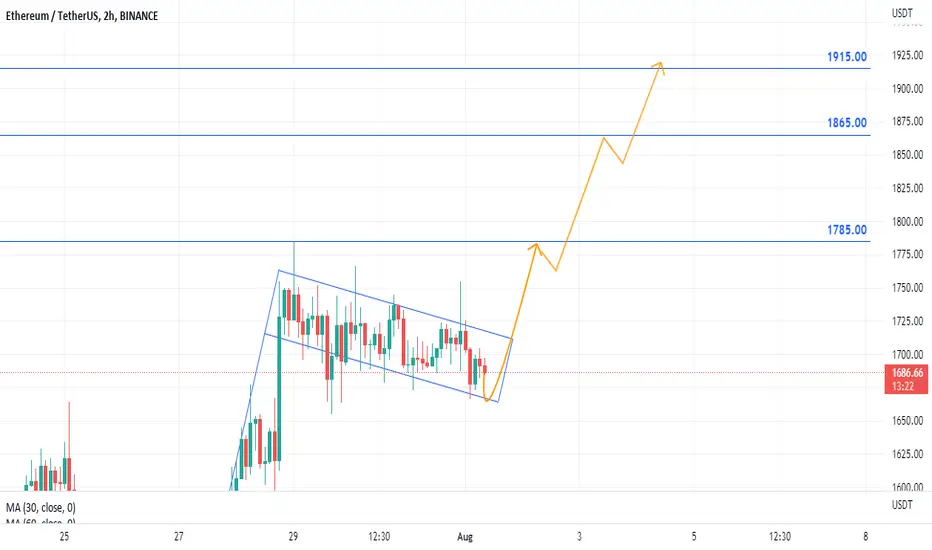
Ethereum Usdt idea/ forecast | simple signalA simple bullish trend after breaking the flag resistance line
Trading opportunity for ETHUSDT - EthereumBased on technical factors there is a short position in :
📊 ETHUSDT Ethereum
🔴 Short Now 1526.10
🧯 Stop loss 1650.00
🏹 Target 1 1350.00
🏹 Target 2 1200.00
🏹 Target 3 950.00
💸Capital : 1%
We hope it is profitable for you ❤️
Please support our activity with your likes👍 and comments📝

ETHEREUM Comfortably above the 1D MA50. Aiming at $2200.Ethereum (ETHUSD) is currently on a minor three day pull-back following the emphatic break above the 1D MA50 (blue trend-line). The stop/ rejection of that break came exactly on the 0.5 Fibonacci retracement level, which is the middle of the long-term Channel Down pattern that ETH has been trading in since the November 10 2021 All Time High (ATH). Don't forget, keep an even longer-term perspective if you want to have a clearer outlook of where we are in the market relative to past Cycles. This is something we've outlined a month ago when ETH was testing its Parabolic Growth curve, giving a buy signal:
On the shorter term and 1D time-frame, we have to consider the RSI Resistance Zone involved, which may be an additional reason for this profit-taking we're experiencing after the 1D MA50 break-out. However this doesn't mean that buyers have to leave the market as, as you see, all prior RSI Resistance tests, still gave (in some instances rather big) bullish extensions (the green Channels on the chart), before dropping evidently.
As you see, a similar extension to late October/ early November 2021 would push the price exactly at the top of the Channel Down, right on the 1D MA200 (orange trend-line), which provided the last big rejection of the pattern on April 05. This extension (March 28 - April 05 2022) was the smallest of the group, while the biggest was August 2021.
This detailed chart shows how to act accordingly and close/ open trades within the Fibonacci levels, but always keep a long-term cyclical perspective as well.
--------------------------------------------------------------------------------------------------------
Please like, subscribe and share your ideas and charts with the community!
--------------------------------------------------------------------------------------------------------

ETHUSDT - Bear Flag (4H)ETH looks like it is printing a head and shoulders on the 4H and 1D charts.
Careful with your longs here. The neckline sits at $1,045, once that breaks we're going to retest $880.

ETHUSD On the lowest 1W RSI ever testing the Growth Curve!Ethereum (ETHUSD) broke this week (chart on 1W time-frame) below its 1W MA200 (orange trend-line) for the first time since October 2020. The 1W RSI hit the lowest level ever recorded in ETH's history and by doing so, the price hit its Logarithmic Growth Curve (dashed line).
All this paint the picture of a strong Support Zone. However, there is a certain condition from Ethereum's last Bear Cycle that hasn't yet been fulfilled and that is touching the 0.5 Fibonacci retracement level from the moment the Parabolic Rally (green Channel Up) started. In December 2018 that was where the Bottom was formed. That parameter is now around $625. Interestingly enough it is exactly where the 5 year Higher Lows trend-line is. If the Growth Curve breaks, it is very likely to see the final bottom there.
Do you think the historically oversold 1W RSI is enough to accumulate buyers and prevent this?
--------------------------------------------------------------------------------------------------------
Please like, subscribe and share your ideas and charts with the community!
--------------------------------------------------------------------------------------------------------

ETH Update - Next Target @ $1,600The 4 Hour chart is over bought.
Momentum is dying and it looks like ETH will be on its way down soon.
Opening longs here might not be the best idea while inside this bear flag / pennant however you want to look at it.
Small bounce expected once it hits #5.
Entry Between:
$2,053 - 1934.36
Take Profit:
TP 1 - $1,792.41
TP 2 - $1,613.06
Stop Loss:
$2122.11
If you'd like me to analyse any other crypto send me a message or leave a comment 👍🏽
Happy trading!
Not Financial Advise. Do Your Own Research.

Ethereum : Ready to for a breakout or breakdown weekAfter consolidating below $2000 , ethereum is getting close to another breaking point. In coming week we might see a breakout or break down . long term position entries are already taken in ethereum with last entry at 1800. The initial target I am targeting is $3000 for long term. In coming week my idea is that if the price goes down it may test the support of 1800 once again.
If you like this or if you think the opposite of this or if there is any other opinion, mention it in the comments. I am open to all kind of suggestions and critics

ETH - 4 Hour looks like a trap!Bear Flag + Pennant + H&S
Looks like a trap!
Short entry point and take profits are marked on the chart.
What are your thoughts on this?

ETHUSDT Channel patterns with clear Resistance levels.*** ***
For this unique analysis on ETHEREUM we are using the ETHUSDT symbol on the Phemex exchange.
*** ***
The idea is on the 1D time-frame, with the RSI being on the 1W for reasons we'll explain later. As you see, the dominant pattern since the January 24 market bottom, has been a Channel Up. Since the April 03 Higher High, the corrective wave towards the Channel's bottom, has turned into a Channel Down (yellow pattern). Right now this pattern has come to its closest to the Channel Up Higher Lows (bottom) trend-line since February 24.
The price has to overcome the Resistance levels of the 1D MA50 (blue trend-line) and the 1D MA200 (orange trend-line) but the current trading level appears to be the best buy opportunity since March 13. Technically, the next Higher High could be on the 0.618 Fibonacci retracement zone since Ethereum's All Time High (ATH). Interestingly enough, the previous two Higher Highs have been just above the 0.382 an 0.5 Fib retracement levels, so 0.618 as the next Higher High comes as a natural progression. Notice how the application of the Fibonacci Channel extension levels, charts perfectly a path to the ATH, which can be on the 1.5 Channel Fib extension.
Another interesting aspect, is how similar the current sequence on the RSI (1W time-frame as mentioned) is with the pattern of September 2021. That fractal was also a Channel Down corrective wave and when the 1W RSI bounced on its MA (yellow trend-line on the bottom pane), the price started an aggressive rally. We are expecting a similar development, unless the Channel Up breaks below its Higher Lows. In that case, we could see a test of the 2166 Support level.
--------------------------------------------------------------------------------------------------------
** Please support this idea with your likes and comments, it is the best way to keep it relevant and support me. **
--------------------------------------------------------------------------------------------------------
