Ethereum m00nEthereum has broken above 1.618 fib level within the circle
It also seemed to form a flag and has broken up out of that
This is the weekly chart
I expect it to outperform BTC
Ethereumusd

ETHUSDT Resistance BreakoutETHUSDT (1H Chart) Technical Analysis Update
Resistance breakout
ETH/USDT currently trading at $2200
Buy-level: Above $$2205 (only buy if 1h candle closes above the resistance line)
Stop loss: Below $2140
Target 1: $2260
Target 2: $2300
Target 3: $2500
Max Leverage: 4X
ALWAYS KEEP STOP LOSS...
Follow Our Tradingview Account for More Technical Analysis Updates, | Like, Share and Comment Your thoughts.

ETH Buy a break setup.ETHUSDT - Intraday - We look to Buy a break of 2041.8 (stop at 1994.4)
The primary trend remains bullish.
Pivot resistance is at 2040.
A break of bespoke resistance at 2040, and the move higher is already underway.
20 4hour EMA is at 2032.
Expect trading to remain mixed and volatile.
Our profit targets will be 2178.4 and 2222.4
Resistance: 2040.0 / 2080.0 / 2150.0
Support: 1980.0 / 1930.0 / 1880.0

ETH bound for $2,500 despite the struggle sustaining uptrend
Ethereum holds at the key ascending parallel channel's middle boundary support.
Holding above the 50 SMA on the four-hour chart could validate the gains to a new record high.
Losing the immediate support at $2,000 could trigger losses toward $1,800.
Ethereum led other altcoins to stage a recovery this week. For the first time in history, the gigantic smart contract token hit highs of $2,146. However, a correction occurred almost immediately, with Ether plunging to $1,930. Intriguingly, buyers wasted no time and took the bull by the horns. The hiccup to $1,930 was quickly erased as ETH reclaimed the ground above $2,000.
At the time of writing, Ethereum is doddering at $2,075 amid the bulls' push to hit new record highs. The immediate downside is supported by the 50 Simple Moving Average (SMA) on the four-hour chart. Simultaneously, the downside is also protected by the ascending channel's middle boundary support.
Ethereum's uptrend might be gradual but appears to have been reinforced by the Moving Average Convergence Divergence (MACD) indicator. This technical indicator reveals when to long or short an asset. As the MACD line (blue) crosses above the signal line, it implies it is time to buy-in. On the flip side, investors are advised to sell when the MACD line slides under the signal line.
It is worth keeping in mind that failure to close the day above the 50 SMA may see overhead pressure rise. Moreover, a break below the channel's middle boundary and, by extension, the level at $2,000 would trigger massive sell orders, leaving Ethereum to tumble toward $1,800.
Ethereum intraday levels
Spot rate: $2,075
Trend: Bullish
Volatility: Low
Support: $50 SMA and $2,000
Resistance: $2,100 and $2,146


ETH confidently matches toward new record highs
Ethereum extends the journey above $2,000, eyeing another all-time high around $2,500.
The trend is in the bull's hands, especially with the MACD line crossing above the signal line.
Ethereum has been defying apparent gravitational force to post new all-time highs above $2,000. The flagship altcoin ignored a double-bottom pattern explored last week, paving the way for the majestic rise. Ether has brushed shoulders with $2,150 before retreating to test support at $2,000. At the time of writing, ETH has renewed the upswing and is moving forward in a bid to trade a new all-time high, preferably above $2,500.
In the meantime, Ether changes hands at $2,127 while bulls battle the resistance at the ascending parallel channel's middle boundary. A break above this level would bolster Ethereum significantly upward.
The bullish outlook has been validated by the Moving Average Convergence Divergence (MACD) indicator. This technical indicator follows the trend of an asset and measures its momentum. Traders utilize the MACD to spot prime positions to buy the dip and sell the top.
At the time of writing, the indicator has settled in the positive region. The MACD line (blue) is about to cross above the signal line. A move such as this would encourage bulls to come out the sidelines in anticipation of a breakout eyeing highs past $2,500.
Ethereum's uptrend seems strong enough to remain intact and hit a historical high. The gap made by the 50 Simple Moving Average (SMA) on the four-hour chart above the 100 SMA and the 200 SMA implies that the trend favors the bulls. Therefore, the least resistance path is upward.
Ethereum intraday levels
Spot rate: $2,130
Trend: Bullish
Volatility: High
Support: $2,000 and $1,800
Resistance: $2,200

💡Don't miss the great buy opportunity in ETHUSD Trading suggestion:
". There is a possibility of temporary retracement to suggested support line (2000).
. if so, traders can set orders based on Price Action and expect to reach short-term targets."
Technical analysis:
. ETHUSD is in a uptrend and the continuation of uptrend is expected.
. The price is above the 21-Day WEMA which acts as a dynamic support.
. The RSI is at 53.
Take Profits:
TP1= @ 2080
TP2= @ 2145
TP3= @ 2199
TP4= @ 2270
TP5= @ 2340
SL= Break below S2
❤️ If you find this helpful and want more FREE forecasts in TradingView
. . . . . Please show your support back,
. . . . . . . . Hit the 👍 LIKE button,
. . . . . . . . . . Drop some feedback below in the comment!
❤️ Your Support is very much 🙏 appreciated!❤️
💎 Want us to help you become a better Forex trader?
Now, It's your turn!
Be sure to leave a comment let us know how you see this opportunity and forecast.
Trade well, ❤️
ForecastCity English Support Team ❤️

💡Don't miss the great buy opportunity in ETHUSD Trading suggestion:
". There is a possibility of temporary retracement to suggested support line (2000).
. if so, traders can set orders based on Price Action and expect to reach short-term targets."
Technical analysis:
. ETHUSD is in a uptrend and the continuation of uptrend is expected.
. The price is above the 21-Day WEMA which acts as a dynamic support.
. The RSI is at 51.
Take Profits:
TP1= @ 2080
TP2= @ 2145
TP3= @ 2199
TP4= @ 2270
TP5= @ 2340
SL= Break below S2
❤️ If you find this helpful and want more FREE forecasts in TradingView
. . . . . Please show your support back,
. . . . . . . . Hit the 👍 LIKE button,
. . . . . . . . . . Drop some feedback below in the comment!
❤️ Your Support is very much 🙏 appreciated!❤️
💎 Want us to help you become a better Forex trader?
Now, It's your turn!
Be sure to leave a comment let us know how you see this opportunity and forecast.
Trade well, ❤️
ForecastCity English Support Team ❤️

ETH daily very good buyEthereum channel
sitting right above the middle
I think bullish momentum will push it higher
daily chart


Ethereum Possible Profit AreasIn blue and green triangle are suggested profit areas during this bull move on the weekly
Lets stay above 2K!

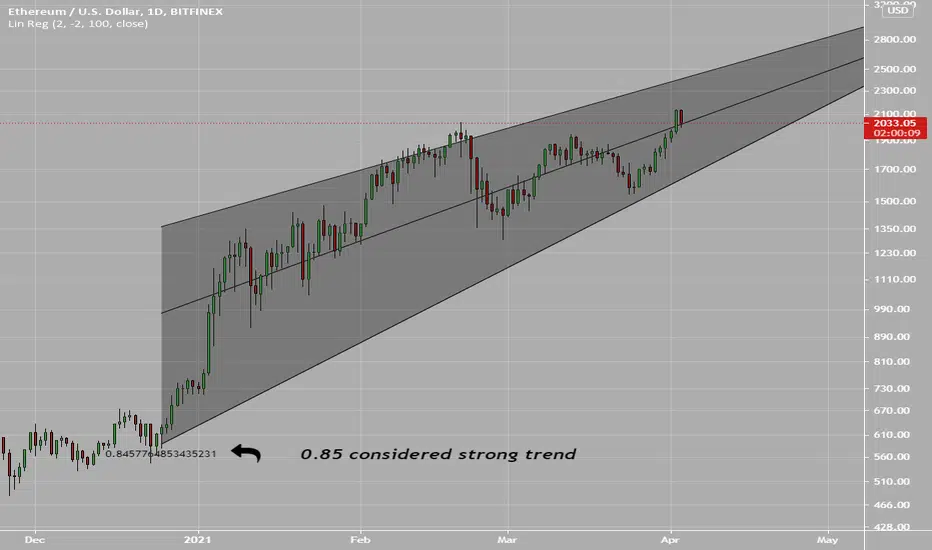
Ethereum Linear RegressionStrong uptrend
R value of 0.85
I hope the middle line holds, up continuation is favored
ETH About To Steal The Show Once Again? ETH Macro Cycle - A very interesting chart I made in 2020 last year., so far it's held up well. I personally believe this diagonal trend line is fairly important for the ETH market. I also believe we're in the 5th wave of this macro move that has been in the making since 2015. If you look really closely, you'll see that the diagonal line has served as major support or resistance since ETH's inception, very similar to Bitcoin. If we close above in the next few weeks/months, we could see explosive movement. I still believe the 5th wave we're on now, could go to $5K - $10k o a low end, and as high as $20K on a high end. Long story short, that line is potentially very important 😅
As always, stay unbiased, level-headed, and don't forget to look at the macro picture.

ETH/BTC ratio will determine what to be overweight/underweight ETH/BTC ratio is still consolidating after having a lower bound range breakout... previous price moves from these ratio levels have been significant and we should continue to keep an eye on the ETH/BTC chart to see if the ETH to BTC price continues the bullish breakout after a multi-year consolidation... I am personally bullish on both Bitcoin and Ethereum, but monitoring this ratio has helped me better allocate whether to be overweight/underweight BTC or ETH, especially during the bull cycle... I will update this idea as the price ratio decides the direction

ETH edges closer to $2,000 as crypto market uptrend renews
Ethereum restores the uptrend toward $2,000 after embracing support at $1,800.
ETH bulls look forward to price action past $2,000, which may trigger more buy orders.
A potential double-top pattern could sabotage the upswing, allowing a correction toward $1,550.
Ethereum managed to close the day above $1,800, confirming to investors that market stability was intact. A rebound was staged from this short-term support, with Ether stepping above $1,900. At the time of writing, the pioneer flagship cryptocurrency is doddering at $1,920 amid a bullish building momentum.
The four-hour chart shows that Ether is in the bulls' hands based on the Moving Average Convergence Divergence (MACD). This vital technical indicator follows the trend of an asset and measures its momentum.
A step into the positive region (above the mean line) is viewed as the asset flipping bullish. The bullish outlook is validated by the MACD line (blue) crossing above the signal line. At the time of writing, the MACD line increases the divergence, further cementing the bull's presence in the market.
Ethereum bulls must purposely close the day above $1,900 to avert any significant potential correction from the prevailing price levels. Moreover, higher support would allow bulls to focus on cracking the major hurdle at $2,000. Note that trading past this crucial could be yield tremendously for Ethereum due to the massive buy orders that are likely to be triggered.
Looking at the other side of the picture
The same four-hour chart shows that Ethereum is trading near a double-top pattern. This is a highly bearish pattern. If validated, ETH may breakdown massively, erasing most of the gains made since the beginning of the week. Note that, Ethereum may seek support at $1,800, $1,600 and the primary anchor at $1,550.
Ethereum intraday levels
Spot rate: $1,920
Trend: Bullish
Volatility: High
Support: $1,800 and $1,700
Resistance: $2,000


New ATH for ETH??!ETH has been performing very solid over the last few days, I'm looking for a close tonight above the 0.7 FIB level. If we do secure this level at daily close i think we will start to see a nice run upto our ATH and beyond! Even if we don't hold this level today my opinion stays the same just on a longer TF, also BTC is a factor. The MACD looks very good we flipped bullish recently and are begging to spread out! I think we are going to see a uptrend continuation on the RSI, we aren't quite in oversold areas yet and have room to push higher. Aswell the Stoch RSI is shooting up approaching the oversold zone but we could definitely see it hang around up there for a couple days. I expect April to be a strong month for crypto in general after a shaky march, we are about to enter historically one of the best months for BTC!

ETHUSDT about to re-test resistance area. Key 1,930 in play.Textbook pattern in play and price about to test resistance trend line.
Personally, the price I am watching is 1,930.


💡Don't miss the great buy opportunity in ETHUSDTrading suggestion:
". There is a possibility of temporary retracement to suggested support line (1731.90).
. if so, traders can set orders based on Price Action and expect to reach short-term targets."
Technical analysis:
. ETHUSD is in a range bound and the beginning of uptrend is expected.
. The price is above the 21-Day WEMA which acts as a dynamic support.
. The RSI is at 73.
Take Profits:
TP1= @ 1863.30
TP2= @ 1946.45
TP3= @ 2040. 40
TP4= @ 2217.00
TP5= @ 2375.50
SL= Break below S2
❤️ If you find this helpful and want more FREE forecasts in TradingView
. . . . . Please show your support back,
. . . . . . . . Hit the 👍 LIKE button,
. . . . . . . . . . Drop some feedback below in the comment!
❤️ Your Support is very much 🙏 appreciated!❤️
💎 Want us to help you become a better Forex trader?
Now, It's your turn!
Be sure to leave a comment let us know how you see this opportunity and forecast.
Trade well, ❤️
ForecastCity English Support Team ❤️

Ethereum closer lookSitting right above 2.618
Breakout likely within the structure formed
Just below the 50MA

Ethereum might bounceEthereum doesn't look nice with this double top formation
However the present of the 2.618 fib circle ring may allow for a bounce to occur
ETH/BTC also looks ready to push higher after just moving below a major trendline, signaling the upward move
