ETHUSDT.P | Where to Retrace ?I believe we will retrace there and come up. Let's what will next week show us.
Ethereumusd

Unpacking Ethereum's Surge: What's Driving the $3.3K Breakout?Ethereum, the second-largest cryptocurrency by market capitalization, has seen a remarkable surge in recent days, surpassing the $3,300 mark. This significant price increase has sparked widespread interest and speculation among analysts and investors alike.
What's Driving Ethereum's Rally?
Several factors are contributing to Ethereum's bullish momentum:
1. Anticipation for Shanghai Upgrade: The highly anticipated Shanghai upgrade, scheduled for early 2024, is expected to unlock staked ETH. This event could lead to increased market liquidity and potentially fuel further price appreciation.
2. Growing DeFi Ecosystem: Ethereum's robust decentralized finance (DeFi) ecosystem continues to expand, attracting a growing number of users and developers. As more applications and protocols are built on the Ethereum network, the demand for ETH is likely to increase.
3. Institutional Adoption: Institutional investors are increasingly recognizing the potential of Ethereum as a valuable asset. As more traditional financial institutions allocate capital to cryptocurrencies, Ethereum is likely to benefit from increased institutional demand.
4. Positive Market Sentiment: The overall positive sentiment in the cryptocurrency market, coupled with a broader economic recovery, has contributed to Ethereum's price surge.
A Ticking Time Bomb? Derivatives Metrics Explode to Record Highs
While Ethereum's price action has been impressive, some analysts are raising concerns about the potential risks associated with the growing derivatives market. Open interest in Ethereum futures and options has reached record highs, indicating significant speculative activity.
A sudden market downturn or liquidation event could trigger a cascade of liquidations, potentially leading to significant price volatility. Additionally, the increasing leverage employed by traders can amplify both gains and losses.
Analyst Perspectives
Analysts have offered diverse opinions on Ethereum's future trajectory:
• Bullish Outlook: Some analysts believe that Ethereum's long-term potential remains strong, driven by its robust fundamentals and growing ecosystem. They anticipate further price appreciation, especially as the Shanghai upgrade approaches.
• Cautious Optimism: Other analysts are more cautious, highlighting the risks associated with the derivatives market and the potential for a market correction. They suggest that investors should exercise prudence and manage their risk exposure.
The Road Ahead for Ethereum
Ethereum's future trajectory will depend on a variety of factors, including the success of the Shanghai upgrade, the overall health of the cryptocurrency market, and regulatory developments. While the recent price surge is undoubtedly exciting, it is essential to maintain a balanced perspective and be aware of the potential risks involved.
As Ethereum continues to evolve and mature, it will be interesting to see how it navigates the challenges and opportunities that lie ahead.

ETH will push to demand zoneEthereum will push to demand zone soon around 2800-2850$.
Then we have a fuel to run to 4000$ in first push.
Then 5200$.
Be ready and don't get shaken out.
PS: Don't worry, ethereum is not dead. Many L1 altcoins are sleeping right now for example AVAX and BNB.

THE NEXT CRYPTO TO MOVE BIG: ETHEREUM - 80% MOVE INBOUNDTHE NEXT CRYPTO TO MOVE BIG: CRYPTOCAP:ETH BITSTAMP:ETHUSD
Did you miss out on the Bitcoin move?
That's okay. Get into this laggard as they haven't moved big...yet! #Ethereum
In this video analysis, we will go over:
1⃣ My #HIGHFIVESETUP
2⃣ BULL FLAG BREAKOUT
3⃣ Trade idea
4⃣ ...
NFA
CRYPTOCAP:BTC #bitcoin

ETHEREUM (ETH) on the Rise! Key Targets Await on 1H ChartETHEREUM (ETH) Technical Analysis:
Ethereum (ETH) has confirmed a long entry at 2586.77 on the 1-hour timeframe, backed by bullish momentum and support from the Risological Dotted Trendline . The trade setup is promising, with well-defined targets positioned to capture potential gains as ETH continues its upward move.
Trade Summary:
Entry Level: 2586.77
Target Levels:
TP1: 2729.39
TP2: 2960.16
TP3: 3190.93
TP4: 3333.55
Stop Loss: 2471.39
With the entry level secured, Ethereum is primed to approach each target. Traders should monitor price action closely as ETH strives toward these lucrative levels.

Ethereum ethEthereum is a decentralized open-source blockchain system that features its own cryptocurrency, Ether. ETH works as a platform for numerous other cryptocurrencies, as well as for the execution of decentralized smart contracts.
pls check previous eth posts

ETH/USD "Ethereum" Market Money Heist Plan On Long SideHola ola My Dear,
Robbers / Money Makers & Losers, 🤑 💰
This is our master plan to Heist ETH/USD "Ethereum" market based on Thief Trading style Technical Analysis.. kindly please follow the plan I have mentioned in the chart focus on Long entry. Our target is Red Zone that is High risk Dangerous level, market is overbought / Consolidation / Trend Reversal / Trap at the level Bearish Robbers / Traders gain the strength. Be safe and be careful and Be rich.
Attention for Scalpers : If you've got a lot of money you can get out right away otherwise you can join with a swing trade robbers and continue the heist plan, Use Trailing SL to protect our money 💰.
Note: If you've got a lot of money you can get out right away otherwise you can join with a swing trade robbers and continue the heist plan, Use Trailing SL to protect our money.
Entry : Can be taken Anywhere, What I suggest you to Place Buy Limit Orders in 15mins Timeframe Recent / Nearest Swing Low
Stop Loss 🛑 : Recent Swing Low using 1H timeframe
Warning : Fundamental Analysis news 📰 🗞️ comes against our robbery plan. our plan will be ruined smash the Stop Loss. Don't Enter the market at the news update.
Loot and escape on the target 🎯 Swing Traders Plz Book the partial sum of money and wait for next breakout of dynamic level / Order block, Once it is cleared we can continue our heist plan to next new target.
Support our Robbery plan we can easily make money & take money 💰💵 Follow, Like & Share with your friends and Lovers. Make our Robbery Team Very Strong Join Ur hands with US. Loot Everything in this market everyday make money easily with Thief Trading Style.
Stay tuned with me and see you again with another Heist Plan..... 🫂

ETH (Crypto ETHEREUM) BUY TF H1 TP = 2391.45 On the H1 chart the trend started on Sept. 7 (linear regression channel).
There is a high probability of profit taking. Possible take profit level is 2391.45
Using a trailing stop is also a good idea!
Please leave your feedback, your opinion. I am very interested in it. Thank you!
Good luck!
Regards, WeBelievelnTrading

ETH (Crypto ETHEREUM-USD) BUY TF H4 TP = 3347On the H4 chart the trend started on Aug. 08 (linear regression channel).
There is a high probability of profit taking. Possible take profit level is 3347
Using a trailing stop is also a good idea!
Please leave your feedback, your opinion. I am very interested in it. Thank you!
Good luck!
Regards, WeBelievelnTrading

Will Ether Rebound After the August 7th Death Cross?Disclaimer: This article is intended for informational purposes only and should not be construed as financial advice. Cryptocurrencies are highly volatile assets, and investing in them carries significant risks.
On August 7th, 2023, Ethereum (ETH) experienced a death cross, a technical indicator where the 50-day Simple Moving Average (SMA) crosses below the 200-day SMA. Historically, this pattern has often signaled bearish trends, leading many investors to question the future trajectory of Ether.
Understanding the Death Cross
Before delving into the potential rebound, let's clarify what a death cross signifies. It is a technical analysis tool that suggests a potential downward price movement. However, it's essential to remember that it's not a definitive predictor of future price action. Market conditions, fundamental factors, and other technical indicators should be considered alongside the death cross.
Factors Influencing Ether's Recovery
Several factors could influence whether Ether can rebound from the August 7th death cross:
1. Market Sentiment: The overall cryptocurrency market sentiment plays a crucial role. If the broader market experiences a bullish trend, Ether might benefit from the positive momentum. Conversely, a prolonged bearish sentiment could hinder its recovery.
2. Regulatory Environment: Regulatory clarity and favorable policies can significantly impact cryptocurrency prices. Positive developments in the regulatory landscape could boost investor confidence and drive Ether's value upward.
3. Network Developments: Ethereum's network upgrades and advancements, such as the transition to proof-of-stake, can influence investor sentiment and demand for ETH. Positive developments in this area could support a price rebound.
4. Institutional Adoption: Growing institutional interest in Ethereum can provide price support and drive demand. Increased adoption by large financial institutions could contribute to a bullish trend.
5. Macroeconomic Factors: Global economic conditions, interest rates, and inflation can impact investor risk appetite and cryptocurrency prices. Favorable macroeconomic factors could create a positive environment for Ether's recovery.
Technical Analysis: Beyond the Death Cross
While the death cross is a notable technical indicator, it's essential to consider other technical analysis tools to assess Ether's potential rebound. These may include:
• Support and Resistance Levels: Identifying key support and resistance levels can help determine potential price targets for a rebound.
• Relative Strength Index (RSI): The RSI can indicate whether Ether is oversold, which could suggest a potential buying opportunity.
• Moving Average Convergence Divergence (MACD): The MACD can provide signals about changes in momentum, helping to identify potential trend reversals.
Cautious Optimism
It's important to approach any prediction about Ether's rebound with caution. The cryptocurrency market is highly volatile, and past performance is not indicative of future results. While a rebound is possible, it's equally likely that Ether could continue its downward trend or experience sideways consolidation.
Investors should conduct thorough research, consider their risk tolerance, and diversify their portfolios before making any investment decisions. Stay informed about market developments, technical analysis, and fundamental factors to make informed choices.
Ultimately, the success of a rebound depends on a combination of technical, fundamental, and market factors. While the death cross is a significant event, it's just one piece of the puzzle. By carefully analyzing various indicators and considering the broader market context, investors can make more informed decisions about their Ether holdings.

ETHUSD Ethereum Market Robbery Plan to make moneyMy Dear Robbers / Traders,
This is our master plan to Heist ETHUSD Market based on Thief Trading style Technical Analysis.. kindly please follow the plan I have mentioned in the chart focus on Long entry. Our target is Red Zone that is High risk Dangerous level, market is overbought / Consolidation / Trend Reversal at the level Bearish Robbers / Traders gain the strength. Be safe and be careful and Be rich.
Note: If you've got a lot of money you can get out right away otherwise you can join with a swing trade robbers and continue the heist plan, Use Trailing SL to protect our money.
Stop Loss : Recent Swing Low using 4h timeframe
Warning : Fundamental Analysis comes against our robbery plan. our plan will be ruined smash the Stop Loss. Don't Enter the market at the news update.
Loot and escape on the target 🎯 Swing Traders Plz Book the partial sum of money and wait for next breakout of dynamic level / Order block, Once it is cleared we can continue our heist plan to next new target.
support our robbery plan we can easily make money & take money 💰💵 Join your hands with US. Loot Everything in this market everyday make money easily with Thief Trading Style.

EHE is bullish Jun 6th Update#EHE has a very bullish setup here.
I have shared the breakout setup on May 19th at TTR, the price went MIL:1K off that target already.
TTR is very bullish on ETH and see its leading the crypto markets in next run with at least MIL:1K quick squeeze to test ATH in very near future.
All the timing and targets were posted at TTR.
Ready to squeeze soon, but still can trade in its own triangle for another week or so

Brief ETH Analysis | Bearish Trend? Key S & R Levels 1D TFThe 1D TF chart for Ethereum shows a consolidation period following a significant uptrend. Key events include the publication of the U.S. Consumer Price Index (CPI) on May 12 and circulating news about the upcoming approval of the Ethereum spot ETF, which caused heightened market activity. On May 20, Ethereum's price surged by 21% in a single day, a significant movement compared to the typical 9 - 11% increases. This sharp rise was driven by speculative news and positive sentiment surrounding the potential ETF approval and favorable CPI data.
After this spike, the price entered a range, characterized by increased trading volumes but low volatility candles, indicating market indecision. Recently, an "Inside Bar" pattern has formed: the middle candlestick is a small bearish candle enclosed within the previous large bullish candle, with a potential bullish candle forming today. This pattern highlights market indecision and suggests a potential breakout in either direction.
Currently, Ethereum is testing a critical resistance level around $4K. A breakout above this level, accompanied by increased volume, could signal further upward movement. Conversely, failure to break this level might lead to a pullback towards the support zones.
The current chart analysis shows that ETH is approaching a significant resistance level around $4K, marked by a descending trend line. This resistance has been tested several times, underscoring its importance.
The volume profile indicates consolidation between key support and resistance levels:
◼️ Resistance Levels: Around $3.9K and $4.1K.
◼️ Local Support Levels: Around $3.7K and $3.5K.
◼️ Bullish Scenario: A breakout above $3.9K, accompanied by increasing trading volumes, could signal the continuation of the bullish trend towards the next resistance level around $4.1K.
◼️ Bearish Scenario: If the price fails to break through the resistance and falls below the $3.5K support level, it could indicate a potential bearish reversal or an extended consolidation phase.
Monitoring trading volumes and price movements around these key levels will be critical in predicting the next significant move.
Disclaimer: Content for seasoned traders only. Not financial advice. You bear sole responsibility for trading outcomes. ➖ DYOR 🧠 💡

Ethereum Eyes $3800 as Weekly Wedge Breaks: Bulls Charge ForwardEthereum (ETH), the world's second-largest cryptocurrency by market capitalization, is signaling a potential breakout after a period of consolidation. This technical upswing comes after ETH/USD decisively broke out of a well-defined weekly wedge chart pattern, raising hopes of a surge towards $3800.
Understanding the Weekly Wedge Pattern
The wedge pattern is a common chart formation used by technical analysts to identify potential trend continuations or reversals. In a rising wedge, two converging trendlines, one acting as support and the other as resistance, form a triangle-like shape. This price action often indicates a period of consolidation before a breakout.
In the case of ETH/USD, the recent price movement formed a rising wedge on the weekly chart. The price action respected the trendlines for several weeks, suggesting indecision amongst buyers and sellers. However, a decisive break above the upper trendline signifies a potential bullish continuation.
Bullish Sentiment Emerges
The breakout from the wedge pattern is a bullish technical indicator for Ethereum. It suggests that buyers have finally overpowered sellers and are pushing the price higher. This could be the beginning of a new uptrend, with the upper target of the wedge around $3800 coming into focus.
Several factors could be contributing to the renewed bullish sentiment surrounding Ethereum. The successful completion of the Merge, transitioning Ethereum from a Proof-of-Work to a Proof-of-Stake consensus mechanism, could be a key driver. This upgrade is expected to improve scalability, security, and energy efficiency for the Ethereum network in the long run.
Indicators Support the Breakout
Technical indicators on the weekly chart are also aligning with the bullish breakout. The Relative Strength Index (RSI) is currently hovering around 60, indicating neither overbought nor oversold conditions, leaving room for further upside potential. Additionally, the Moving Average Convergence Divergence (MACD) has generated a bullish crossover, suggesting a potential shift in momentum towards the upside.
Potential Roadblocks and Considerations
While the technical indicators are flashing bullish signals, it's important to acknowledge potential roadblocks that could derail the ETH/USD rally. The overall health of the cryptocurrency market and broader economic conditions will significantly influence Ethereum's price movement.
A resurgence of regulatory scrutiny on the cryptocurrency industry or a broader market sell-off could lead to a pullback in ETH's price. Additionally, unforeseen technical challenges related to the Merge or delays in Ethereum's scaling roadmap could dampen investor sentiment.
What to Watch Out For
Traders and investors should closely monitor key price levels and technical indicators to gauge the strength of the breakout. If ETH/USD can hold above the broken resistance line of the wedge pattern, it would be a positive sign for the bulls. Conversely, a drop back below the trendline could signal a potential breakdown and a return to the consolidation phase.
The trading volume associated with the breakout will also be crucial to watch. High volume breakouts are generally considered more reliable than those with lower volume, as they indicate stronger conviction from buyers.
Conclusion
The breakout of ETH/USD from the weekly wedge pattern is a welcome development for bulls. While the upper target of $3800 remains in sight, continued investor confidence, healthy market conditions, and successful implementation of Ethereum's roadmap will be essential for the bulls to maintain control. As always, proper risk management and close monitoring of technical indicators are crucial for navigating the ever-volatile cryptocurrency market.

ETHEREUM DAILY ANALYSISHello traders, here is an analysis of Ethereum for the next coming days as you can see the price has been bullish for the past weeks and now it has reached a level of resistance(blue zone) that the price tested multiple times and that will be the key for this analysis because now I will wait for the price to break that level of resistance and retest it then I will look for long opportunities.

ETH consolidating before continuing its way to $4KEther extended its gains over the past 24 hours as investors now expect an approval of Van Eck’s application for a spot Ether exchange traded fund (ETF) as early as today or by tomorrow at the latest. This would be the first of nine similar applications to be approved by the Securities and Exchange Commission (SEC).
“ If they approve the Ethereum ETF, they are approving the entire industry. This is the last dam to be broken,” the crypto profile Anthony Pompliano said.
The price of Ether rose another 3 percent on these speculations over the past 24 hours. It has risen by 29 percent over the past seven days.
“If the spot ETH ETF is approved, it will be a true shock to everyone I know in DC who's close to this process. That doesn't mean it won't happen. It means approval could signal a major shift in US crypto policy after the SAB 121 vote, perhaps more important than the ETF itself,” the Chief Legal Officer of Variant Fund, Jake Chervinsky echoed.
The US Congress has turned down the SEC’s proposed SAB 121 regulation, which would have forced crypto custodians to record their clients’ crypto holdings as liabilities on their balance sheet. The concerned financial institutions would incur massive capital expenses if this regulation was enforced. The question now is whether President Joe Biden will veto the decisions of the two chambers as he has indicated he will do, or not.
Enjoying our newsletter? Get access to Lykke's comprehensive range of products and services. Get Lyffe now!
Inflows into the ETH ETFs estimated to reach up to $45 billion
Inflows into the above-mentioned Ether ETFs will reach between $15 and $45 billion by next summer, conditional on their approvals, according to the estimates of the Head of Forex and Digital Assets research at Standard Chartered Bank, Geoff Kendrick. He forecasts that the price of Ether will reach $8,000 by year-end, the Block reports.
Clouds with some sun are gathering over Ethereum in the next 24 hours, but bullish sunny vibes will be back within 3 days and extend to the one-week time horizon. This indicates further upside potential for ETH.
Follow us for more crypto news and weather reports!

ETHUSDT#ETH #Ethereum chart shows a perfect Falling Bullish Wedge formation. It has broken the resistance and maintained above it, confirming the bullish momentum. All we need to do is buckle up. The rise of Ethereum typically signals a revival in altcoins as well.

Ethereum Dilemma: $2,819 Drop or $3K Breakthrout?Ethereum is bearish in the daily chart and can decline to $2,819, where price action will be very important.
The ETHUSD chart has to push up to above $3,006 into the daily range zone towards $3,354, a critical daily resistance.
A sustained price action that we see below $3,006 confirms the weakness, potentially triggering a bearish momentum targeting $2,597.

Ethereum's $3,000 Dilemma: Bullish Rejection, Bearish Break-Out?Indecisiveness persists in the intraday chart as Ethereum hovers around $2,992, an intraday support zone.
1. A bullish rejection of $2,992 with momentum could offer a scalping opportunity, targeting $3,166, $3,370, and possibly extending to $3,551.
2. Closing H4 candles below $2,992 raises the likelihood of a downside move towards $2,898 and $2,787.
3. Alternatively, a lack of momentum may result in sluggish, sideways price action between $2,992 and $3,166.
More details in signature!

Ethereum ETH Intraday Trade SetupAfter failing to re-claim $3,166 yesterday, we saw a decline towards $2,992 zone.
From its current location, the price can move in either direction.
A bullish move towards and break-out of $3,166 followed by a re-test of this level will offer a long scalping opportunity towards $3,370 and, possibly higher, to $3,551.
A bearish break-out of $3,354 will lead to a short-lived dip towards $2,898 and lower to $2,787.
More details in signature.

#ETH/USDT Bullish above this MA...#ETHUSDT appears to be forming a bull flag pattern.
A bullish signal will confirm if we see a close above the blue 75 EMA and a breakout from the flag.
Until then, consider this a retest of the dotted trendline.
Let's wait for the weekly candle to close for more clarity, as the 75 EMA has proven quite reliable on the daily chart!
NFA, DYOR!
Please hit the like button as it helps me and my team to stay motivated and keep posting such important updates for free.
Thank you
PEACE

ETHUSD at a Crossroads: Long or Hold on Ethereum?`The Ethereum (ETH) price action against the US Dollar (USD) presents an interesting conundrum for traders. Recent price movements suggest a potential turning point, and the decision of whether to long (buy) or hold ETHUSD hinges on several key factors.
Prior High as Support: A Bullish Signal?
The current price of ETHUSD sits above a crucial support level – the prior high of around $2,915. This level acted as a resistance barrier in the past, but if breached and held as support, it can indicate a bullish reversal. In technical analysis, support levels are areas where buyers are likely to step in and prevent further price declines. A successful retest of this level strengthens the support and can signal a potential price upswing.
The 200-Day SMA: A Long-Term Trend Indicator
Another significant factor to consider is the 200-day Simple Moving Average (SMA). The 200-day SMA acts as a line of demarcation between a long-term uptrend and a downtrend. Currently, the 200-day SMA for ETHUSD sits around $3,100. If the price can break above this level and sustain it, it can be interpreted as a bullish sign, indicating a potential shift in the long-term trend.
Deciding to Long or Hold: Weighing the Evidence
While the prior high and the 200-day SMA suggest potential bullishness, there are reasons to be cautious before going long on ETHUSD. Here's a breakdown of the factors to consider:
• Market Volatility: The cryptocurrency market is notoriously volatile. Recent price swings highlight this, making it challenging to predict future movements with certainty.
• Macroeconomic Factors: Broader economic factors, such as interest rate hikes and inflation, can significantly impact the cryptocurrency market. Keeping an eye on these developments is crucial before making any trading decisions.
• Technical Analysis: While the prior high and 200-day SMA offer insights, they shouldn't be the sole indicators. Utilize other technical indicators like Relative Strength Index (RSI) and Stochastic Oscillator to gauge price momentum and potential overbought or oversold conditions.
Holding vs. Longing: A Strategic Approach
Given the current market uncertainty, holding ETHUSD might be a more conservative approach. This allows you to observe how the price reacts around the support level and the 200-day SMA. Here are some additional considerations:
• Dollar-Cost Averaging (DCA): DCA involves buying ETHUSD at regular intervals, regardless of the price. This strategy can help average out the cost per unit over time and potentially mitigate the risk associated with buying at a peak.
• Stop-Loss Orders: Implementing stop-loss orders can help manage risk. A stop-loss order automatically sells your ETHUSD holdings if the price falls below a predefined level, limiting potential losses.
Conclusion: Stay Informed and Adapt
The decision to long or hold ETHUSD depends on your individual risk tolerance and trading strategy. By closely monitoring the price action around the prior high and the 200-day SMA, alongside broader market factors and technical indicators, you can make an informed decision. Remember, the cryptocurrency market is dynamic, so staying updated on news and adapting your strategy accordingly is crucial for success.

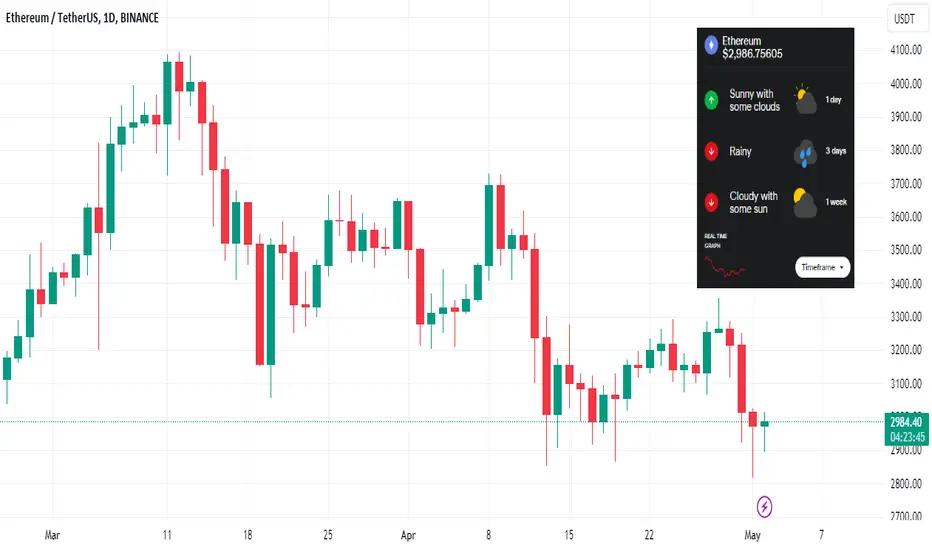
ETH Slightly Bullish 24-Hours ☀, Bearish ☁️ & Downside Next WeekIn the US, there were outflows from the spot Bitcoin exchange traded funds (ETFs) for the sixth consecutive day. “We have seen six consecutive days of outflows, and as the average entry price ($57,300) approaches the current spot price ($59,800), we will likely see more ETF unwinding. Since March 18, the ETFs have seen outflows on 58% of all trading days,” 10x Research said in its daily note.
“This will likely lower prices to our target levels and cause a -25% to -29% correction from the $73,000 top - hence our price target of $52,000/$55,000 during the last three weeks,” the crypto research company forecasts.
In Hong Kong, the first trading day of the spot Bitcoin and ETH ETFs approved proved to be a cold shower with only $12 million flowing into these new ETFs. Analysts had expected up to $300 million. The price of Ether fell 2.5 percent to $2,918 over the past 24 hours.
A slightly bullish sun shines over Ethereum and ATTMO signals a potential upside over the next 24 hours. Over a one-week horizon, bearish clouds are likely to sweep over most of the cryptoverse putting pressure on Ethereum, indicating a potential price drop.
Follow us for more crypto news and weather reports!