Ethereumusd

ETH could climb higher than previous top.I can see MACD is still above the 0 line and turning up.
Stoch RSI is so oversold and price bouncing off the lower band of Bollinger Bands.
It could indicate an imminent uptrend.
This is just an idea. I'm not responsible of your decisions.
=)

This Bullish Signal being Appeared 2nd Time In Ethereum HistoryHi friends hope you are well . welcome to the new update on Ethereum. Today I will show you guys the strongest signal being appeared second time in the history of Ethereum las time this signal produced more than 12000% profit but before moving to that signal I would like to present some midterm and short term analysis.
In previous post we have seen that the price action of Ethereum crossed up the $149.00 resistance and after a small correction rally the priceline moved up and broke out next resistance level t $224.
Simple Moving Averages And Golden Crosses And Oscillators:
After crossing up $224 resistance level we have seen that the moving average convergence divergence (MACD) has turned weak bearish from strong bearish. Before this in previous days after crossing up the resistance the MACD has turned two times weak bearish but every time after a small bullish move the price action moved down. But this time we have better situation because this time the stochastic is in the oversold zone in relevant strength index (RSI) is also very close to the oversold zone therefore we can expect if stochastic will give bull cross from the oversold zone then the price action may take a powerful bullish divergence which can lead the Ethereum to the next resistance level at $310. We have another very positive signal and that is since the price action is retesting the support of $224 the candlesticks are being consolidated at this level and so far this level is not broken down.
Previously we have seen that the simple moving averages with the time period of 25, 50, 100 and 200 are forming golden crosses and only the golden cross between 100 in 200 simple moving averages was remained to be formed. Up till 27th Feb the price action was having a support of 25 simple moving average now the price action has broken down 25 simple moving average support and moving ahead towards 50 simple moving average if the price action will take the bullish divergence from this 50 moving average support and 200 and 100 simple moving averages will form a golden cross then we can see more powerful bullish move then the previous one. At this time the 100 in 200 simple moving averages are moving sideways and so far they are very close to each other and can form a golden cross at any time. But in case the price action breaks down the 50 SMA support then we may see the death cross between 50 and 200 simple moving averages that can lead the Ethereum to hit the previous support level at $149.
Bullish Butterfly Pattern:
Now I have received my favorite bullish signal and that is the formation of harmonic pattern and this time Ethereum has formed a bullish butterfly on 12 hour chart.
Let's dig this pattern deeper to see how perfect this pattern is formed.
The initial leg was started from 16 Feb Up to 19 Feb then after this bullish move the price action started a correction rally and retraced between 0.618 to 0.786 Fibonacci levels then after having correction it moved up and projected between 0.382 to 0.886 Fibonacci projection of A to B leg after this projection move the price action started the formation of final leg that is C to D and this leg is retraced between 1.27 up to 1.618 Fibonacci levels as required for a perfect bullish butterfly pattern. Now from this potential reversal zone the price action is supposed to take the bullish divergence at least up to 0.382 to 0.786 Fibonacci projection of A to D leg. We have another very strong signal and that is the 100 simple moving average has entered in the potential reversal zone just beneath the priceline to provide a strong support.
When the price action will enter in the Fibonacci projection of A to D leg then 0.789 Fibonacci level will be a very strong resistance for the priceline once the Ethereum will cross up this resistance level of 0.786 Fibonacci then the price action of Ethereum can easily hit the next resistance level of $310.
The Most Powerful Bullish Signal By Ichimoku Cloud:
Now let's move to the weekly chart to see the most powerful bullish signal that is being appeared second time in the history of Ethereum and that is ichimoku cloud this indicator is very much important in chartings because Japanese took almost 30 years to develop or create this indicator.
We can see first on 20 Feb 2017 when the price of Ethereum was $12.23 the priceline crossed up the bullish cloud and turn very very strong bullish and from Feb 2017 to January 2018 the priceline achieved the highest price in the history of Ethereum and that was $1594 this was more than 12000 percentage massive profit.
Now this time the price action is again crossing up the ichimoku bullish cloud on week chart at this time almost half of candle sticks crossed up the cloud but sofar the price action is not closed above this cloud.
The conversion line has formed bull cross with base line just beneath the candlesticks and this is good bullish signal.
Lagging span has crossed up the candle sticks but did not cross up the cloud.
Once the candle sticks and lagging span will breakout the cloud and the cloud will be turned bullish again then we can see massive bullish rally by the priceline of Ethereum.
Here another important point is that in directional movement the +DI has formed bull cross with –DI and ADX is moving up like it happened in Feb 2017.
This bullish indication is also in favor of ichimoku bullish move and we can expect that soon the cloud will be turned completely bullish like back in Feb 2017.
And if the cloud will be turned completely bullish then may be it won’t give more than 12000% like it has given in Feb 2017 but atleast it can hit the highest price ever at $1500 because this level is on at 578% away.

ETH Scenario'sPossible scenarios for the future of ETH, i feel likely we will see a bounce off the 0.236 fib line or a return below to the nearest support line.

ETHUSD Stuck on the volatility zone. Buy the pull back.Pattern: Channel Up on 1D.
Signal: Bullish near 225.00. It is a symmetrical pattern of the April-June uptrend.
Target: $360 (just below the Resistance Zone).

Ethereum Triple Top or Divergence Continuation?I mean a triple top wouldn't be the end of the world for Ethereum, the bull run that has sparked is very strong, and showing signs of pushing a lot higher, 0.236 fib line is a strong support and will likely be the pullback point if this formation occurs. A classic bullish divergence can also be observed in which the oscillator produces lower lows, while price produces higher lows! lets see how this plays out.. Go long!

Ethereum Has Confirmed The Signals To Hit $310Recap:
Very warm welcome on Ethereum’s price action update.
First of all I would like to have some recap below was the chart I published on January 2020 and here have seen that the price action had form a bullish Shark pattern and it was expected that the priceline and it was expected that it will produce up to 123% profit and so far it has produced almost 104% and since then the price action of Ethereum is in uptrend.
Long Term Resistance:
In previous post we have seen the long term analysis and as per that analysis the next long term resistance level is $742 dollars.
Mid Term And Short Term Analysis:
In this post we will see the midterm and short term analysis. And our next midterm and short term resistance level is $310.
At this time we are above the resistance level of $234 which was recently broken by the price action of Ethereum and now the price action is likely to form a bull flag but here is a difference at this time in the movement of the price action if we compare this movement with the previous bull rally of Ethereum.
Which was started since Feb to June 2019 at that time after breaking out at the first resistance level at $149 the price action retested the previous resistance as support and then using that support the price action move to the next resistance level then again the priceline of Etherum broke out the next resistance level of $224 and retested the previous resistance as support.
But this time the price action is behaving differently since the recent bull rally is started first the price action broke out the resistance of $149 and without retesting the resistance as a support the price action formed a bull flag and moved to next resistance level t $224 and after breaking out this resistance level the price action again did not retest the previous resistance of $224 as a support and formed another bull flag and at this time the candlesticks are being consolidated within that bull flag.
There are some certain reasons behind this move that the price action could not retest the previous resistance as a support and moving up in a more bullish manner then the previous Bull rally.
Simple Moving Averages Are Forming Golden Crosses:
This is the first reason I found which is not letting the price action moving down to retest the support, whenever price action is breaking out the resistance levels the simple moving averages with the time period of 25, 50, 100, and 200 are forming golden crosses beneath the priceline. For example when the price action broke out the first resistance level at $149 the 25 simple moving average formed a golden cross with 50 moving average which produced the bullish divergence and after that 25 moving average formed a golden cross with 100 moving average which produced more powerful bullish divergence then 25 moving average formed golden Cross with 200 moving average and this golden cross pushed the price action beyond the next resistance level of $224.
Now after breaking out the $224 resistance level the 50 simple moving average has formed a golden cross with 200 simple moving average and this golden cross is the most popular among the traders community the professional traders always seek for this golden cross between 200 SMA and 50 simple moving average to buy any asset. Now when the candlesticks are being consolidated within the bull flag there is another golden cross expected between 100 simple moving average and 200 SMA, and so far they have come very close to each other to form this golden cross and this cross can produce more powerful bullish divergence that the price action may break the next resistance level at $310.
Ascending Triangle:
If we dig the current bull flag more deeper then on 12 hour chart we can see that the price action of Ethereum is caught in an ascending triangle and the ascending triangle is known as continuation pattern and we already know that the price action of Ethereum is in uptrend therefore there are more chances that this uptrend will be continue. I have placed the volume profile on the complete triangle and as a result we can see that the traders interest is very low at the support of this triangle therefore there are less chances that the price action will break down the support of this triangle. The movement of priceline within this triangle is very much synchronized with stochastic and moving average convergence divergence (MACD) indicator, whenever the price action hits at the support of ascending triangle and stochastic gives bull cross and MACD turns bullish the price action moves up and hits the resistance of the triangle. At this time we can see again after hitting the support of the triangle we have received a bull cross from the stochastic on 31st of Feb and MACD turned weak bearish from strong bearish which is a bull signal and now the price action is moving up towards the resistance. The price action may break out the resistance of the triangle or hits this the resistance and move down again to hit the support but now the price action cannot move within this triangle for more time as the end of this pattern is reached at the end of the triangle it is getting more squeezed.
So the price action may take the decision for breakout or breakdown very soon.
Bill William Three Lines And Alligator Mouth:
The Bill William 3 lines and the alligator’s mouth strategy is playing very much important role in this bullish rally like it has performed in the previous bullish rally. Bill William lines comprises of 3 simple moving averages blue one is simple moving average with time period of 13 and this is called Jaw and red one is simple moving average 8 this moving average is called teeth and green one is simple moving average 5 and this moving average is called lips of alligator.
In previous bull rally the price action moved up from Feb 2019 to April 2019 and formed bull flag then Bill William lines opened the alligator’s mouth by crossing the 5 SMA above all moving averages then 8 SMA which is also called teeth crossed the Jaw (the SMA 13) and the price action moved up to the next bull flag. Then the candlesticks consolidated in that bull flag and again the Bill William’s three lines opened the alligator’s mouth and the price action achieved the most recent high in June 2019 which was $363.29. Then the alligator’s mouth of Bill William three lines was closed and the price action turned into complete down trend from July 2019 up to Dec 2019.
Now we can see that we are again in uptrend and bill Williams 3 lines have again opened an alligator’s mouth the first bull flag was formed on 19th of January 2020 then green line crossed up the red line and moved above all moving averages then teeth or simple moving average 8 moved up and came in the center of both moving averages and the blue one which is also called jaw moved up and it was moving below the other two moving averages and a complete alligator is mouth opened and the price action has entered in the recent bull flag.
Now I am expecting that again the simple moving average 5 will cross up the simple moving average 8 and a complete alligator’s mouth will be opened and soon the price action will hit the next resistance level AT $310.

ETHUSD formed bullish Shark | Upto 123% bullish move expected Priceline of Ethereum / US Dollar cryptocurrency has formed a bullish Shark pattern and entered in potential reversal zone.
This PRZ area should be used as stop loss point in case of complete candle stick closes below this area.
I have used Fibonacci sequence to set the targets:
Buy between: 188.73 to 141.31
Sell between: 226.06 to 316.19
Regards,
Atif Akbar (moon333)
Buy between: 188.73 to 141.31
Sell between: 226.06 to 316.19

ETH / USD IN BULL PENNANT - REALLY? - CryptoManiac101ETH / USD TA
We are looking at possible bull pennant coming from ETH vs USD pair. Looking promising however these patterns are prone to bull trapping traders which is why without stop loss you should not even consider entering at this phase. Parabolic curve is another thing we're looking at which thus far has held up.
Trading strategy is to put up a HIGHER RISK long around this area with tight stop losses set and pattern break close (depending on when you're entering)
If you're a bear, you can set a SHORT with low leverage and stop losses over $265

ETH READY FOR A MOVE UP! $300+ OTW!ETH ANALYSIS:
ETH recently broke out of downward channel and is pushing off the trend as I write. It look like ETH is ready to make another wave up as RSI has cooled off and made a small downward move. The RSI looks ready to crack out again. Another exhaustion from buyers should come until 300+. The key resistance here is 285. Once this levels break fully, there is nothing stopping this train from 300-315. I expect the move to come this week as 50 MA crossed over the 100MA in a bullish manner. The volume has bottomed out off the last sell off also, and its expected accumulation phase during that time. Target 1 is at 286.10, followed by T2 at 294.10, and T3 at 301.80. At each level remember to move S/L up!
Possible Entries: $280-280.80

ETHUSD EthereumUSD to 666 Daily Targets6 days of creation, 600 days of noah, 6000 years of man .
The carbon Atom 6 protons 6 neutrons 6 electrons.
666 is highly symbolic, and not exactly evil symbol.
Jonathan Pageau - The Surprising Symbolism of 666
Previous Analysis:
This is not trading/financial advice.

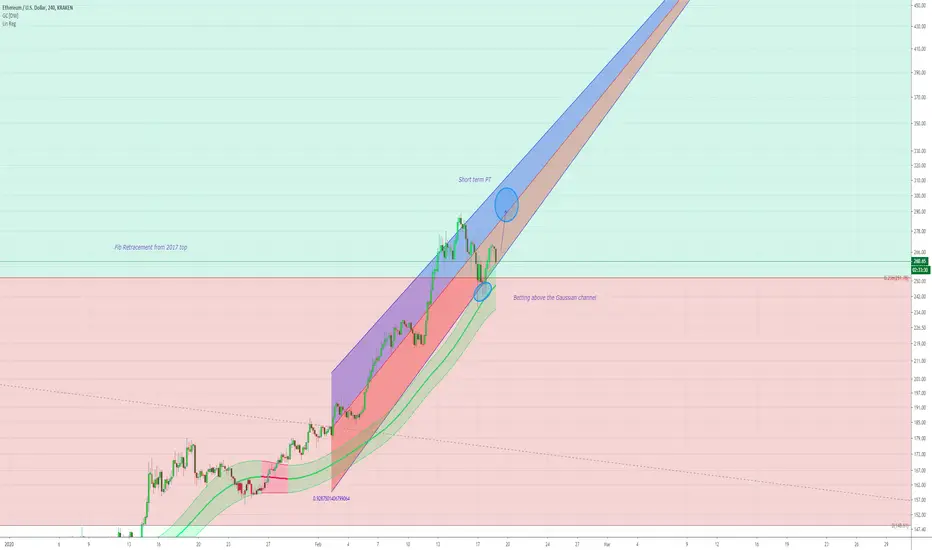
ETHUSD Strong Linear Regression UptrendStronk LR uptrend, 4H chart, currently sitting above the Gaussian channel, looking for a bounce off the top of the channel to further the uptrend. Fib level is a strong support from the 2017 ATH. Short term shot.
ETHUSD Intraday Bullflag1H chart, nice trade entry for margin / leverage traders. Easy profits to be taken at 200MA level. Enjoy.

Ethereum retracement underway...Ethereum is retracing, and rather strongly at that.
Have taken off the earlier trade in anticipation of this retracement.
Weekly chart still appears interact for the bull rally of 2020.
Looking for re-entry...

Ethereum (ETH) Price Prediction 2020 | Complete Long Term AnalysOn Jan 2020 I posted an article where I revealed that the Ethereum has formed a very big bullish harmonic Shark pattern on 2 week chart and the priceline was entered in potential reversal zone of this bullish Shark and it was suppose to take bullish divergence from this PRZ level.
The price action was expected to produce between 59% upto 123% and the price action took bullish divergence from this potential reversal zone and so far it has generated more than 96% profit and at this time the price action of Ethereum is entered in Fibonacci projection area of C to D leg as I predicted.
Ichimoku Cloud Turned Bullis:
Up to week chart the Ichimoku cloud is turned bullish at this time on this week chart the lagging span has crossed up the priceline and that is very bullish indication specially on week chart.
Candle sticks are crossing up the conversion and base line and also crossing bullish cloud once these crosses up will be completed the it will be difficult for the priceline to make a reverse move and cross down the cloud and conversion and base lines, in the meanwhile conversion line is crossing up the base line just below the priceline of Ethereum once this bull cross will be completed the cloud which is again reversed bearish at the moment it will be tunred back bullish.
Indicators And Oscillators:
If we see even on 2 week long term chart then it can be clearly observed that all important indicators and oscillators are turned bullish like the stochastic has given bull cross from oversold zone and we have received this bull cross after Dec 2018.
The moving average convergence divergence (MACD) is turned strong bullish after Jun 2019 and chop zone is also turned bullish after Jun 2019 these indicators are clearly showing that the trend is being changed in favors of bulls now.
Moving Averages:
If we see the movement of simple moving averages with time period of 50 and 200 on week chart then it can be observed that the price action has almost crossed up the 50 simple moving average and fighting the strong resistance of 200 SMA (in black), once the price action will be successful to cross up then it can easily breakout the long term price resistance at $310.97 here one more thing is in favor of this breakout that the momentum is also completed shifted to bulls as there can be seen 1st strong bullish bar in momentum indicator after Jul 2019.
Once this resistance will be broken out then the price action may move to break or hit the next long term resistance at $742.28.
This is a long term analysis there can be many other resistances on short term charts that I am not discussing this time this is a long term perspective post.
I will keep posting more updates on Ethereum when I will find more developments.

Three White Soldiers PatternThree white soldiers is a bullish candlestick pattern, a reversal pattern. This pattern suggests a strong change in market sentiment. The opposite of the 'three white soldiers' pattern is the 'three black crows' pattern.

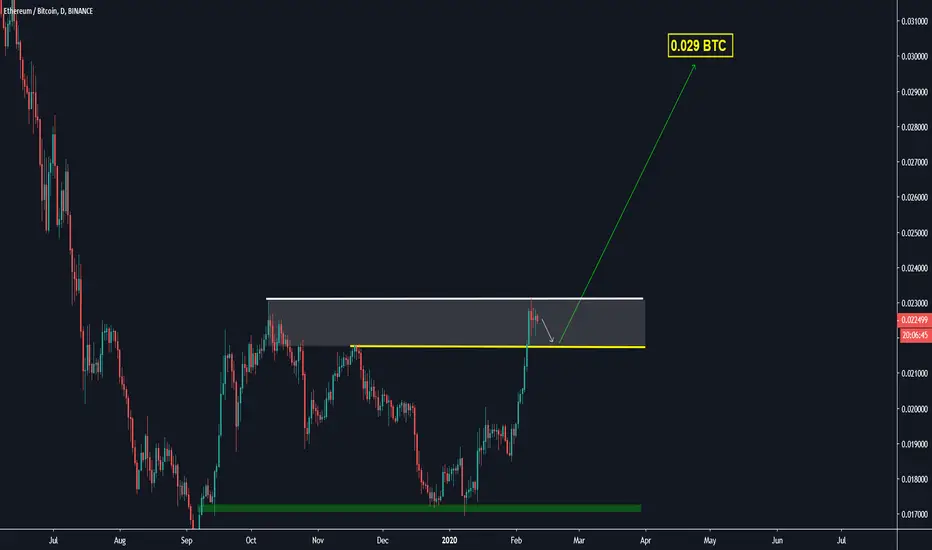
💎 ETH/BTC potential profit 23%! Simple trade inside.Hello everybody!🧑🏻🚀 If you like this chart, Thumb UP!👍
1. ETH broke the resistance level which toke place since January 2019.
2. Also the price still above 200 MA on daily TF.
These 2 things strong bullish factors to continue the trend up through the Fibonacci levels.
My target:
1. Buy 0.0202 BTC
2. Sell 0.0212
3. 2 Sell 0.0252.
4. Stop-loss 0.0191
Good luck in your trade!
________________________________________________________________________________________________________________________________________________________________
Subscribe to my channel and receive fruitful recommendation regularly!
😎 Here just clear and accurate ideas🎯! Max profit idea in crypto - 20%(BTC) Max profit in stock - 40%. Total profit more 300%. Trade my own funds. Consult privately🎩
Link to table with summary results: clck.ru

Don't miss the great buy opportunity in ETHUSDTrading suggestion:
. There is a possibility of temporary retracement to suggested support line (238.70). if so, traders can set orders based on Price Action and expect to reach short-term targets.
Technical analysis:
. ETHUSD is in a Uptrend and the Continuation of uptrend is expected.
.The price is above the 21-Day WEMA which acts as a dynamic support.
. The RSI is at 80.
Take Profits:
TP1= @ 275.30
TP2= @ 319.45
TP3= @ 362.75
SL= Break below S2


CRITICAL INFORMATION - Buying ETH/USD in the next weekETH broke out of the linear regression channel a few days ago with:
Divergence on the MACD
Sky-high inertia
ADX says highly trending
RSI says overbought but rest of the indicators says nobody cares
Squeeze momentum is green for one more day -> small window to buy in today and catch a short term play to the local peak.
Monday we will see a run to 232-235 is my guess, then a small to medium sized correction will happen, perhaps down to 226-228.
However, there may not even be a correction based on the strong MACD divergence and inertia happening on the day chart.
My recommendation is to buy in at 225-226 today.
If ETH breaks below 210 we will see a major correction downwards, but this is unlikely. Stop loss set to 215-218 should be sufficient.
Side notes:
ETH/BTC is going ballistic, upwards, with Ethereum gaining strength relative to Bitcoin. The waters of crypto are shifting.
If Bitcoin corrects heavily in the next few days, traders who wish to keep their money in the crypto-space will move their funds from Bitcoin to altcoins -> Ethereum will see a major rise because of this.
I have been holding ETH since 131 in early January. The gains have been phenomenal. Ethereum will rise to 270-300 in my opinion, based on long term technical analysis (week and month charts) and market factors. A solid argument concerning Ethereum > Bitcoin as a currency is that Ethereum transaction times are much, much faster than Bitcoin's. In terms of long term adoption based on real world use cases, Ethereum is the future of crypto, whereas Bitcoin is a relic of the past.
Good luck, have fun trading!
-dysonring2050

Ethereum Inverted Ascending ScallopInverted ascending scallop, this usually results in a short term bullish continuation, looks like an upside down J.

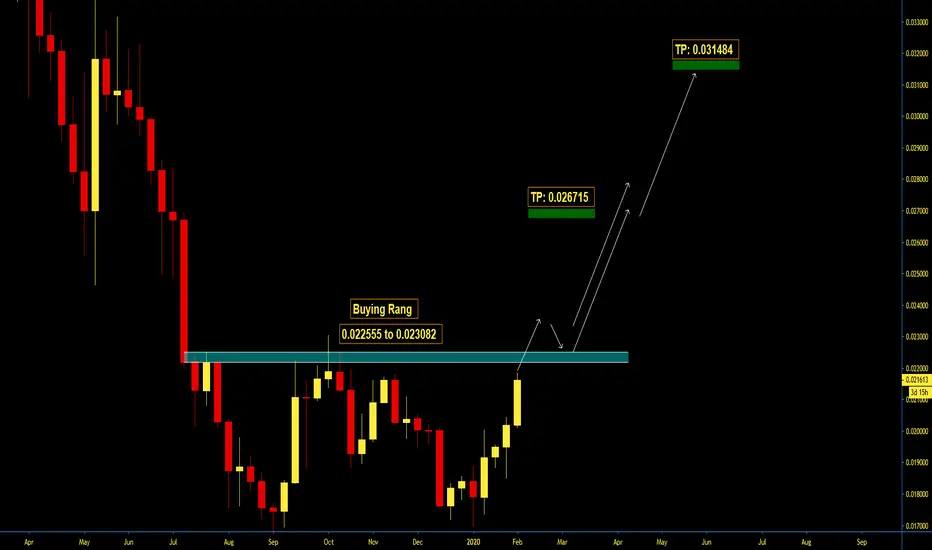
ETH looking strong for 2020 and beyondBoth ETHUSD and ETHBTC are doing giant triangles.
ETHUSD is doing a giant bullflag which could break to the top already very soon.
ETHBTC is doing a giant falling wedge, similar to for example XRP, which will see a strong break to the upside sometime in 2020.
New all time highs for ETHUSD at the latest in 2021.
