Ethereumusdt

ETH usdt to reach the 2k mark?Significant shift north to the upper 1900 area will see a big push to 2000 if it break the resistances.

ETH usdt still trending downwardsAfter seeing ATH's on ETH we're seeing a cool off of the market.
However, this will be short lived as prices are pushed into a wedge to breakout.

Ethereum may complete Cypher move for upto 61% rallyHi dear patrons, hope you are well and welcome to the new update on the Ethereum coin.
On the long-term weekly chart, the price action of the price action of Ethereum with Bitcoin pair,1st formed BAT pattern then Gartley and now completing the final leg of another bullish Cyhper pattern and soon it will be entered in potential reversal zone. On breaking down 25 SMA the move will be confirmed. There is 100 SMA in the potential reversal zone to provide good support.
this trade has a profit possibility of 61%, and the loss possibility is 14.5%.
Note: Above idea is for educational purpose only. It is advised to diversify and strictly follow the stop loss, and don't get stuck with trade.

ETH usdt - pushup back to the ATHWe see a breakout here, interestingly the current 1 & 4 hour support levels were once all time high levels.
Expect to see ETH usdt push to ATH's this week on the back of strong BTC.
ETHEREUM FALLING SOON hello traders ,
Welcome to my price forecast Ethereum/usd.
Ethereum is moving inside upward channel.
there are basically three types of channel directions,
one is upward slopping channel which 80 - 90 % of the time break downside
second is downward slopping channel which 80 - 90 % of the times break upside .
third one is side ways which means market unable to decide the direction and
we can trade inside channel with the help of price action.
now what is price action ?
price action is vast topic but it include candlesticks, support resistance, moving average etc
so here we see in Ethereum price is in upward channel and hopefully it will break downside .
our target is at support level for now .
and we also see bearish divergence which confirms its upcoming fall.
safe entry is after blue line break.
Thanks for watching my idea , have a green day ..

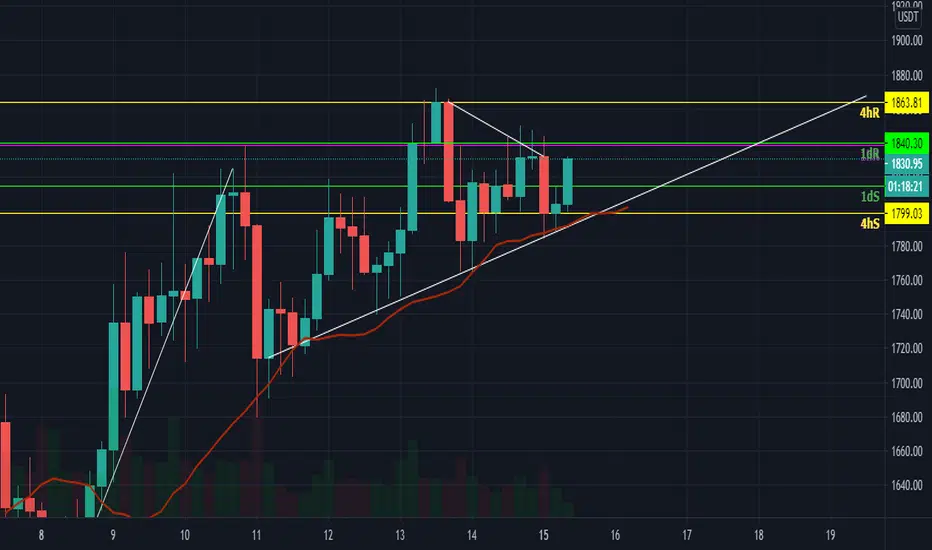
ETH usdt channeling upwards again to reach $1820Strong resistances for ETH.
Strong EMA and trading volumes.
Will it be able to break the 1 day resistance level?

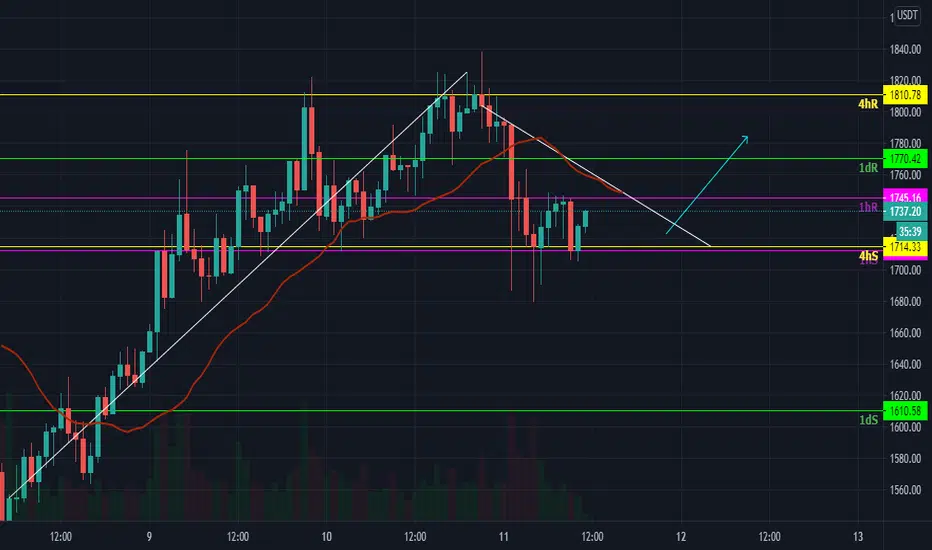
ETH usdt - push down of price to 1 & 4 hour support levels ETH usdt - push down of price to 1 & 4 hour support levels then breakout.
EEMA is weak as is trading volumes. Expect to see ETH back to strength soon.

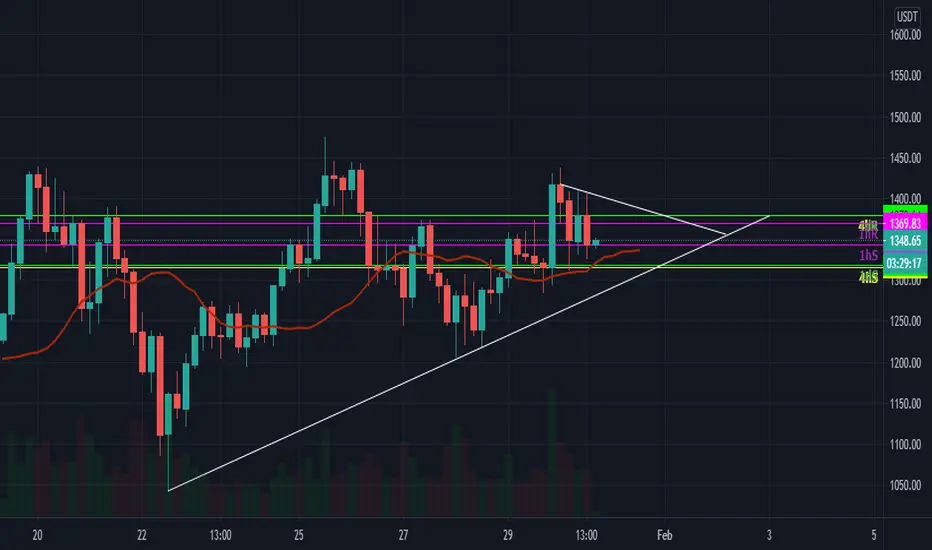
ETH usdt being squeezed into a pennant - to breakout upwards?ETH usdt being squeezed into a pennant - to breakout upwards?
Another ETH expectation (not official)Hi, this post is not official and is not 100% proabable.. do not consider it in your decision making.
Follow us and like and share this post to support us.
Regards

You won't forget ETHEverything is written on the chart. we expect a consolidation but a fast reversal to 2000 $. make sure you have it on your watchlist and into your portfolio. to be specific, we really recommend you to buy in steps while getting closer to the green area. do not buy in green candles. do not get greedy. maybe 20% now and the rest gradually lower.
follow us and comment down your opinion to support and get more TAs.
Regards.

ETHUSDT just bounced off that 1,125 key level... Now to ATH?Yes, please. ;)
We may still see more trading range price action (note the lackluster volume) but as long as 1,125 holds on a daily closing basis, short-term buyers should be on the right side of the market.

ETHUSDT stalling below very key level. What's the significance?1,125 (based on Binance data) is the highest monthly close since JAN-2018. This should be a very significant price to break and would become a strong support level if price does go higher, which IMO is quite probable in the near term.

ETHUSD an expected Cup & Handle Can Lead it to $2200Hi friends, hope you are well and welcome to the Ethereum.
A powerful breakout:
Previously I shared two major moves with you in 2020. One was the Ethereum coin found a weak Ichimoku bearish cloud resistance on the weekly chart and it was expected that this time the Ethereum will breakout this cloud with a powerful bullish divergence.
The second was the big Gartley move on the monthly chart and the priceline was entered in the potential reversal zone of this harmonic pattern.
Finally, the price action of Ethereum coin started a powerful bullish move and rallied from $131 to $1150.
Now the price action is moving above the Ichimoku bullish cloud, and the bullish cloud is moved up at $750.
A big Cup & Handle formation is expected to hit $2200:
On the long-term monthly chart, the price action has formed a very big soft round shape move and found a resistance at $1150. If the price action will be rejected from here then a rally to the downside can complete the Cup & Handle bullish reversal move. This bearish rally can be up to the half of the bottom to the resistance of the Cup, which is $550 approximately. Now if we take the measurement of the hight of the Cup from the resistance to support, and place it at the breakout point then the next target can be $2200 at least.
The EMAs on weekly char and the combination of indicators and oscillators:
If the formation of handle starts then we can expect that the priceline of Ethereum can test the exponential moving averaged 21 on weekly time period chart, that is at $550 at the time of writing. I am also using some additional indicators to get more confirmations. Here I have placed the moving average convergence divergence (MACD), Stochastic and Momentum indicators. At the moment the Stochastic has given bear cross (sell signal) from the oversold zone, but we should wait for MACD and momentum indicators to turn bearish as well, then it can be a confirmation for the starting of correction rally that can complete the formation of the handle.
Conclusion:
If the price action of Ethereum will be rejected by $1150 resistance then it can form a big bullish reversal Cup & Handle that can lead the priceline to $2200 in coming days.

ETHUSD formaing bullish BAT | Upto 22% move expectedOn 4-hour chart, the price action of Ethereum is completing the final leg of bullish BAT pattern, soon it will be entered in the potential reversal zone.
Buying And Sell Targets:
The buying and sell targets according to harmonic BAT pattern should be:
Potential reversal or buying zone: $ 513.56 to $ 497.91
Fibonacci projection or sell zone: $ 550.86 to $ 607.51
Stop Loss:
The potential reversal zone area that is up to $ 497.91 can be used as stop loss in case of complete candlestick closes below this level.
Possible profit and loss ratio:
As per above targets this trade has a profit possibility of 22% and as per the above-mentioned stop loss, the loss possibility is 3.1%.
Note: Above idea is for educational purpose only.

Ethereum - Intraday Update - 12/03/20 (Short-term)Ethereum - Intraday Update - 12/03/20 (Short-term)
Bottom Line: Subdividing higher within wave iii of (iii)

ETHUSDT rising wedge could explain this week's selloff?Looking at the weekly chart, market appears to have reacted to a rising wedge's resistance trend line this week in the form of an impulsive sell-off. While this is considered a bearish structure, I still see a strong bull trend that, in terms of probabilities, may continue higher.
With potentially trapped bears (no follow through sell-off yet) and weak bulls that are potentially going to get "trapped out", I am near-term bullish above 430, and maybe 360. This thing could get FOMO'ed to high heavens! :)

ETHUSDT pushing higher. Looking for a daily close above 395.A daily and weekly close above 395 should signal strength for Ethereum and would probably be followed shortly by a test of the recent highs.
I am particularly watching that 433 level which represents the highest weekly closing price since 2018.

Ethereum $eth $360 support is acting good but price below trendEthereum $eth $360 support is acting good but price is below trend line. $360 support is important level for ethereum now if this support broken then you will see another downtrend. |For more upward movements price need to come back and sit above the trend line that is at $420 level.
more details shown in the chart. we keeping eye on price action .
for more details please follow us.
thanks

Ethereum Up or Down ?NOTE: Not a guaranteed outcome, DYOR before Investing.
In my previous chart, I correctly predicted ETH long from $335 to $370-$380 and I am still long on ETH.
$363- Long
Take profit - If you want to play safe put it at $480, else let it go till $700.

ETHUSDT still in a trading range. Bulls need to break 395...Ethereum showing some strength recently but is still trapped within a 5-week range. Bulls need a weekly close above 395 which is the high of the range and which the bears might be viewing as the first lower high of a new bear trend forming. A show of strength from the bulls could help dispel that...

Ethereum is breaking out the midterm resistanceHey friends hope you are well and welcome the new update on Ethereum (ETH) coin.
The priceline is being consolidated at $350 support level. The next supports are at $325, $280 and the next resistance levels are at $400 and then $800. On long term there is no significant resistance between $400 and $800. Therefore incase of breaking out $400 resistance the priceline can move at $800 very soon.
On daily chart priceline has broken down 25 and 50 simple moving averages and now retesting the 100 SMA support 1st time after May 2020, and likely to have nice bounce from here.
On daily chart from 13 Aug the price action of Ethereum is moving in a down channel. At the moment the candlesticks are trying to breakout the resistance of the channel in the meanwhile the priceline of second largest cryptocurrency is also breaking out the exponential moving averages with the time period of 10 and 21.
After September 2020 the price action has found a very strong resistance on small time period 4 hour chart. The Ethereum’s price action has been rejected several times by this rejection line. Now finally the priceline is breaking out this strong resistance line. After this break out the price action can easily breakout the resistance of the down channel on daily chart.
The priceline of ETH is still moving above the ichimoku cloud and the ichimoku cloud is still bullish.
Conclusion:
On 4-hour chart the priceline is breaking out the midterm resistance line. If this resistance will be broken out then we can expect the breakout from the down channel on the daily chart as well. However as stop loss we can use the support of the channel to minimize the risk factor.
